
INTRODUCTION
After oral administration, dosage forms are exposed to a highly variable gastrointestinal (GI) environment. Particularly important for drug dissolution and absorption are properties of the fluids along the human GI tract: the composition, presence of solubilizing components, buffer capacity, volumes, pH values, viscosity, as well as hydrodynamics, which includes also gastric emptying (GE) patterns of the gastric content (1). The GI fluid properties are usually studied for healthy adults and great intra- as well as inter-individual differences are observed. Age, accompanying diseases, and co-medication can additionally contribute to variability and changes in several of these GI parameters (2).
The mean pH of the fasted gastric fluids in healthy human subjects, reported in a meta-analysis, is 1.88 (3). pH values below pH 3 are generally found in the stomach of a healthy adult (4). However, higher pH values even above pH 5 were observed, which were most likely caused by co-administered water and/or swallowed saliva (5, 6). Another possibility for increased gastric pH value is reduced or absent secretion of hydrochloric acid in the stomach (hypo- or achlorhydria), which is reportedly more frequent among the elderly compared to younger adults (7). The fasted resting gastric volumes range from 1–96 mL with average values normally observed between 26 and 45 mL (8–11). Both, gastric pH value and resting gastric volume exhibit a high inter- and intra-subject variability (8, 12).
It is usually advised to consume orally administered formulations together with a glass of water. The same practice is applied in fasted-state bioequivalence studies: along with the medicine, at least 150 mL of the fluid or 240 mL of water should be ingested according to the European Medicines Agency (13) and The United States Food and Drug Administration (14), respectively. Immediately after the administration of 240 mL of water in a fasted state, the gastric fluid volume increases to 270 ± 20 mL (9). The same amount of water empties from the stomach within 15 to 60 minutes (8), which correlates with the results from another study, where the gastric volume returned to its basal state 45 minutes after ingestion of 240 mL of water and the calculated GE half-time was 13 ± 1 min (10). A considerably shorter GE half-time of 240 mL of water was reported in other research, 7 ± 4 min, indicating that GE half-time might not be the best parameter for assessing the GE rate and its variability as can be calculated using different models (15).
The physical properties of ingested liquids (or foods), especially their volume and caloric value, influence greatly the GE rate (8, 16). In a fasted state, the GE rate also depends on cyclic phases of the migrating motor complex (MMC), particularly for smaller ingested liquid volumes (50 mL compared to 200 mL) (8, 17, 18). For larger volumes (200 mL), the GE rate is mostly governed by fluid volume (18). Although GE usually begins immediately after ingestion of water, the lag time was also present in some volunteers (19). After ingestion of 50 mL of non-caloric fluid, the lag time before GE occurred and was reported to decrease with increased gastric motility – i.e. in the late MMC phase II/phase III the lag time was the shortest (18). Age itself does not have a significant effect on GE, but several diseases or drugs could influence GE (20, 21). Besides changing the gastric pH value, achlorhydria can alter other parameters of the GI tract. This was demonstrated also in a study assessing the GE of 300 mL of orange juice, with achlorhydric elderly subjects showing slower GE compared to control elderly subjects (22). The changed GI parameters in subjects with achlorhydria were also shown to influence drug pharmacokinetics as dipyridamole tmax was longer in achlorhydric volunteers despite pre-treatment with glutamic acid hydrochloride was used to decrease gastric pH value to a pH similar to that of control subjects (22).
GE patterns can influence the absorption of several drugs, especially those that can rapidly dissolve in the stomach and then immediately absorb from the small intestine. For paracetamol, plasma concentration profiles have been correlated to GE kinetics in a fasted state in several studies (23–25). Similarly, the absorption of theophylline was correlated to different GE patterns (26). Additionally, larger volumes of co-administered water reduced the variability of nifedipine maximal plasma concentrations (27). The differences in fluid pH values throughout the GI tract and different motility patterns in the stomach were reported to influence ibuprofen fasted state plasma concentrations (28). Also, the variability in plasma concentrations and the appearance of double peaks in the case of cimetidine were correlated to the application of the drug in different MMC phases, as cimetidine absorption is sensitive to GE patterns (29).
The concomitant ingestion of water with the dosage form and its gastric emptying thus influences several parameters that can affect drug dissolution and, consequently, in some cases also its absorption from the small intestine. The aim of this study was to implement the variability in GE kinetics following the administration of 240 mL of water in an in vitro dissolution model and to assess its influence on model drug dissolution. For this purpose, a simple in vitro model was established with the ability to simulate different individual in vivo GE patterns following the ingestion of 240 mL of water. The variability in basal gastric pH value was also simulated in the in vitro model by two different hydrochloric acid (HCl) concentrations. Additionally, the simulation of water ingestion and different GE patterns also caused dynamic pH changes in the working vessel of the flow-through in vitro system. Using the developed model, the combined effect of these parameters on the dissolution behaviour of three model drugs with different physicochemical properties, paracetamol, diclofenac sodium, and dipyridamole from immediate-release tablets was assessed.
EXPERIMENTAL
Paracetamol (PAR), diclofenac sodium (DF-Na), and dipyridamole (DPL) were purchased from Merck KGaA (Germany). Titrisol® HCl concentrate was purchased from Merck KGaA (Germany) and suitably diluted to produce a 1 mol L–1 HCl solution. Hydroxypropyl methylcellulose (HPMC, Pharmacoat® SB-4) was manufactured by Shin-Etsu (Japan) and kindly donated by Harke Pharma (Germany). Lactose monohydrate Ph. Eur. was purchased from Caesar & Loretz GmbH (Germany), and magnesium stearate was purchased from Peter Greven (Germany).
Tablets consisted of 25 % drug (paracetamol, diclofenac sodium, or dipyridamole), 66.5 % lactose monohydrate, 7.5 % HPMC Pharmacoat® SB-4, and 1 % magnesium stearate. After manual mixing of the tablet blend, tablets with a mass of 400 mg were manually compressed at the Faculty of Pharmacy, University of Ljubljana, using Kilian SP300 instrumented single punch (IMA Kilian, Germany) with 12 mm flat-faced punches. The tablet thickness was approximately 0.27 cm. The compression forces were specific for each formulation but corresponded to tablet hardness between 100-110 N regardless of the drug used.
Data on gastric fluid volumes after ingestion of 240 mL of water in 12 healthy adults were obtained from the literature (10) and the numerical data was kindly provided by the corresponding author, Prof. Luca Marciani, by personal communication. Fluid volumes at different time points and the calculated flow rates from obtained volumes between consecutive time points were compared and two distinct individual GE patterns were selected for simulation in the in vitro dissolution system that represented two borderline variations in GE kinetics. From the in vivo study (10), the GE pattern of subject 8 was selected for simulation and was marked as slow water GE, and the GE pattern of subject 13 was selected and marked as fast water GE.
The volume of the medium in the working vessel at the beginning of the experiment simulated the gastric volume at the time of water ingestion in the in vivo experiments. This volume was adjusted to 275 mL, representing a sum of the average in vivo basal volume of gastric fluid (35 mL) and 240 mL of co-administered water (10). Since the first measurement of in vivo gastric volume was 2 minutes after water administration, the volume in the vessel reflected in vivo gastric volume from this point onward. The simulation of both GE patterns in the in vitro system was finished when the volume of the medium in the working vessel decreased to the average basal gastric fluid volume determined in the in vivo study, i.e. 35 mL (10). From this point onward, a basal volume of 35 mL was maintained in the working vessel.
Dissolution experiments were performed using two systems: a glass-bead flow-through system, where the selected individual GE patterns were simulated, and a compendial apparatus II dissolution system using a volume of the media 420 mL. A description of the methodology is provided further in the text and the experimental conditions are briefly described in Table I. All experiments were performed in triplicates.
Table I. Experimental conditions in the dissolution studies using the glass-bead flow-through system and apparatus II system
For the in vitro simulation of different GE patterns, a glass-bead flow-through dissolution system, developed at the Faculty of Pharmacy, University of Ljubljana, was used. A detailed description of the system’s basic characteristics is written elsewhere (30). The dissolution from the tablet in the in vitro flow-through system took place in a working vessel with a changing volume of the medium. 25 g of glass beads (diameter 1 mm) were added to the vessel. The layer of glass beads and the medium were stirred by a magnetic stirring bar with a speed of 50 rpm. The original system was established to maintain a constant volume of the medium in the working vessel by pumping fresh medium in and sample out of the vessel with the same flow rate. Within this study, the system was accordingly adapted to enable continuous changes in the volume of medium in the working vessel throughout the experiment that correspond to individual gastric volumes and thus simulate the GE patterns.
The basal gastric pH value was represented by HCl solution; two different concentrations were used, 0.05 mol L–1 or 0.001 mol L–1 HCl. 35 mL of the HCl solution was first combined with 240 mL of purified water. 275 mL of the prepared mixture at room temperature was added to the working vessel that was placed in a heated (36.5 °C) water bath. A tablet was added to the vessel immediately after dosing the medium and the experiment then began. This way, the temperature of the dissolution medium at the beginning of the experiment was lower than the set temperature of 36.5 °C to simulate the co-administration of water at room temperature with the dosage form. Throughout the experiment, fresh 0.05 mol L–1 HCl or 0.001 mol L–1 HCl solution was delivered to the working vessel at a constant flow rate of 2 mL min–1, simulating the gastric acid secretion. The flow rates used to pump the samples out of the working vessel were changed accordingly to enable the simulation of different water GE patterns.
Samples were pumped out of the working vessel through a mesh with pore sizes of approximately 500 µm, placed at the end of a silicone tube. The mesh served as a coarse filter to prevent larger particles from entering the tube. Samples were collected in pre-determined time intervals and were simultaneously prepared in two ways: 1) by filtration and dilution – this way the amount of dissolved drug was determined or 2) by dilution with a medium in which the drug is well soluble – the total amount of transferred drug was determined this way. Filtration was performed through 0.45 µm RC membrane filters (Sartorius Minisart RC, Sartorius, Germany; the first few mL of filtrate was discarded). Samples were then analysed using a UV-Vis spectrophotometer (Agilent 8453, USA). The concentrations were calculated from measured absorbances at absorption maximum, specific for each drug: 243 nm for PAR, 276 nm for DF-Na, and 284 nm for DPL. In the flow-through experiments, the cumulative amount of dissolved/transferred drug was calculated.
Dissolution experiments using the compendial apparatus II (according to European and United States Pharmacopoeia; Agilent 708-DS, Agilent Technologies, USA) were performed in a standard 1 L vessel at 37 ± 0.5 °C with a paddle rotation speed of 75 rpm. The volume of the medium was set to 420 mL, which is equivalent to the total volume of the sample pumped out of the working vessel within the duration (90 minutes) of the flow-through experiments. The dissolution medium was 0.05 or 0.001 mol L–1 HCl, reflecting the pH of the basal gastric fluid, or water dilutions of these HCl solutions in an equal volumetric ratio as used at the beginning of the experiments in the flow-through dissolution experiments – the details are presented in Table I. For the purpose of clarity, the experiments with 0.0064 mol L–1 HCl and 0.00013 mol L–1 HCl concentrations are named according to the concentration of HCl used to simulate basal gastric fluid pH value for the experiment, i.e. diluted 0.05 mol L–1 HCl and diluted 0.001 mol L–1 HCl, respectively.
Sampling was performed automatically at pre-determined time points through the cannula equipped with 1 µm full-flow filters. Samples were then suitably diluted and analysed the same way as in the flow-through experiments (described above). The percentage of drug released was calculated at each time point and media/drug loss due to sampling was considered in the calculations.
pH and temperature measurements of the medium in a working vessel of the flow-through system were carried out in separate experiments using the same media and simulated GE patterns as in the dissolution experiments. Both parameters were measured using a Seven Easy pH meter equipped with an InLab Expert Pro electrode with automatic temperature measurement (Mettler Toledo GmbH, Switzerland). The apparatus was calibrated to pH values 2, 4, and 7. pH measurements during simulations of both GE patterns without a tablet in the vessel or with PAR, DF-Na, or DPL tablet present in the working vessel were performed in triplicate. The temperature of the medium was recorded only during experiments without tablets.
Measurements of pH value during PAR, DF-Na, or DPL dissolution in apparatus II were also performed in separate experiments. For media with the lowest HCl concentration, 0.001 mol L–1 HCl and diluted 0.001 mol L–1 HCl, three replicates were performed. Due to higher HCl concentration and thus low pH that was not expected to change drastically in experiments with 0.05 mol L–1 HCl and diluted 0.05 mol L–1 HCl, only one pH measurement parallel was completed for these conditions.
RESULTS AND DISCUSSION
The human GI tract is a highly variable and complex system, and thus dissolution testing using the conventional apparatus often leads to a poor prediction of dosage form and drug in vivo behaviour. To increase the in vivo predictability, dissolution studies using non-compendial in vitro systems with simulation of various physiological factors are of great importance. Different multicompartment models are used to simulate the passage of dosage forms/drugs along the GI tract (31). Some models focus primarily on changes in the gastric volumes after co-administration of formulation with water (32–36). To increase physiological relevance, some in vitro models also simulate the gastric motility patterns during MMC cycles (37–40). The complexity of these non-compendial models thus depends mainly on the number of physiological factors simulated. Additionally, as GE is not always a mono-exponential process (23), the simulation of the more complex GE patterns further complicates the in vitro models.
In this study, a glass-bead flow-through system was established to simulate and assess the effect of distinct water GE patterns and variability in gastric pH values on the dissolution of three model drugs with different physicochemical properties from immediate-release tablets. As a comparison, dissolution in a compendial apparatus II system using a media volume of 420 mL was also performed.
As the in vitro flow-through system has its limitations, a few adjustments of the data on in vivo gastric volumes were necessary to perform the in vitro simulation of the GE patterns. The selected in vivo GE patterns of two individuals from the literature (10) differed from each other in several parameters, including the measured basal gastric volume (determined 4 minutes before water ingestion) and the volume of the gastric fluid at the last measured point 2 hours after water ingestion. To evaluate only the influence of different GE kinetics in the established in vitro system, these two values were set to the average basal gastric volume, i.e. 35 mL, calculated from gastric volumes of all 12 volunteers in the same in vivo study (10). Thus, along with the addition of 240 mL of water, the total medium volume at the beginning of the in vitro flow-through experiments was 275 mL for both simulated GE patterns. Furthermore, the in vitro GE patterns were simulated up to the timepoint, where the in vivo measured gastric volume decreased to 35 mL. The time needed to reach this volume in the vessel was 24.8 min for the fast water GE pattern and 56.2 min for the slow water GE pattern, which is in accordance with literature data where 240 mL of water was emptied from the stomach within 15–60 min (8). The measured gastric fluid volumes of two selected individuals from the literature (10) and volumes of the medium in the working vessel during the in vitro GE pattern simulations are represented in Fig. 1.
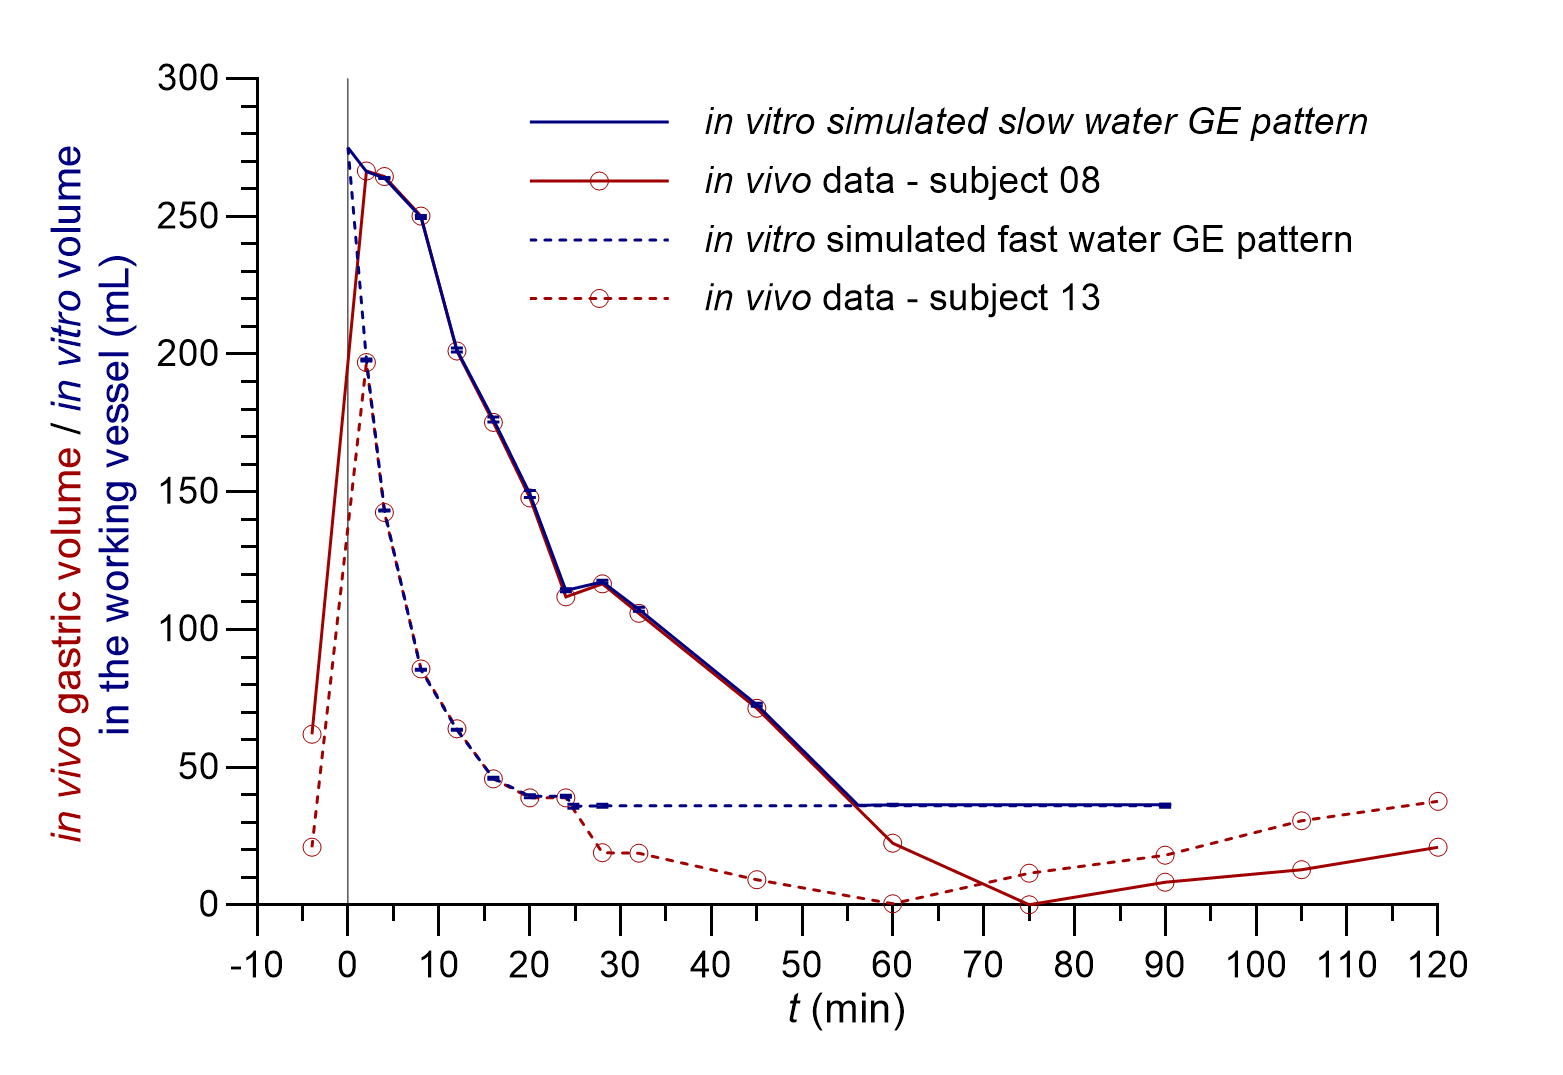
Fig. 1. In vivo measured gastric fluid volumes (red lines) of two individuals with different GE patterns (redrawn from data provided by personal communication and published in reference 10) and the volume of the medium in the working vessel during in vitro simulated fast (dashed blue lines) and slow water GE pattern (solid blue lines) (the average of three replicates with standard deviations is presented).
The correlation of the in vitro determined volumes of the medium in the working vessel to in vivo measured gastric fluid volumes was good with differences of less than 5 % during GE pattern simulation, i.e. from the 2nd minute onward (maximal in vivo measured volume) until the last simulated timepoint before the basal volume of 35 mL was reached in vivo. The reproducibility of the simulated GE patterns was good with the relative standard deviation (RSD) of three replicates less than 2 % at all time points.
The variability of in vivo basal gastric fluid pH value was in our in vitro model simulated by two different HCl concentrations: 0.05 and 0.001 mol L–1 HCl, with pH values of approximately 1.3 and 3. In our experiments, additional dilution with water produced HCl solutions with concentrations of 0.0064 and 0.00013 mol L–1 with calculated pH values of 2.2 and 3.9, respectively. As expected, the measured pH values in the in vitro system differed slightly from the calculated pH values. During the simulation of water GE patterns, 0.05 or 0.001 mol L–1 HCl solution was continuously delivered into the working vessel at a constant flow rate which represented the secretion of basal gastric fluid. Therefore, the pH value of the medium in the working vessel gradually decreased towards the pH of the simulated basal gastric fluid. The pH decrease rate depended also on the simulated fluid GE pattern, as shown in Fig. 2.
An increase in gastric fluid pH value after water ingestion was observed also in an in vivo study after drinking 200 mL of water. The increase of pH values above pH 4 persisted only for a short period of time, in a range between 1 and 4 minutes (41). Additional studies also indicate that the extent of pH increase after water ingestion could be influenced by basal gastric volume; namely, a lower volume could lead to a greater pH change (8, 42). The volume of ingested tap or mineral water and its buffer capacity could also influence the increase in gastric fluid pH value (41). In our flow-through in vitro studies, 240 mL of purified water increased the measured pH value of the medium in the working vessel by approximately one pH unit. Furthermore, pH values above 4 were in our experiments achieved only when the lowest HCl concentration was used, and such increase persisted for approximately 6 and 10 minutes when fast and slow GE patterns were simulated, respectively. The required time for the decrease in pH value of the medium in the working vessel back to pH similar to simulated gastric fluid pH value was, however, relatively long in our experiments, even up to 1 hour, and depended on the simulated GE kinetics as can be seen in Fig. 2.
Additionally, the medium temperature change was also monitored during the GE pattern simulation in a flow-through system and is also presented in Fig. 2. The initial temperature was around 26 °C which then gradually increased to achieve the set temperature (36.5 °C). As in the case of pH change, the simulated GE pattern also influenced the kinetics of temperature increase, which was faster in experiments with the simulation of a faster GE pattern. The measured temperature was similar to the temperature in some other studies also simulating GE patterns (37) and correlated relatively well with the temperature change measured in vivo in individuals after ingestion of 240 mL of water at room temperature (43).
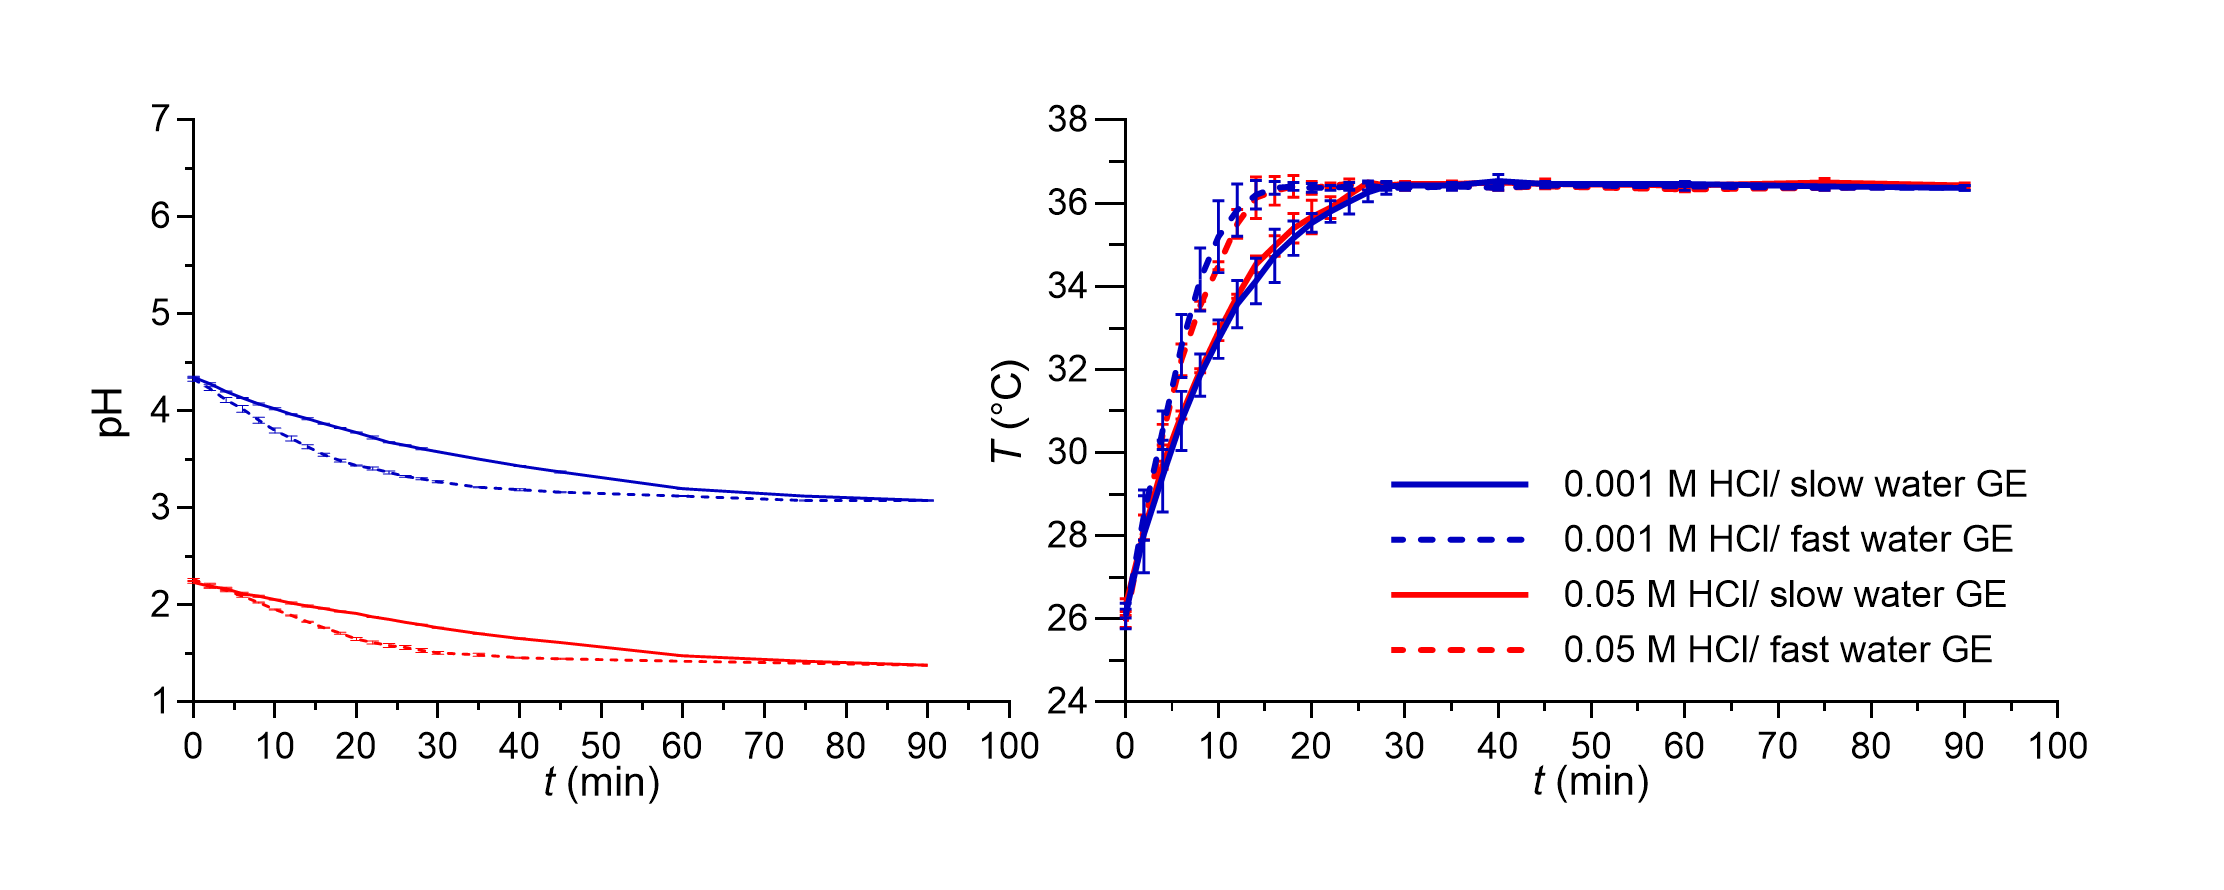
Fig. 2. pH value (left panel) and temperature of the medium (right panel) in the working vessel in the in vitro flow-through dissolution experiments during simulation of fast (dashed lines) and slow (solid lines) GE patterns for both media used without tablets in the system. Average values of three replicates and standard deviations are presented.
Despite its variability, the GE of the administered 240 mL of water is still relatively fast. Similarly, the key processes in dissolution from immediate release formulations occur shortly after their administration and thus coincide with the time interval of water GE. Therefore, the effect of GE patterns on drug dissolution from immediate-release tablets in our study was expected. Three model drugs with different physicochemical properties were used in formulations. A simple composition of tablets with the same dose (100 mg) regardless of the drug was used with only a few necessary excipients to limit the possibility of excipient interferences with drug dissolution.
The use of two systems, the glass-bead flow-through system and compendial apparatus II enabled us to assess the applicability of the newly developed in vitro dissolution model. Using the flow-through system, simulation of the GE pattern in the working vessel was possible, which could not be simulated using the conventional apparatus II. The established flow of the medium in and out of the vessel in the flow-through system also enabled continuous changing of the pH value of the medium in the working vessel and its effect on dissolution was thus also studied. However, it has to be pointed out that the obtained dissolution profiles from the flow-through experiments represent the amount of dissolved drug in the samples pumped out of the working vessel and are thus not influenced solely by drug dissolution/release from the dosage form but also by the established flow rate. The dissolved drug therefore simulates the appearance of the drug in the upper small intestine which is available for absorption. Thus, the influence of different GE rates, especially in relation to drug release rate from the dosage form, is expected to be seen well from these results.
To assess the suitability of the developed in vitro model, experiments were first performed using PAR tablets. PAR has a p Ka value of around 9.2 and is well-soluble at all lumenal pH values; the solubility of PAR in water is similar to solubility in 0.1 mol L–1 HCl or phosphate buffer pH 6.8, i.e. around 16 g L–1 (44–46). PAR is rapidly absorbed from the small intestine and it has been indicated that the differences in GE kinetics directly influence PAR pharmacokinetic parameters, therefore, it has been used in several in vivo studies as a marker for GE (23, 25).
Fast paracetamol dissolution was assumed and was also seen from the apparatus II results. The expected significant influence of the simulated GE rate was also further confirmed as a faster simulated GE pattern contributed to a faster PAR dissolution profile in the established in vitro flow-through dissolution system (Fig. 3). The obtained dissolution profiles in the flow-through model are a result of paracetamol dissolution in the working vessel and the pumping of the sample out of the working vessel that enabled the GE simulation. PAR tablets completely disintegrated in approximately 25–30 minutes in the flow-through system and in around 40 minutes in the apparatus II experiments. A higher mechanical burden on the tablet due to its constant contact with glass beads in the flow-through system can thus speed up tablet disintegration and can also contribute to faster drug dissolution. However, when assessing differences in the obtained dissolution results using both systems, the PAR dissolution profile was still faster in apparatus II experiments compared to experiments in the flow-through system. This difference can be related to specific characteristics of the models. Due to the good solubility of PAR at all pH values, the volume of the medium should not affect significantly PAR dissolution, indicating that the observed differences in PAR dissolution kinetics between dissolution systems are thus primarily attributed to the use of (distinct) flow rates within the flow-through system, and not different drug dissolution. Namely, paracetamol release from the tablets in the working vessel is faster than pumping the dissolved drug out of the vessel. As PAR absorption is affected directly by GE (20), the results obtained within the flow-through system by simulation of different GE patterns, which are in accordance with in vivo GE rates, might thus reflect well the in vivo processes influencing PAR plasma concentrations.
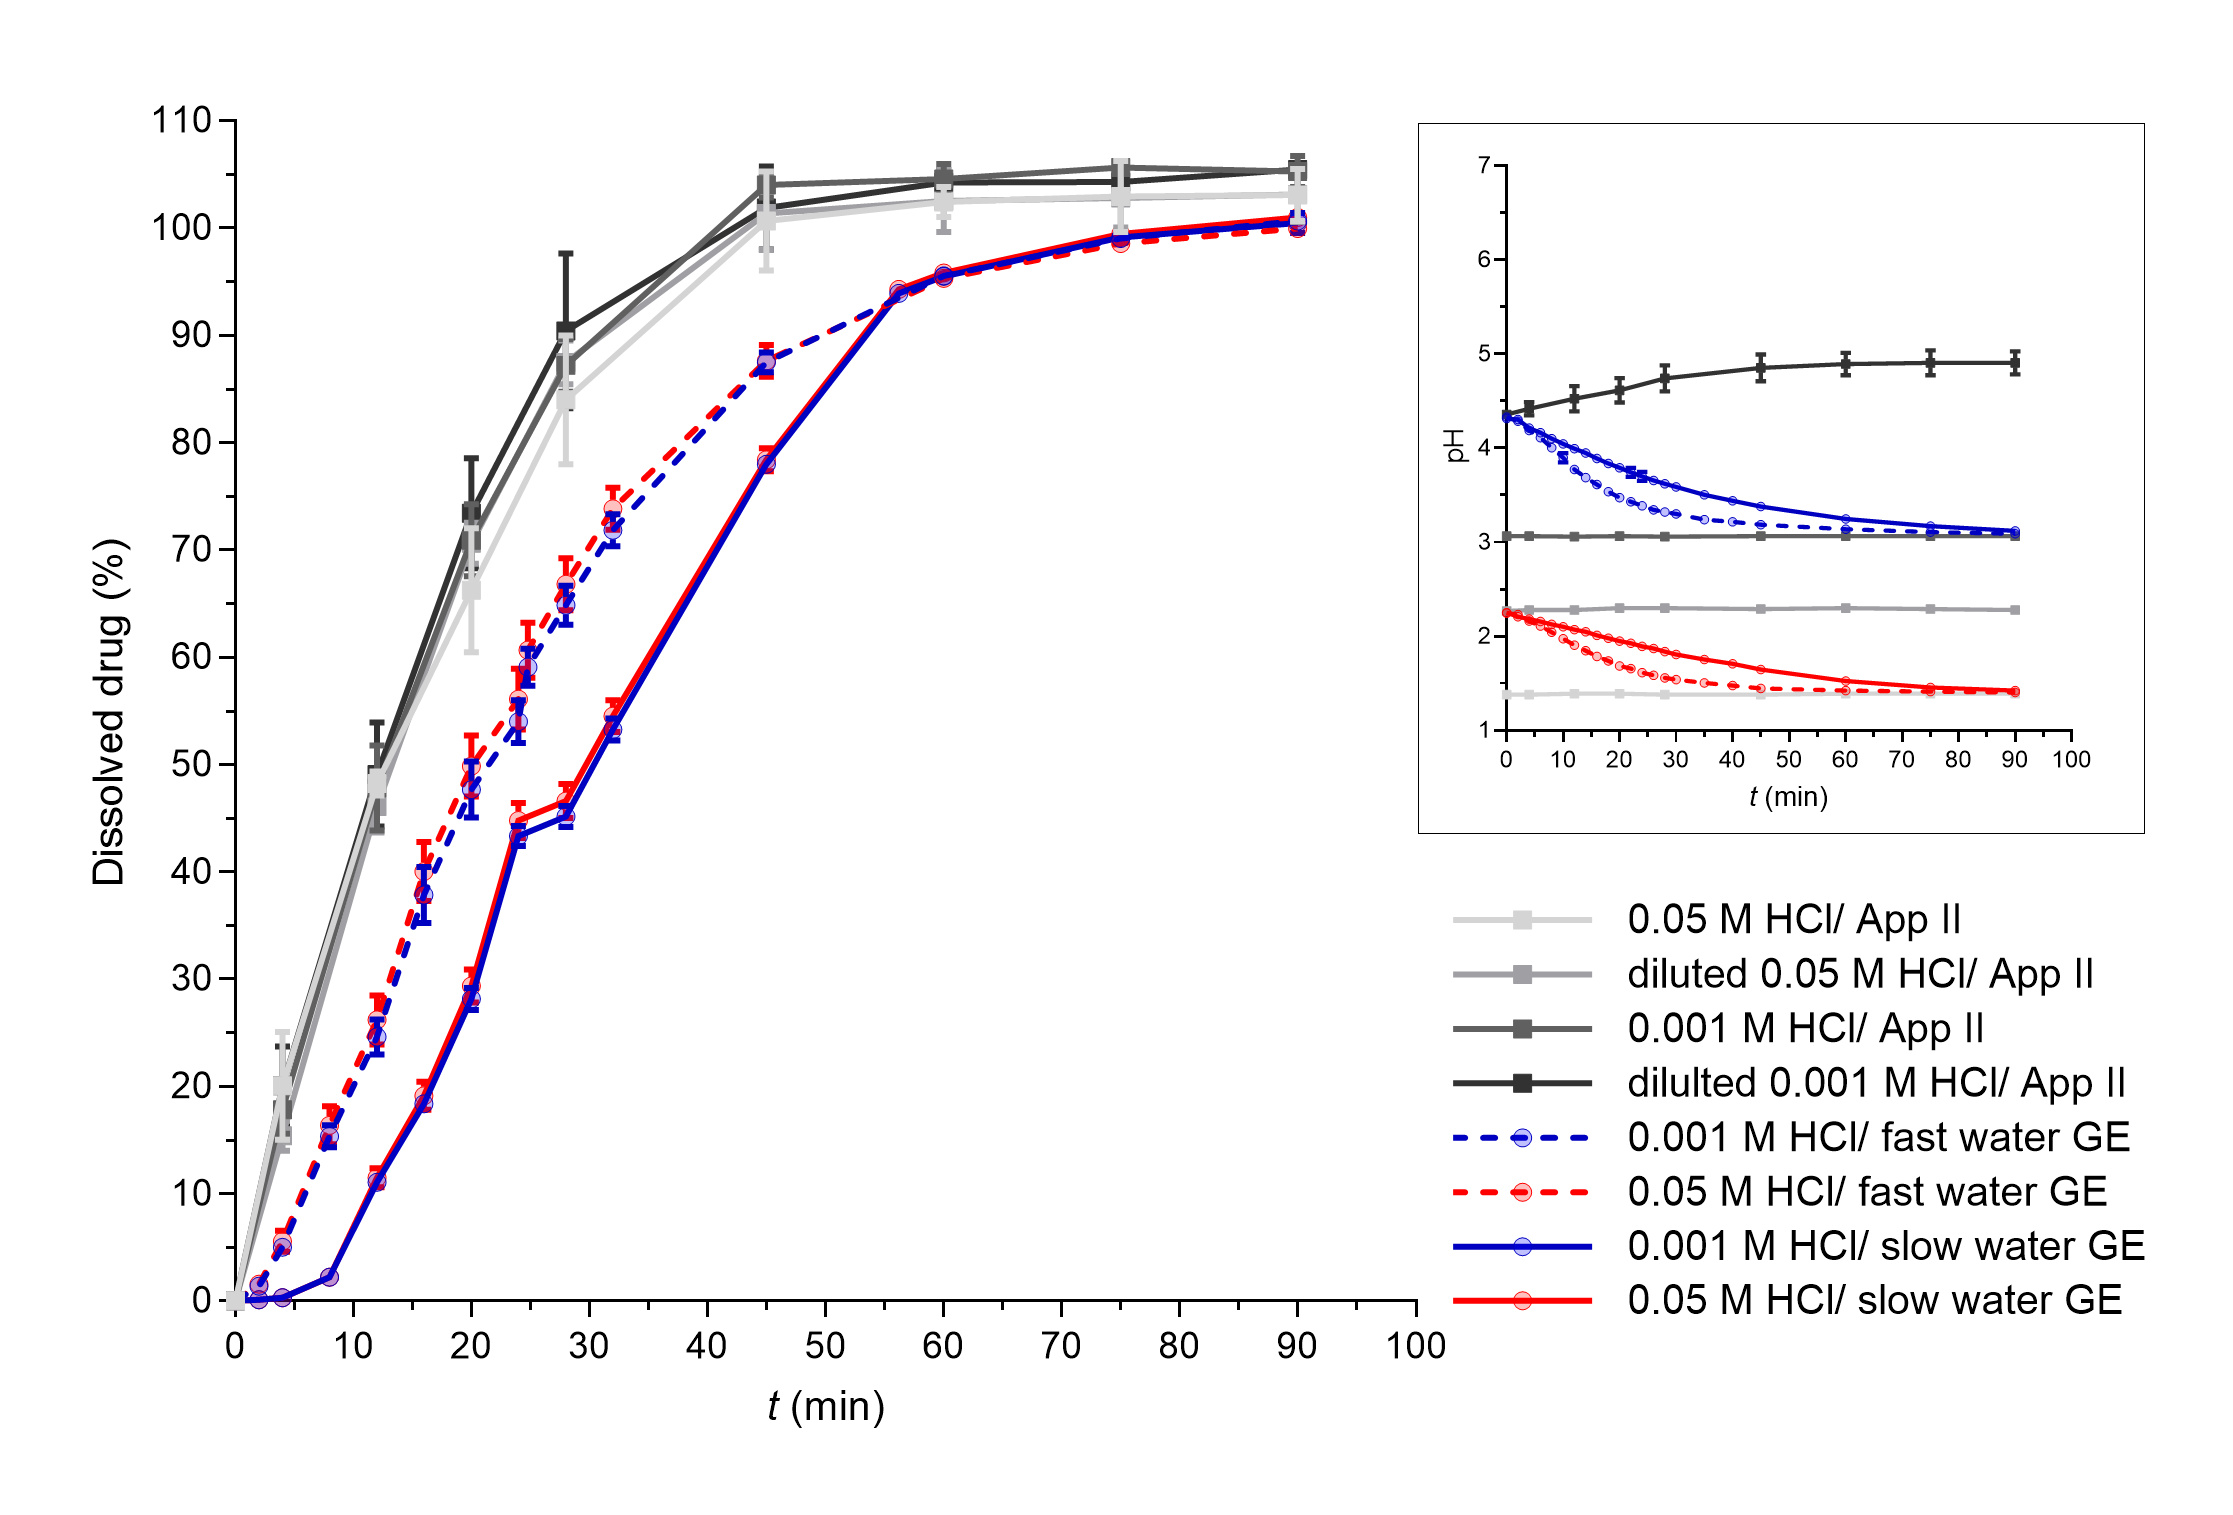
Fig. 3. PAR dissolved in apparatus II experiments (grey lines) and flow-through system experiments with different simulated GE patterns (coloured solid lines – slow GE, dashed coloured lines – fast GE). Average results of three replicates and standard deviations are presented. In the insert, pH profiles measured during PAR dissolution in both systems are shown (average values and standard deviations for three parallels, except for apparatus II experiments in 0.05 mol L–1 HCl and diluted 0.05 mol L–1 HCl where only one parallel was performed).
The influence of different water GE patterns can be also seen well from the dissolution profiles of DF-Na tablets when 0.001 mol L–1 HCl was used as the medium simulating basal gastric fluid (Fig. 4, blue curves). However, the differences cannot be confirmed when using 0.05 mol L–1 HCl as only a few % of the drug was dissolved in total.
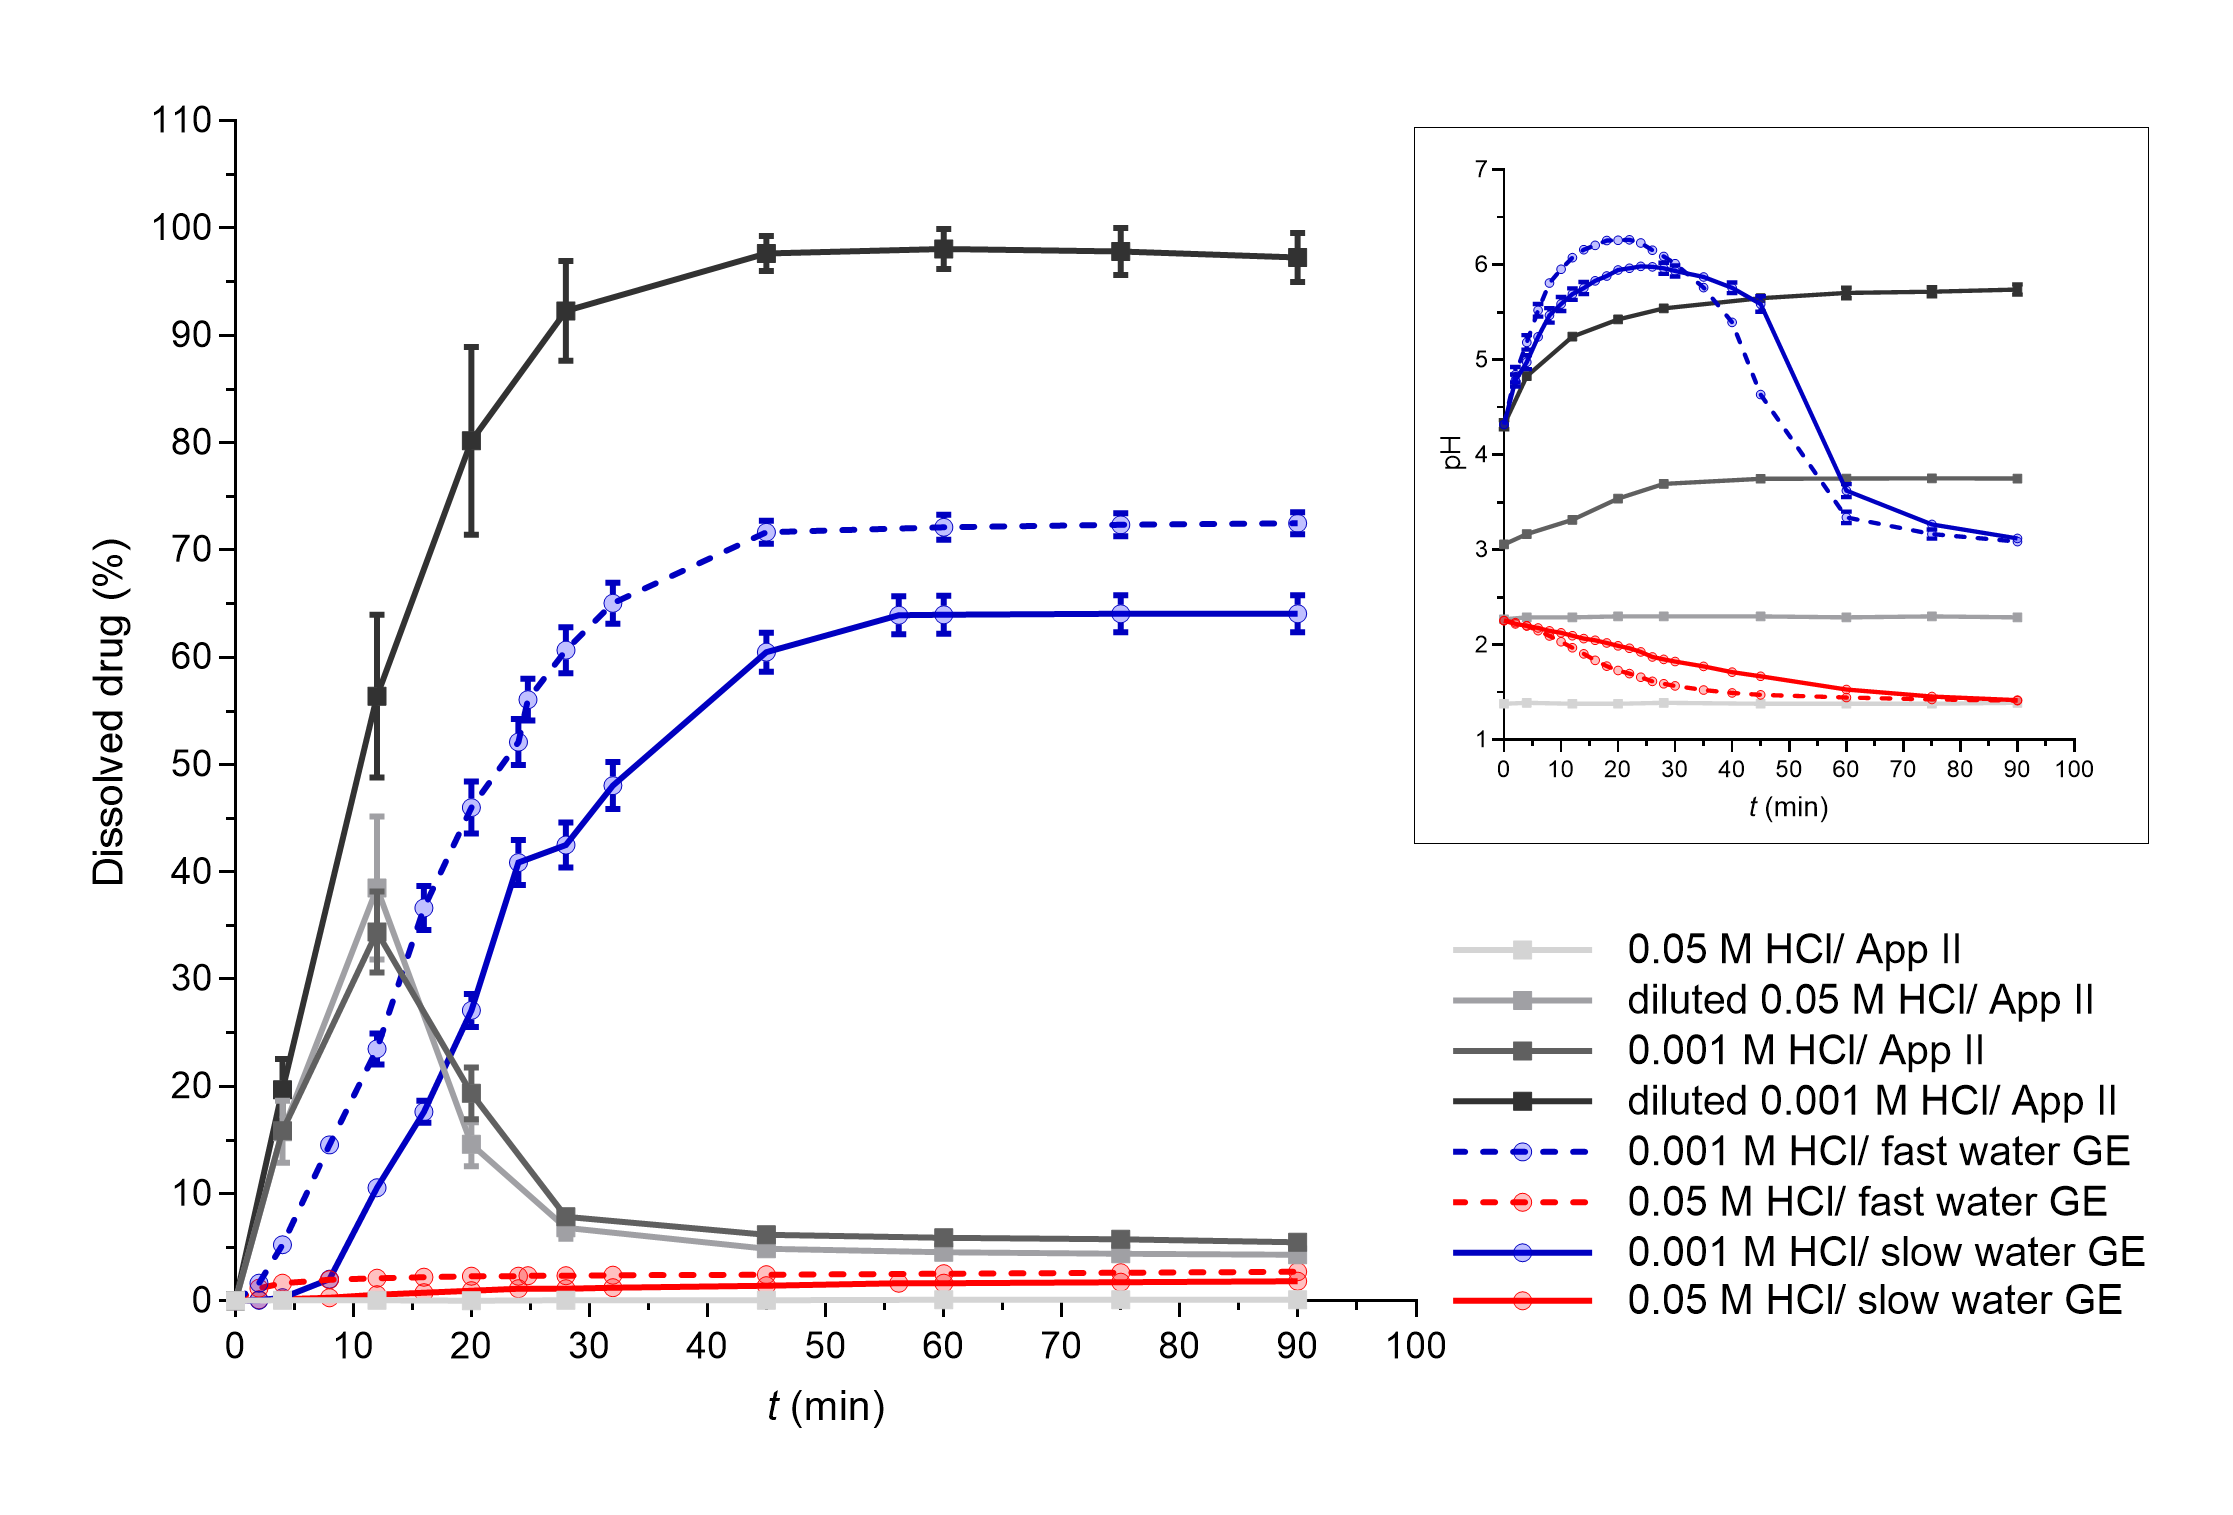
Fig. 4. DF-Na dissolved in apparatus II experiments (grey lines) and flow-through system experiments with different simulated GE patterns (coloured solid lines – slow GE, dashed coloured lines – fast GE). Average results of three replicates and standard deviations are presented. In the insert, pH profiles measured during DF-Na dissolution in both systems are presented (average values and standard deviations for three parallels, except for apparatus II experiments in 0.05 mol L–1 HCl and diluted 0.05 mol L–1 HCl where only one parallel was performed).
Diclofenac is a weakly acidic drug with a p Ka value of 3.8 and solubility that increases with increasing media pH value; namely, at pH 2 the solubility is approximately 2 mg L–1 and increases to over 20 mg L–1 at pH 5 (47). Additionally, the drug used in this study is in the form of a sodium salt, which exhibits significantly greater solubility in water (> 1000 mg L–1) than diclofenac itself (< 20 mg L–1) (47). However, the effect of medium pH value on the solubility of DF-Na is still observed, with very limited solubility in 0.1 mol L–1 HCl (around 1 mg L–1) which increases to approximately 670 mg L–1 in phosphate buffer pH 6.8 (48). Thus, the pH of the medium was also an important parameter for DF-Na dissolution. Similar results have been observed already in our previous study, where the differences in pH values throughout the whole GI tract influenced extensively the in vitro DF-Na dissolution (49). Solubility in media with different pH values, in this case represented by different HCl concentrations, influenced DF-Na dissolution also in this study, as can be seen in Fig. 4 from the results of both, the apparatus II system, as well as the flow-through model.
In the flow-through dissolution experiments, significant dissolution and its dependence on GE rate were observed only when GE patterns with 0.001 mol L–1 HCl were simulated. Under these conditions, the HCl solution is diluted with water at the beginning of the experiment, which produces a weakly acidic HCl solution (0.00013 mol L–1 HCl with a calculated pH value of approximately 3.9). A high pH increase (above pH 6) can be seen in the first 20 minutes of the experiment due to the dissolution of sodium salt of diclofenac. Afterwards, due to GE pattern simulation, the volume of the medium in the working vessel decreases and some of the drug is removed; thus, the effect of the continuous delivery of the fresh HCl solution prevails and the pH in therefore beaker then continuously decreases. When using 0.05 mol L–1 HCl as a dissolution medium, the initial pH, which is slightly higher than 2 due to the dilution with water, slowly decreases in accordance with GE pattern simulation and the delivery of fresh HCl to the vessel. Low pH values almost completely prevented the dissolution of DF-Na and the effect of GE rate was therefore also not evident.
In apparatus II dissolution experiments, the whole dose dissolved only when the lowest HCl concentration was used as dissolution medium – 0.00013 mol L–1 HCl. With the use of the highest HCl concentration, 0.05 mol L–1 HCl, less than 1 % of the drug dissolved. In addition to the differences in the pH value of the media itself, the dissolution results are in accordance with the measured pH values, which slowly increase during dissolution up to a pH higher than 5 in the first case, or remain constant at very low values (approx. 1.4) in the second case, respectively.
Such pH changes are also in accordance with literature data from in vivo studies. The application of 50 mg diclofenac potassium tablets with 240 mL of water increased gastric pH value, but pH mostly increased to values lower than diclofenac’s p Ka (3.8) (50). In another in vivo study, where diclofenac potassium tablets were dissolved in water before administration, an increase in gastric pH even up to pH 7 was observed (51).
Furthermore, in apparatus II experiments with 0.001 mol L–1 HCl and diluted 0.05 mol L–1 HCl ( i.e. 0.0064 mol L–1 HCl), supersaturation was observed at early time points, probably due to the fast initial dissolution of the sodium salt of diclofenac. A fast precipitation then followed due to low pH values and the final amount of the dissolved drug was approximately 5 % of the dose. In an in vivo study (51), diclofenac supersaturation was also observed in the stomach where it precipitated fast under acidic conditions and then rapidly re-dissolved in the duodenum at higher pH values. The observed dissolution profiles in the apparatus II model could thus reflect the in vivo behaviour of DF-Na tablets in the stomach but the absorption would be additionally influenced by the gastric emptying of dissolved and undissolved/precipitated drug, dissolution of particles and other processes in the small intestine, which could not be assessed using a single medium experiment within the apparatus II method.
In the in vitro flow-through model, supersaturation might still occur but could not be directly observed from the obtained results as a cumulative percentage of dissolved drug pumped out of the working vessel is determined in these experiments. However, the total amount of transferred drug from the working vessel which includes dissolved drug and transferred particles, smaller than 500 µm, was also determined in our experiments. The results of the amount of total transferred drug are presented in Fig. 5. Regardless of the HCl concentration used, the total amount of transferred diclofenac was similar to the amount of transferred PAR, which was equal to the amount of dissolved PAR. Additionally, the disintegration of DF-Na tablets was also similar to the disintegration of PAR tablets. At the end of the experiment (90 minutes), almost the whole DF-Na dose was transferred out of the working vessel, regardless of the HCl concentration used. The amount of transferred drug followed only the changes in the simulated GE pattern (thus, the changes in flow rate used to pump the medium out of the working vessel) and was not limited by the pH value of the medium or the amount of dissolved DF-Na.
In an in vivo environment, the drug that dissolves in the stomach passes the pylorus simultaneously with the water in which it is dissolved. Undissolved or precipitated particles, especially larger ones, can pass the pylorus, in phase III of the MMC cycle (52). The explanation of the analysis of in vivo results from researchers (53) also suggested that a small part of the dissolved drug or very small undissolved particles may also pass the pylorus together with the ingested water and the transfer of the undissolved drug can partly occur in phase II as well. Regardless of the mechanism, the diclofenac particles will dissolve in the duodenum at higher pH values and contribute to its absorption. The measured total amount of transferred drug in the in vitro flow-through experiments could thus additionally improve the predictability of in vivo DF-Na behaviour compared to the results of the dissolved drug alone and also static dissolution studies in apparatus II. Furthermore, as can be seen from Fig. 5, the GE rate influenced also the total amount of transferred drug (dissolved and undissolved).
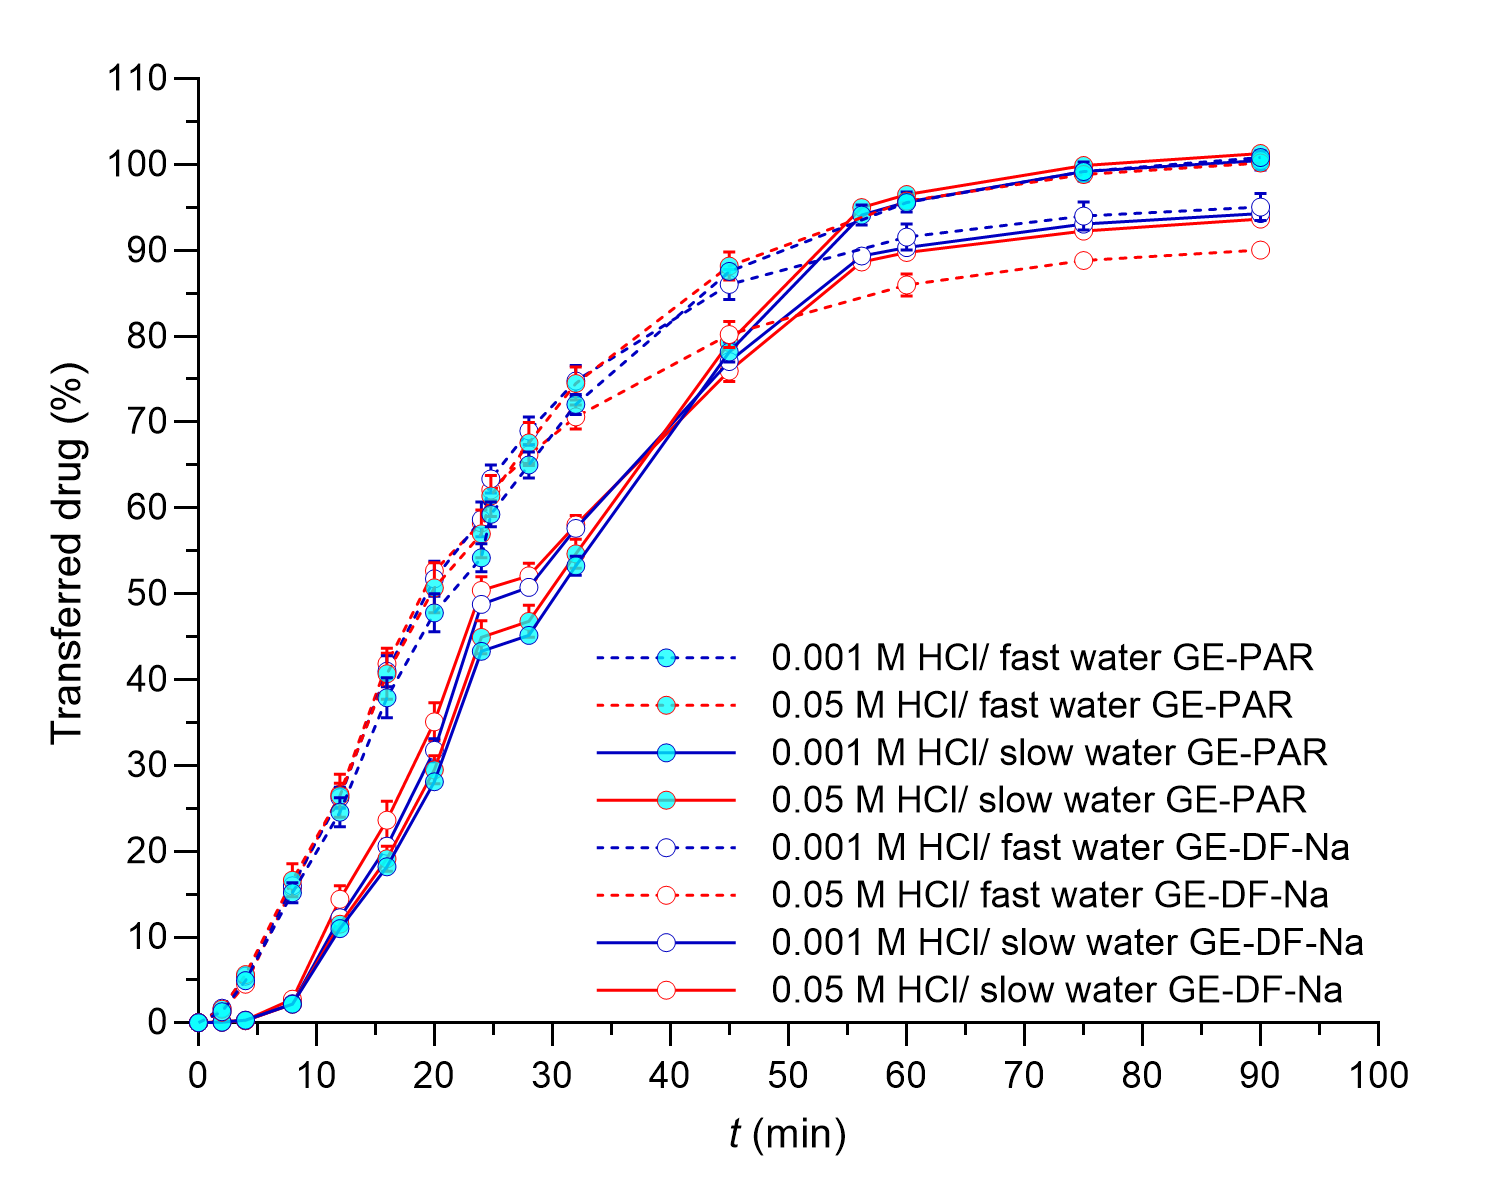
Fig. 5. The total amount of DF-Na or PAR transferred from the working vessel in the flow-through system experiments with different simulated GE patterns (solid lines – slow GE, dashed lines – fast GE). Average results of three replicates and standard deviations are presented.
The influence of simulated water GE patterns was also assessed using DPL tablets. DPL is a weakly basic drug with a p Ka value of around 6.2 and low solubility in water. In aqueous media, solubility significantly decreases with increasing pH value of the medium, from 13000 mg L–1 in 0.1 mol L–1 HCl to approximately 5 mg L–1 in phosphate buffer pH 6.8 (22, 45, 54).
The dissolution results from DPL experiments are presented in Fig. 6. The influence of different GE rates can be seen well from dissolution profiles obtained using 0.05 mol L–1 HCl as a gastric medium where the solubility of DPL wasn’t a limitation. Faster GE resulted in a faster decrease of pH and faster DPL release. When using 0.001 mol L–1 HCl as a gastric medium, the dissolution was much slower and the effect of GE on dissolution was vague. As observed in some DF-Na experiments, the concentration of dissolved drugs in the samples can be influenced by other parameters. Namely, pH-dependent disintegration of DPL tablets was observed, producing smaller particles that can remain in an un-dissolved state at higher pH values, and additional precipitation of already dissolved DPL could also occur. The appearance of such particles also resulted in technical problems during experimental work which additionally contributed to the variability and irregular shape of dissolution profiles and incomplete DPL release.
In the apparatus II system, the pH value of the simulated gastric medium and pH-dependent solubility of DPL significantly influenced the rate and extent of DPL dissolution. In a diluted 0.001 mol L–1 HCl ( i.e. medium with the lowest HCl concentration and hence the highest pH value), only approximately 10 % of the drug was dissolved. In other media, the whole dose dissolved and the HCl concentration influenced the rate of dissolution; namely, the dissolution rate increased as the HCl concentration increased. pH value of the media during dissolution didn’t change significantly, except in experiments in diluted 0.001 mol L–1 HCl ( i.e. 0.00013 mol L–1 HCl), where the pH increased continuously throughout the experiment. The increasing pH value in the dissolution vessel, which can be ascribed to the dissolution of DPL, could additionally hinder its further dissolution. The importance of gastric pH value for DPL absorption was shown also in an in vivo study, where DPL pharmacokinetic parameters were compared between healthy and achlorhydric elderly subjects. A higher gastric pH in achlorhydric volunteers significantly decreased cmax and delayed tmax, but the decrease in AUC was not statistically significant (22).
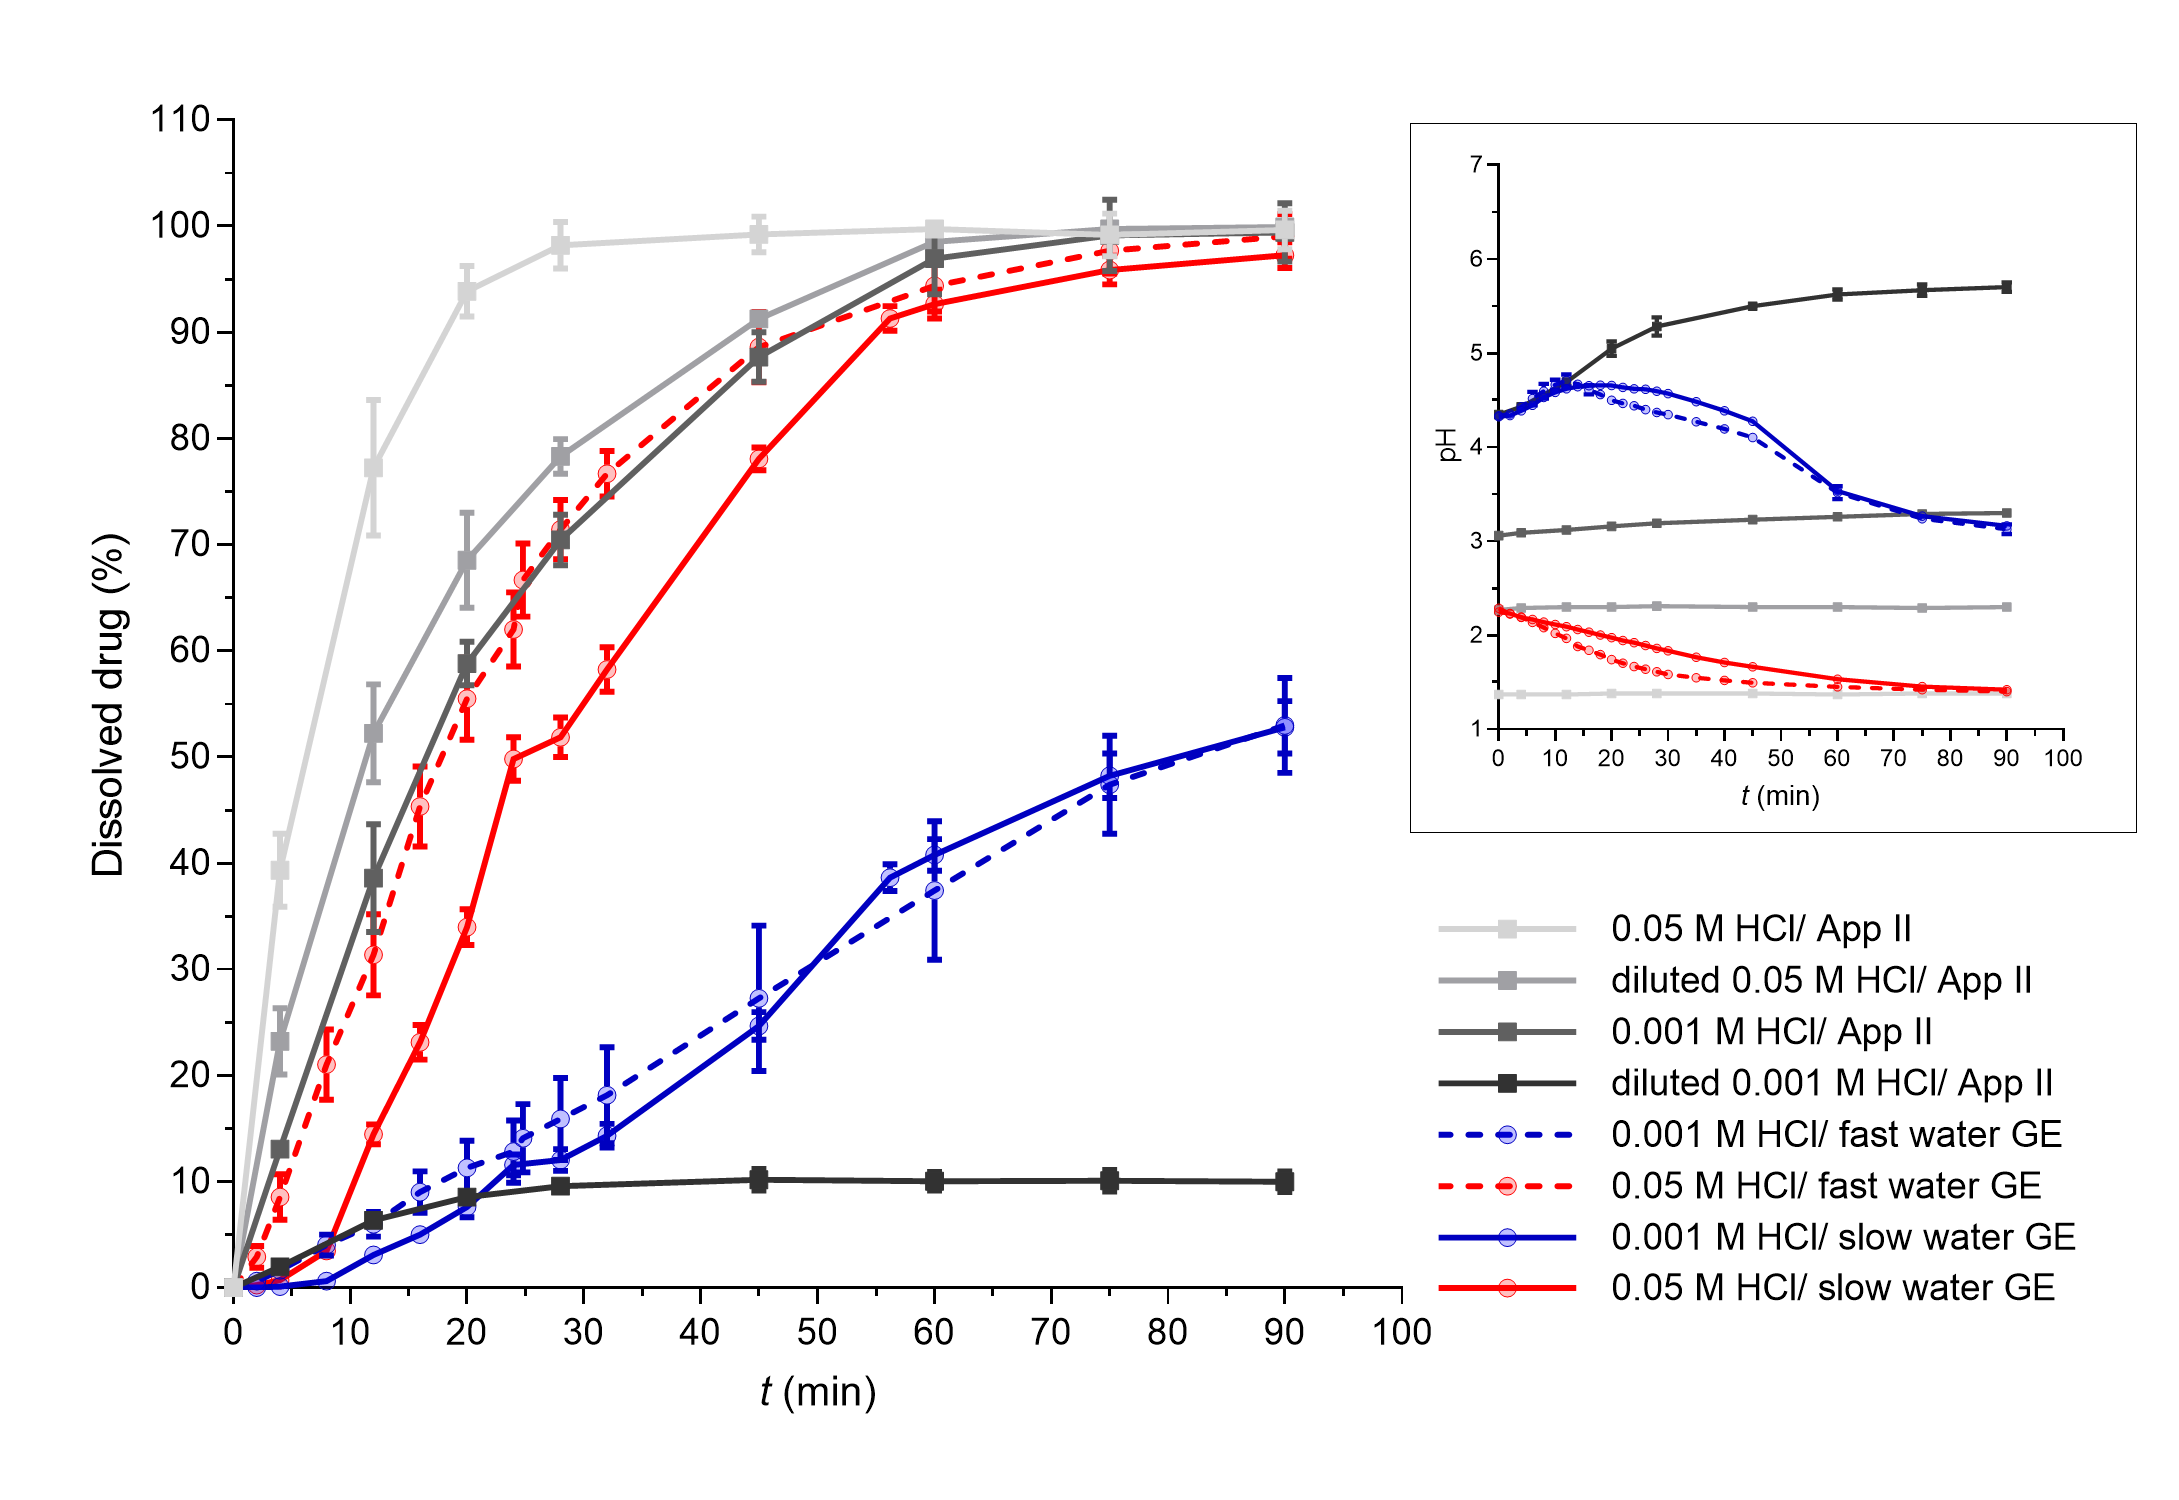
Fig. 6. DPL dissolved in apparatus II experiments (grey lines) and flow-through system experiments with different simulated GE patterns (coloured solid lines – slow GE, dashed coloured lines – fast GE). Average results of three replicates and standard deviations are presented. In the insert, pH profiles measured during DPL dissolution in both systems are presented (average values and standard deviations for three parallels, except for Apparatus II experiments in 0.05 mol L–1 HCl and diluted 0.05 mol L–1 HCl where only one parallel was performed).
CONCLUSIONS
For immediate-release tablets, all processes important for drug dissolution occur in a short time interval after administration which mostly coincides with the time interval of water GE. Therefore, despite the GE of water is rarely considered in the in vitro dissolution testing, its effect on drug dissolution from immediate release tablets in models considering both, drug release from the dosage form and GE, can be expected. In the scope of this work, GE patterns were successfully simulated in a flow-through dissolution model and the influence of different water GE rates on drug release from immediate-release tablets was confirmed. In addition to water GE kinetics, other parameters were also recognized to influence drug dissolution as can be seen from the comparison of three different model drugs with different pH (in)dependent solubilities. The limited solubility in dissolution media was observed to influence drug dissolution considerably and thus partly or completely hinder the effect of the water GE rate. The effect of GE on in vivo drug release from immediate release dosage forms and its appearance in the upper small intestine can be thus expected to be expressed in the cases when there are no other prevailing parameters.
Acknowledgements. – We would like to thank Prof. Luca Marciani (Nottingham Digestive Diseases Centre, School of Medicine, University of Nottingham, United Kingdom) for providing the numerical data on in vivo gastric volumes after ingestion of water. Also, we would like to thank Greta Cof (Faculty of Pharmacy, University of Ljubljana, Slovenia) for her technical help in experiment implementation.
Funding. – This study was financially supported by the Slovenian Research Agency (research core funding No. P1-0189).
Conflict of interest. – The authors declare no conflict of interest.
Authors contributions. – Conceptualization, T.F., M.B.; methodology, T.F.; investigation, T.F., writing, original draft preparation T.F.; writing, review and editing M.B.; visualization T.F., supervision M.B.; funding acquisition M.B.