
INTRODUCTION - Uvod
Today, there are eight known species belonging to the Ursidae family throughout the world: Ailuropoda melanoleuca, Helarctos malayanus, Melursus ursinus, Tremarctos ornatus, Ursus thibetanus, Ursus maritimus, Ursus americanus and Ursus arctos (Servheen et al., 1998). The brown bear is the most endangered species between them (Süel, 2019). Compared to other bear species distributed in the world, the brown bear has the widest distribution (Cihan, 2007). Although it is generally distributed extensively in Asia and North America, it is also distributed throughout Europe (Pasitschniak-Arts, 1993; McLellan et al., 2017). Therefore, the food preference of the brown bear varies both temporally and spatially depending on the location (Clevenger et al., 1992; Munro et al., 2006).
The brown bear, being a large carnivore in nature (Bojarska and Selva, 2012), constantly interacts with humans to meet its nutritional needs. Also, humans have always preferred eating brown bear meat or using its fat as an ointment in hunting activities (Loon and Georgette, 1989). In Europe, the brown bear is fully protected in 12 different countries and is considered a hunting species in 6 countries (Swenson et al., 2000; Zedrosser et al., 2001). Such anthropogenic hazards narrowed the brown bear existing habitats and negatively affected population continuity. In addition, changing climatic conditions are likely to affect the brown bear’s nutrition directly or indirectly, as well as its shelter, habitat preference and torpor process (Ashrafzadeh et al., 2023). It has been stated that according to some climate scenarios, the brown bear will also be affected by global warming (Dar et al., 2021). Therefore, to effectively protect the brown bear under climate change, conservation efforts aimed at identifying and improving climatically suitable habitats should be prioritized (Hannah et al., 2007).
Global climate models help to perform statistical analyses depending on climate. Although evaluating these models and obtaining the results is a complex process, it is an effective way to take protective and management measures (Hartmann, 2015; Pottier et al., 2017). Different climate models are available to predict suitable habitats for the future. One of such climate models is CHELSA climate model, an up-to-date data repository in terms of land surface areas (Karger et al., 2017). The problem of other climate models is low resolution, while Chelsa climate models stand out with their very high resolution (Brun et al., 2022). It has also been stated that species distribution modelling predictions with high-resolution Chelsa climate scenarios are more reliable and accurate (Morales‐Barbero and Vega‐Alvarez, 2019). The preference of Chelsa climate variables for modelling and predicting current and future brown bear distribution in Europe at a fine scale (habitat suitability) support this choice.
Species distribution modelling methods (SDMs) are divided into two groups of methods: mechanistic and correlative. Mechanistic methods require ecophysiological characteristics of the target species, which are difficult to obtain. There is no need for such information in correlative methods, which are divided into two groups: separation (working with present-absent data) and profile (working only with present data) techniques (Engler et al., 2004; Özkan, 2012). Obtaining new and reliable absence data in wildlife studies requires a long time and high costs. Therefore, presence data of the target species are more important in wildlife modelling and mapping studies. In this context, Maximum Entropy ( MaxEnt) software that provides accurate and reliable data with the least amount of data proved as a useful tool (Phillips et al., 2006; Elith et al., 2011).
MaxEnt is a software that determines the features needed by the target species using the presence data, while estimating the suitability level for the entire area according to the numerical values of environmental variables in the area (Phillips et al., 2004). Additionally, MaxEnt provides the opportunity to work with both categorical and continuous data. Therefore, by determining vegetation and environmental impact, it reveals the impact of factors such as human interaction with wildlife and climate envelope models on target species (Kıraç, 2021; Kıraç et al., 2022).
This study aimed to determine the potential habitat suitability of the brown bear, which has a lower population density in Europe compared to North America and Asia, under the effect of climate change. For this purpose, maximum entropy method was used for potential habitat suitability mapping of the brown bear according to different Chelsa climate scenarios (IPSL-CM6A-LR SSP126-SSP370-SSP585) for the future (2100) and the current (2010) year.
MATERIALS AND METHODS – Materijali i metode
Study area - Područje istraživanja
Brown bears, which are described as large carnivores, are moving creatures (Morales-González et al., 2020). The brown bear is widely distributed across geographical areas from North America to Eurasia (Matsuhashi et al., 2001). However, while brown bear distribution has become endangered in some areas of Europe, it has an extant distribution in other regions. The fact that the habitats of the brown bear are limited to certain areas prevents population growth and causes population loss rates to increase (Zedrosser et al., 2001). In addition, changing climate conditions may cause the existing habitats of the brown bear to shrink, fragment or disappear (Su et al., 2018). In this context, the study area was established in Europe (Fig. 1), where brown bear distribution is thought to be more affected by changing climatic conditions than it is in other continents or regions in the world (Sommer and Benecke, 2005).
Brown bear data collection - Prikupljanje podataka o smeđem medvjedu
To fill the gap of climate change impact on brown bear distributed in Europe and to improve the existing knowledge, data were obtained from the Global Biodiversity Information Facility (GBIF) data infrastructure to acquire presence data on the target species. Brown bear presence data downloaded from the GBIF database, which is funded by world governments and provides open access to species living on Earth, was resized to a global scale according to the study area boundary (GBIF, 2024). Data related to the spatial distribution of the 9,857 registered brown bear individuals within the borders of the study area are shown in yellow (Fig. 1).
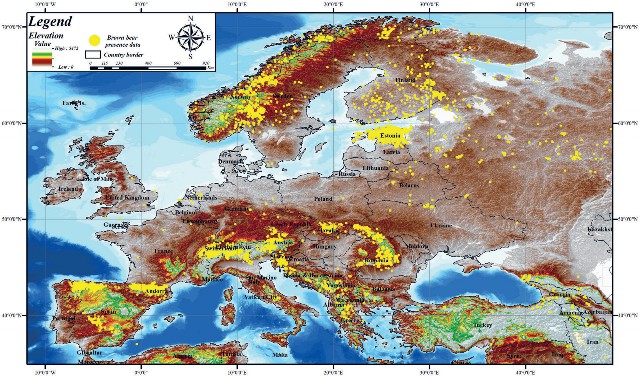
Figure 1. Europe regions and brown bear presence data
Slika 1. Prisutnost smeđeg medvjeda u europskim regijama
Chelsa bioclimatic variables - Klimatske varijable Chelsa
The current Chelsa climate data (Bio1 to Bio19, for period 1981-2010) were downloaded from version 2.1 (30 arc seconds or ~1 km) of the Chelsa climate website (https://chelsa-climate.org/, Karger et al. 2017). Chelsa climate variable definitions are given in Table 1. Version 2.1 of the high-resolution Chelsa climate model included IPSL-CM6A-LR (30 arc seconds or ~1 km) based data for 19 bioclimatic variables and climate projections for the future (year 2100) (Karger et al., 2020). These data sets, which are accessible on a global scale, were optimized according to the size of the European study area and converted to Ascii format with the help of ArcMap 10.8.
Table 1. Chelsa climate variables
Tablica 1. Klimatske varijable Chelsa
***The data presented in the CHELSA database include values transformed using scale and offset values. This transformation is done by multiplying the value with the scale value and adding it to the offset value. For example, the value 8000 for Bio4 corresponds to (8000 / 100) x 0.1 +(0) = 8°C.
Brown bear habitat suitability modelling and mapping (maximum entropy) - Modeliranje i mapiranje prikladnosti staništa smeđeg medvjeda (maksimalna entropija)
Maximum entropy ( MaxEnt) is a probability calculation method that estimates suitable and unsuitable areas of the dependent variable by using only presence data in wildlife studies (Phillips et al., 2006; Baldwin, 2009). To perform prediction analysis and reveal suitable habitats for the target species, MaxEnt calculates two different probability densities. The first of these characterizes the areas where presence data of the target species are available. Secondly, the probability density calculates habitat suitability for background points. Then, MaxEnt calculates the difference between these two probability densities and gives the relative environmental suitability for each presence data (Dudík et al., 2007). By characterizing the suitable habitats for each presence data obtained throughout the entire area, it produces a habitat suitability mapping output for the entire area (Elith et al., 2011).
MaxEnt has the advantages of being one of the methods that gives results with the highest explanation margin and is able to produce model results with high data validity at least (Hernandez et al., 2006). By working with both categorical and continuous data, MaxEnt reveals the effects of factors such as environmental variables, vegetation differences and human impact on wildlife (Phillips et al., 2004; Wisz et al., 2008). In addition, MaxEnt is frequently preferred in wildlife conservation, development, and planning studies because it allows simulating the effects of changing climate conditions on wild animal species. Therefore, MaxEnt 3.4.4 software was used to estimate the climate conditions that limit the brown bear current habitat and compare the current habitat with future Chelsa climate scenarios (Phillips, 2008).
As with every habitat suitability model, the accuracy of the model outputs obtained with the MaxEnt method must be checked. For the MaxEnt method, the contribution and value results of the Receiver Operating Characteristic (ROC) and Jackknife graphs need to be examined. There are two different methods for examining ROC values (Baldwin, 2009). The first is that the training value of the repetitions of the obtained model is the highest. The other is that the difference between the training and test data values between iterations is the lowest and the test data value is not higher than the training data set value. Classification is based on training and test data set values: 0.9<ROC is categorized as “very good”, 0.7<ROC<0.89 is categorized as “good”, and ROC<0.69 is categorized as “uninformative” (Baldwin, 2009). In the Jackknife chart, it should be ensured that the individual contribution of the particular variables contributing to the model does not exceed the contribution to the entire model.
RESULTS - Rezultati
Most significant representative Chelsa climate variables on brown bear distribution - Najznačajnije reprezentativne klimatske varijable Chelsa o distribuciji smeđeg medvjeda
Statistical analyses were carried out before starting the current and future habitat suitability modelling studies of the brown bear distributed in Europe. Pearson’s correlation analysis was applied to 19 variables to see whether there was a high correlation between Chelsa climate variables. Elimination was made among Chelsa climate variables with high Pearson’s correlation value (0.8<r). According to the correlation analysis and elimination method results, 7 variables were found to have high correlations on the brown bear distribution. According to the correlation analysis and elimination method results, 7 variables (Bio3, Bio5, Bio8, Bio9, Bio10, Bio16, Bio17) were found to have high correlations on the brown bear distribution and were not included in the modelling. “GCS_WGS_84” coordinate system was assigned to 12 different Chelsa climate variables independent of each other on the brown bear distribution. They were converted to Ascii format and the modelling phase was started.
Brown bear current habitat suitability modelling and mapping - Modeliranje i mapiranje prikladnosti trenutnog staništa smeđeg medvjeda
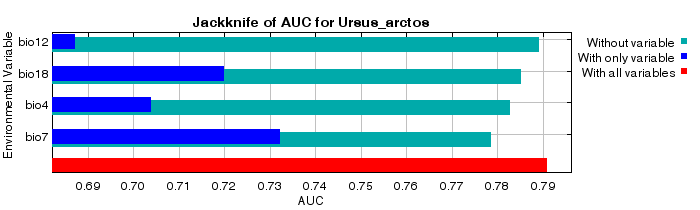
The current habitat suitability mapping of the brown bear distributed in the large-scale study area has started the modelling phase with 12 different climatic variables and 9,857 presence data. The cross-validation method was preferred by separating 90% of the training data and 10% of the test data in the modelling process. In this regard, a total of 9,857 presence data obtained for the target species were processed and 500 iterations were applied. The modelling process was repeated until at least two different climate variables remained among the representative variables. According to these classifications, 38 different habitat suitability models have been put forward for current habitat suitability mapping of the brown bear. When the obtained models were evaluated according to the accuracy criteria, the training data ROC value was 0.834 and the test data ROC value was 0.828, which was the good model. The standard deviation of the model was 0.008. The model was classified in the “good model” category according to the Baldwin (2009) classification. Variables contributing to the model are annual range of temperature (Bio7), mean monthly precipitation amount of the warmest quarter (Bio18), temperature seasonality (Bio4) and annual precipitation amount (Bio12), according to the Jackknife AUC chart (Fig. 2A). The percentage contribution and permutation importance of the variables forming the model for the Jackknife AUC chart were determined (Fig. 2B).
| Variable | Percent contribution | Permutation importance |
|---|---|---|
| Bio7 | 48.20 | 40.20 |
| Bio18 | 22.10 | 18.20 |
| Bio12 | 18.20 | 18.80 |
| Bio4 | 11.50 | 22.20 |
Figure 2. Chelsa climate variables that contribute to the formation of the model A) Jackknife AUC chart B) Percentage contribution and permutation importance for the Jackknife chart
Slika 2. Klimatske varijable Chelsa koje pridonose formiranju modela A) Jackknife AUC grafikon B) Postotni doprinos i važnost permutacije za Jackknife grafikon
Marginal responder curve graphs of the variables contributing to the model need to be examined. When the annual temperature range graph is examined, which contributes the most to the model, the probability of the brown bear’s presence is high in areas where the annual average temperature range within the area is up to 29.6°C (Fig. 3A). The probability of the brown bear’s presence in areas where the annual temperature range exceeds this value has a low relationship. The probability of the brown bear’s presence is high in areas where the mean monthly precipitation amount of the warmest quarter is 0-400 mm (Fig. 3B), and the annual precipitation amount is 1200 mm (Fig. 3C). It has been determined that the probability of the brown bear’s presence is lower in areas with higher precipitation related to Chelsa climate variable values. The changing seasonal temperature value results that contribute the least to the model were calculated according to the Chelsa formula. It was determined that the brown bear has a high probability of being present in areas where the seasonal temperature is around 8°C, while in areas below this value there is a low probability of its presence (Fig. 3D).
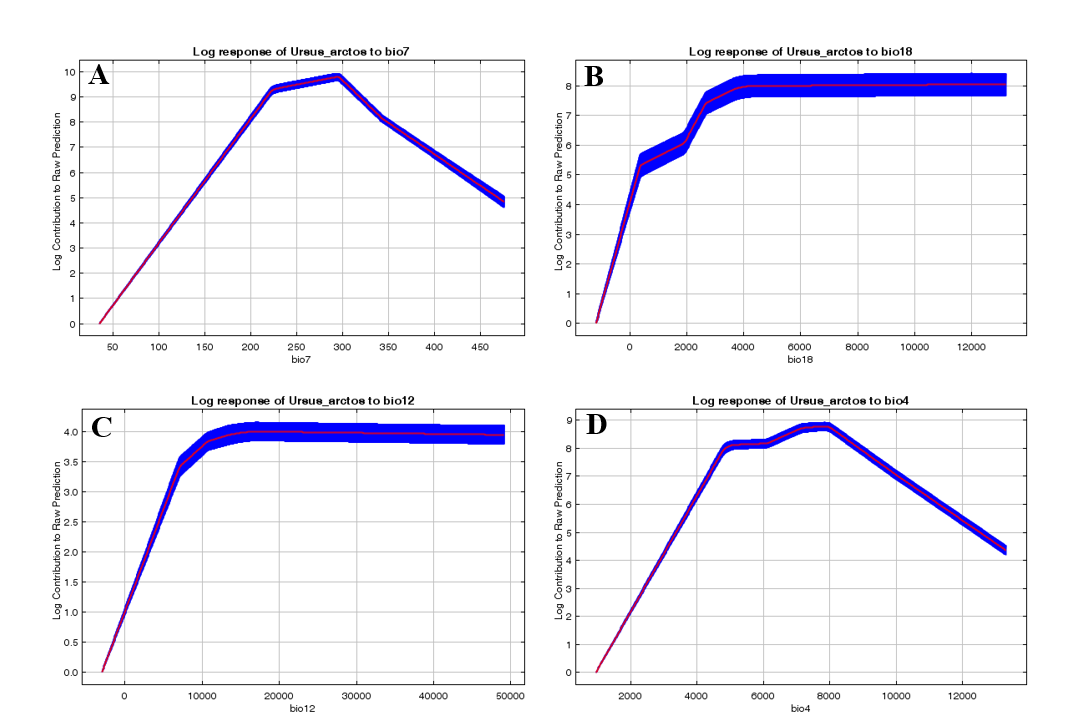
Figure 3. Contributing to the brown bear current habitat suitability modelling A) Annual range of temperature graph, B) Mean monthly precipitation amount of the warmest quarter graph, C) Temperature seasonality graph, D) Annual precipitation amount graph
Slika 3. Doprinos modeliranju prikladnosti trenutnog staništa smeđeg medvjeda A) Grafikon godišnjeg raspona temperature, B) Grafikon srednje mjesečne količine padalina najtoplijeg tromjesečja, C) Grafikon sezonalnosti temperature, D) Grafikon godišnje količine padalina
According to the results of the variable values which contribute to the model, the current habitat suitability map of the brown bear was created. When this habitat suitability mapping is examined, brown bear shows high habitat suitability in almost all geographical regions of countries such as Austria, Slovenia, Croatia, Bosnia and Herzegovina, Norway, Sweden, Estonia, Latvia, and Georgia. In addition to these countries, high habitat suitability for the brown bear has been determined in regions such as the Black Sea and Mediterranean regions of Turkey, the northern region of Spain, the west of Portugal, the south of France, the south of Germany, the south of Finland, and the north of Italy. In addition, high habitat suitability for the brown bear has been determined in the corridor region between the borders of Romania, Ukraine, Slovakia, and Poland (Fig. 4).
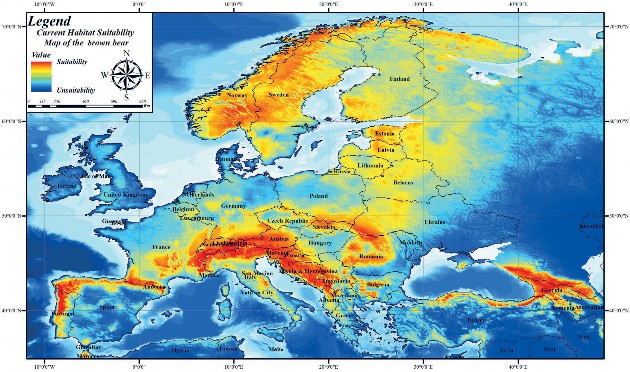
Figure 4. Current habitat suitability mapping of the brown bear in Europe
Slika 4. Trenutno mapiranje prikladnosti staništa smeđeg medvjeda u Europi
Brown bear future habitat suitability mapping - Mapiranje prikladnosti budućeg staništa smeđeg medvjeda
A simulated analysis was performed with different Chelsa climate scenarios (SSP126-SSP370-SSP585) for the year 2100 based on variables contributing to the brown bear current habitat suitability model. Model results simulated for the year 2100 SSP126 Chelsa scenario revealed that, unlike current habitat suitability modelling, there is a general shrinkage in brown bear habitats (Fig. 5). According to the Chelsa climate envelope model 2100 SSP370 scenario, it was revealed that there is fragmentation as well as shrinkage in brown bear habitats (Fig. 6). In the 2100 SSP585 scenario, in addition to fragmentation as in the SSP 370 scenario, it was determined that habitats in some areas with high correlation in current habitat suitability modelling are facing extinction (Fig. 7). For example, while the habitat suitability of the brown bear is high in the current habitat suitability model in the Mediterranean region of Turkey, according to the SSP585 scenario for the year 2100, its habitats will be facing extinction. As a result, it was found that the Chelsa climate scenarios for the year 2100 have an impact on the brown bear habitats in Europe. Although this climate change is less effective in areas with high population size, it will cause the extinction of brown bear in areas with low population size.

Figure 5. Habitat suitability mapping of the brown bear in Europe according to 2100 Chelsa climate ( Future model 1: SSP126)
Slika 5. Mapiranje prikladnosti staništa smeđeg medvjeda u Europi prema modelu Chelsa 2100. (Budući model 1: SSP126)
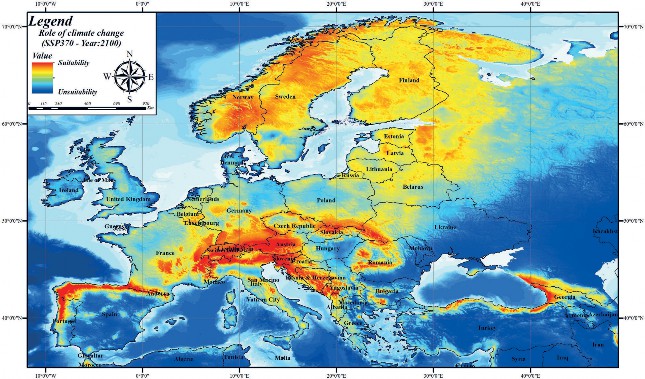
Figure 6. Habitat suitability mapping of the brown bear in Europe according to 2100 Chelsa climate ( Future model 2: SSP370)
Slika 6. Mapiranje prikladnosti staništa smeđeg medvjeda u Europi prema modelu Chelsa 2100. (Budući model 2: SSP370)
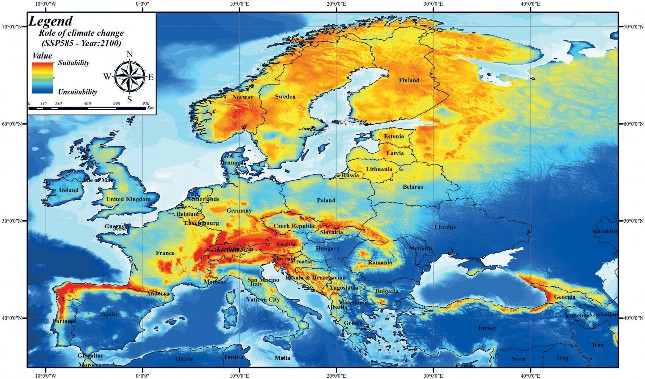
Figure 7. Habitat suitability mapping of the brown bear in Europe according to 2100 Chelsa climate ( Future model 3: SSP585)
Slika 7. Mapiranje prikladnosti staništa smeđeg medvjeda u Europi prema modelu Chelsa 2100. (Budući model 3: SSP585)
DISCUSSION – Rasprava
Numerical and model-based mappings are at the forefront compared to other classical methods to evaluate wild animal habitat preference (Özkan, 2012). These maps can help to predict the future geographic distribution of wild animal species, understand their ecological requirements and biological responses to climate change, and guide conservation plans (Mert et al., 2013). Nowadays, studies based on global climate envelope models have started to reveal the effects of changing climate conditions on wild animal species that are endangered or need to be protected (Kıraç and Mert, 2019; Dilbe et al., 2022). In this study, MaxEnt software was used to map the habitat status of the endangered brown bear in Europe according to different scenarios (SSP126-SSP370-SSP585) for current (2010) and future (2100) years. Some studies reveal the preferred habitat of the brown bear using MaxEnt software. However, these studies were small-scale and the climate change factor, which is effective in habitat preference, was ignored (Almasieh et al., 2019; Süel, 2019).
In small-scale habitat suitability modelling and mapping studies for the brown bear, anthropogenic effects such as bear management plans, vegetation status, food preference, road density, distance to water, distance to settlements, and land cover use are important in habitat preference (Morales-González et al., 2020). In other words, the brown bear prefers areas where space, food, cover, and water, which are among the wildlife habitat factors, come together (Ertuğrul et al., 2017). However, there are no numerical and model-based maps and information on how these anthropogenic effects will change in the future. Therefore, a larger-scale existing habitat suitability model and map was prepared to determine the impact of Chelsa climate variables on the brown bear, which provides information about how and in what way climate change will occur in the future. Large-scale habitat suitability modelling and mapping studies help to establish sustainability and adaptation strategies for the target species. Therefore, this study is qualified to fill an essential gap in the literature for researchers who will study the brown bear.
The variables contributing to the formation of the large-scale brown bear current habitat suitability model are annual range of temperature, mean monthly precipitation amount of the warmest quarter, annual precipitation amount and temperature seasonality. The common ground of these variables is that temperature and precipitation affect the brown bear. Dhakal (2014) stated that changes in temperature and precipitation are the main reasons for the reduction of food resources of various wild animals in agricultural areas, especially during the dry season. Aksan (2023) found that wild animals (mammals and birds) that cannot meet their nutritional needs in their current habitats prefer different habitats. For wild animals that needed different habitats, this caused their habitats to fragment, shrink, and even disappear. Of the family Ursidae, only the brown bear is distributed in Europe, and has been found to be affected by temperature and precipitation variables. MacHutchon (2001) found that the grizzly bear is mostly active during the day, but McLellan and McLellan (2015) found that a small increase in temperature affects the period in which the grizzly bear is active (activity pattern, diurnal or nocturnal). Schwartz et al. (2010) found that the activity of the grizzly bear population in temperate regions decreases as the ambient temperature exceeds approximately 20°C.
Delgado et al. (2018) found that an increase in temperatures in the dens where the brown bear shelters in winter for torpor make the brown bear leave the shelters earlier. This was also confirmed by Evans et al. (2016), while it was also found that the bear’s body temperature increases (Welinder et al., 2016). Manchi and Swenson (2005) and Niedzialkowska et al. (2019) revealed that as the brown bear’s body temperature rises, its effort to reach food around the habitat and its interest in the hoofed animals that meet the bear’s nutritional needs decreases. Therefore, rising temperatures affect the brown bear’s food and habitat preferences according to its body temperature (Moe et al., 2007; Pigeon et al., 2016). According to Su et al. (2018), the increase in the temperature variable value in the study area and the decrease in the habitat suitability of the brown bear support this situation. In this context, the value results of the temperature variables we obtained are in accordance with the literature.
When precipitation variables that contributed to the formation of the brown bear’s current habitat suitability model were evaluated, a linear relationship was found between average precipitation variables and the occurrence of the brown bear. These areas with high precipitation correspond to areas where the brown bear exists (Mohammadi et al., 2021; Ashrafzadeh et al., 2022). Su et al. (2018) found that brown bear habitats will be affected depending on the amount of annual precipitation and that the species continues to be present in areas where precipitation amounts up to 406 mm, and that this value will increase to 459 mm in 2050. Su et al. (2018) have also found that the effect of precipitation amount on the brown bear throughout the season is 51% (Seryodkin et al., 2013) and that with an increase in annual precipitation values of 5 mm, its daily activity will increase by 0.1 km/hour (Martin et al., 2010). As precipitation decreases in spring, the brown bear rests less during this season (Stelmock and Dean, 1986) and feeds on species that are sensitive to precipitation variables (Su et al., 2018). As a result, temperature and precipitation variables are the primary factors contributing to the brown bear’s current and future habitat suitability (Penteriani et al., 2019; Mohammadi et al., 2022; Ashrafzadeh et al., 2023) and the resulting models and maps are in accordance with the literature studied.
The brown bear’s current habitat suitability map was created with temperature and precipitation variables contributing to the model. When the map was evaluated according to the distribution inventory of the International Union for Conservation of Nature’s brown bear distribution inventory (IUCN, 2023), it was revealed that there was an expansion in the existing habitats. These results have the potential to contribute to the literature. However, according to the year 2100 of SSP126-SSP370-SSP585 Chelsa climate scenarios, it was determined that the brown bear distribution would shrink, fragment, or disappear. In studies aiming to reveal the effect of climate change on the brown bear, its habitats have been found to be directly or indirectly negatively affected by the IPCC (Intergovernmental Panel on Climate Change) and Chelsa climate envelope models for future years. As a result, the negative impact of the SSP126-SSP370-SSP585 Chelsa climate scenario for the year 2100 on brown bear habitats are in accordance with the literature.
CONCLUSIONS - Zaključci
Suitable and unsuitable habitats have been found by analysing the variables affecting the brown bear population distributed in Europe. According to habitat suitability mapping, priority should be given to suitable areas identified for the protection, sustainability, and creation of a management plan for the brown bear in Europe. This is because one of the most important results of the different simulations applied was the disappearance of brown bear habitat suitability in some regions. Therefore, habitat suitability mapping may ensure the overcoming of the negative effects of climate change that may occur in the 21st century with the least damage and may form the basis for studies to protect wild animal species and habitats. Additionally, Chelsa climate scenarios and the MaxEnt method should be at the forefront of the brown bear conservation policy for the management and protection of future brown bear distribution. Finally, it is believed that the habitat suitability modelling and mapping results obtained within the scope of this study will contribute to researchers who will conduct later studies such as the impact of climate change on the brown bear in Europe.