2. Definition of a Correct Basis for Spatial Network Analysis Using Digital Road Model
According to the unified approach of the series of standards dealing with spatial information ISO/TC 211 − Geographic information/Geomatics, modeling of geospatial products, processes and services is presented at 4 levels – meta-metamodel, metamodel, application level and physical level (Govorov 2008,Kunchev 2023). After the first 3 steps in (Lipiyska, Angelova 2020,Kunchev, Angelova 2023) and (Angelova 2023) have been implemented, the fourth one will be considered, as an element of it is the definition of a correct basis for the needs of a complete road accidents GIS.
It is important to introduce the concept of a digital road model (DRM) as a set of information resources, including digital information about objects of the transport system, traffic conditions and a graph of the road network (Demidenko et al. 2020). This concept is used as a starting point in defining a foundation for the main purpose of the road accidents GIS − the analysis of events with the aim of reducing traffic injuries.
The individual components to achieve the final goal will be considered − access, input control and systematization of open data, creation of a road graph with a degree of detail sufficient to correctly transmit the information about road accidents, georeferencing of events and procedure for assigning them to the network based on international standardization in the field.
2.1. Access to open data − scoping, filtering, systematization, and input control
Two main sets of open-source vector data from the OSM geoportal were used - the first represents the different classes of roads within the selected territory with the attribute information available for them, and the second − the smallest available territorial units for the territory of the city of Sofia in OSM − the regions of Sofia-City Municipality. One of the criteria for which the regions of the municipality were chosen is the fact that their boundaries coincide with the road arteries of the studied territory.
The data are accessed and bound by query, exported to one of the spatial data exchange formats − GeoJSON, then imported into the GIS Panorama software system. To be maximally usable, the data are systematized, indicating the correspondences between the objects from the GeoJSON file and the specialized classifier created for the needs of working with open data from the OSM source. This process is discussed in detail in (Angelova 2023). The use of the road classifier can also be considered as an element of data input control - this is the place to perform verifications of attribute data type matching, establishing the presence/absence of mandatory data and metadata, checking for uniqueness of external system identifiers, as well as creating internal ones and others.
2.2. Topological connectivity of the input data
Working with any type of vector data requires topological integrity, i.e. building a topological model to organize the spatial relationships between features (Pavlov, Dechev 2016). After the systematization and attribute verification of the data, a metric verification should also be performed. Before building the road graph, software metric data control was performed on the different types of roads, which are vector objects.
When dealing with different types of vector data (polygons, line, point), there are many parameters available that can be checked and adjusted, such as closing and not overlapping of polygon objects, presence of endpoints, interior to polygon objects, duplicate objects and others (ArcGIS 2010). In the control of linear objects, the main components are checking for connectivity within a specified tolerance and the presence of objects of too small a length, which are generally parasitic. In the specific case for the territory of the city of Sofia, considering that the data аре open-source, 3 metric errors were detected and corrected − 2 objects with too small a length and 1 duplication of a point in one linear segment.
2.3. Creation of a road graph − requirements depending on the goals, problems during creation and their solution
After the topological and attribute connectivity of the network has been verified through the basic steps of input control, the next step is the creation of a road graph as an element of the DRM for the territory of the city of Sofia. For this purpose, a software component was used to build a graph structure with an input parameter of the five main classes of the road network available from OSM, with the total number of objects being 34,700. In the creation of the graph, a specialized classifier was used, adapted to the needs of the road graph and containing the necessary components, such as edges, nodes, direction presented by arrows and others, of course, attribute information and visual representation are available.
The algorithmization includes important parameters, some of which are:
Semantics from which to derive the presence of one-way traffic;
Speed limit on the different types of roads. Here, the possibility to derive the speed from semantics is available, but in the open-source OSM there is no such information for each road section, so the approach of generalization according to road types is chosen. This approach does not take into account local speed limits introduced by road signs; however it should be noted that if more detailed section data is available, it can be used to improve accuracy;
Semantics to be assigned on the edges of the graph. A key component in defining a graph is to assign to its edges characteristics that apply to real road objects. In this case, the name, direction, pavement, number of traffic lanes, description of restrictions and width are chosen. All available features can be selected, but again consideration has been given to the availability and completeness of the source data;
Keeping the connection with the digital map. An important component is keeping the relationship between the graph data with the source data. This is an issue addressed in international standardization and more specifically in the standard ISO 19 148 – Geographical information – Linear referencing (ISO 2012). The standard defines that in a network representation the topological aspect is clearly differentiated from the spatial data set and from its cartographic representation and is contained in the graph structure of nodes and edges. This approach is used both to simplify calculations and eliminate the need to use the large size of spatial data, and when dynamic segmentation is needed with different parameters, such as road pavement, speed limit, number of lanes, and others (INSPIRE Thematic Working Group Transport Networks 2014). The connection of the graph with the digital map is provided by the software option "keep the connection with the map", the principle of which is to assign an internal identifier or an OSM unique identifier to the semantics of the edges.
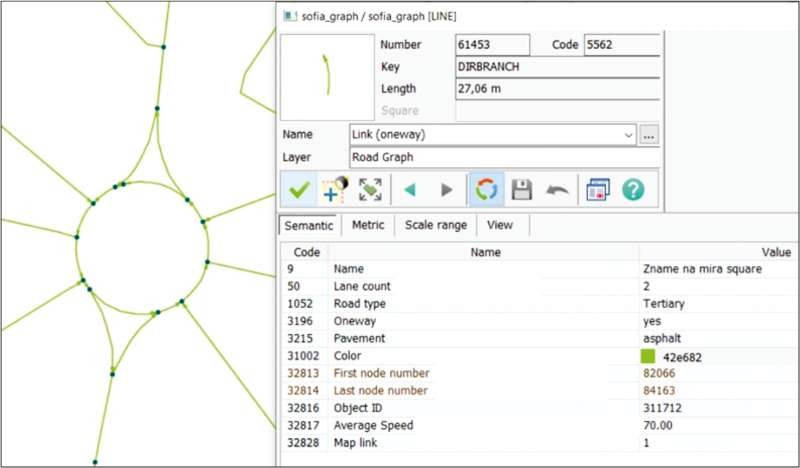
After the automated creation of the road graph, software topological graph control was performed. Its purpose is to determine whether the structure of the graph is correct − whether each edge has exactly two nodes corresponding to the connectivity matrix, whether there are no hanging nodes, intersection of edges without a node (if, of course, the edges are on the same level), and others. The result of this process is a correct graph structure of the research territory (Figure 1).
Figure 1. Segment of a Road graph, created from open-source data from OSM. / Slika 1. Segment cestovnog grafa, stvoren iz podataka otvorenog izvora iz OSM-a.
2.4. Georeferencing of road accident data from different sources according to ISO 19 148
When it comes to presenting networks in digital form and performing spatial analyzes on them, an indispensable element is the georeferencing of objects and events, considering the network structure, network limitations, the specificity of derivation, as well as the nature of the source data. One of the established methods in theory and practice is the so-called linear referencing – a method of data collection and location determination by using a measured distance along a linear object through the Linear Referencing System (LRS) (ISO 2012). The main applications are twofold (Scarponcini 2002) − performing linear segmentation of a section, thus allowing the dynamic nature of linear objects to be expressed, modeling their changing characteristics in different sections without dividing the object itself into separate parts, and georeferencing of an event. For the current development, the second application is of interest.
In order to perform the "spatial event referencing" task, a fundamental concept laid down in the linear referencing standard ISO 19 148 should be followed − to represent the location as a single position, 3 components are needed − a linear element that can be measured (for example by a graph structure with directed edges and defined weights), a linear method (absolute, relative or interpolative) and a measured value on the linear object (ISO 2012). However, such data are not always available, so the approach of georeferencing events and objects in practice is extended relative to the type of source data. For the physical performance of the task, as an element of the systematization of the data, functionalities have been introduced in the road accidents GIS in order that the final result is available regardless of the spatial indicator of the source data (absolute coordinates, address, mileage, relative location to a geographical object or other), and the end result is a standardized representation of the location of the event in accordance with international standardization.
3. Determination of Spatial Network Autocorrelation
Analyzing road accidents is a major task of road accidents GIS. The current development considers a specific case of defining a geographically oriented dependence between the number of road accidents in different locations considering the network nature of the transport system, namely − spatial network autocorrelation. General concepts in the field will be described, and then the physical determination of the autocorrelation coefficient for the regions of the Sofia City Municipality with real open-source road accident data, as well as its statistical reliability, will be presented step by step. For the physical implementation, an author's script was created with the capabilities of the Python programming language, which is implemented directly in the GIS Panorama console or as a separate application with a user interface.
3.1. Generalities of Spatial Network Autocorrelation
Spatial autocorrelation is known to be a correlation between attribute values of the same type at different locations (Odland 2020). A physical solution to this statistical method is presented by Moran with the so-called Moran's coefficient, or also found in the literature as Moran's I. Moran considers two cases − local (representing the correlation between the attribute values of a specific cell with those surrounding it) and global (representing the average local correlation between all cells) (Black 1992). The subject of analysis in the road accidents GIS is the local case, as it is more practically applicable, and it is also known that in the global case there is proportionality to the average value of all cells in the local case.
Practically, the autocorrelation coefficient indicates the presence or absence of linear dependence, and its value allows to characterize the strength of the relationship between the researched elements from the point of view of mathematical statistics. The goal of the analysis is the construction of a statistical model of dependence of the given indicator in each territorial unit and its neighboring units, considering the influence of selected factors. The presence of a statistical value of the autocorrelation coefficient indicates the occurrence of processes that determine the clustering of values in neighboring locations, and the addition of various factors in the model leads to an increase in the accuracy of statistical modeling (Eliseeva 2002,Samsonov 2022).
The network variety of the method involves determining a relationship between attribute values of edges of a network and similar values of other edges. This approach is used to achieve the objectives of the road accidents GIS, with the attribute values being the number of road accidents in administrative units.
A theoretical statement and various studies of the method can be found in (Anselin 1995,Black, Thomas 1998,Black 2010,Okabe, Sugihara 2012,Odland 2020,Samsonov 2022).
3.2. Steps to determine local spatial network autocorrelation
It is known that to perform a spatial network autocorrelation analysis, a set of edges and nodes, a set of attribute values, and a set of weight values are required. With this data available, several steps are performed to calculate it, following the sequence of actions defined in (Okabe, Sugihara 2012):
- Defining network space in a given territory. Such a space is defined for the territory of the city of Sofia, using open data from OSM, after which a correct topologically connected road graph is defined;
- Tessellating the network into non-overlapping and densely filling network cells. Here, the approach is used with a division by administrative units, accessible from open data and imported as polygon objects. Important attribute values are the system internal number (Number) and the OSM identifier, both values being unique (Figure 3, columns 5 and 2);
- Determination of representative points of the network. The main purpose of this step is the subsequent determination of spatial weights between territorial units. Here, the centers of the mass of the network cells are selected, and for each "region" polygon object, a centroid is generated by a built-in GIS algorithm. To account the network structure and the network constraints it imposes (such as one-way traffic for example), centroids are assigned to the corresponding nearest edge from the network using the shortest distance principle. An important element is the preservation of the connections between the generated centroids and the polygon objects, and this is done by means of internal keys, attached as an attribute value of the objects (Figure 3, column 7).
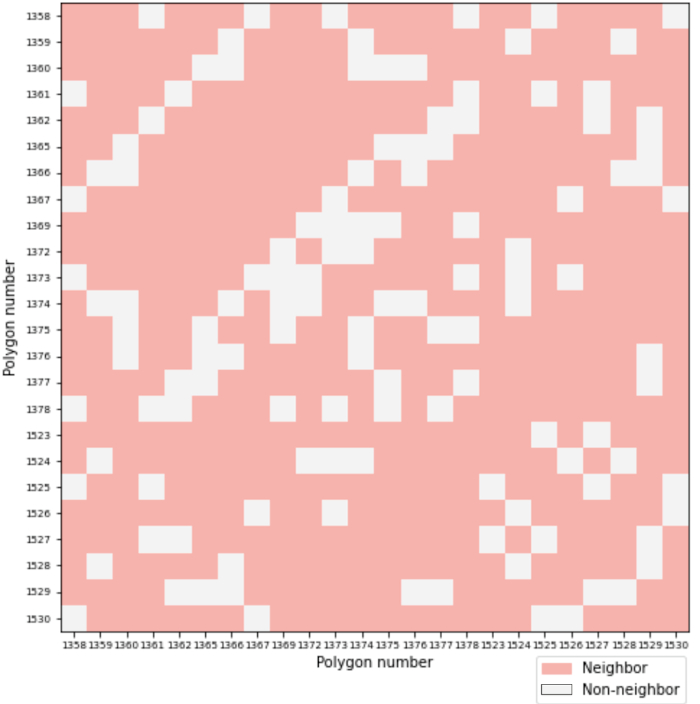
- Determining a neighborhood of the network cells. The goal is to define a neighborhood matrix to be used for subsequent calculations. For each polygon object, its neighbors are determined using a topological neighbor algorithm, also called the checkerboard method. The practical implementation is reduced to the determination of common points, and it is sufficient to determine even one point (Samsonov 2021). The method was used since it is suitable for territorial-administrative units for which it is certain that the topological connections are correct. For the practical implementation, a Python programming language script was created, through which the neighborhood is determined using the unique numbers of the polygon objects and their geometric position. The script sorts the polygons by number and creates adjacency links, as for non-adjacent polygons, the values are 0. The result is the so-called a binary neighborhood matrix (Figure 2) to be used to construct a spatial weights matrix.
After applying the neighborhood determination method, the identifiers of the neighboring polygon objects are added as an attribute of each region (Figure 3, column 4).
Figure 2. Binary topological neighborhood matrix resulting from the algorithm. / Slika 2. Binarna topološka matrica susjedstva.
- Calculation of spatial weights between all adjacent pairs of network cells. In general, the spatial weight characterizes the strength of the connection between territorial units, and the ordered set of all spatial weights is the well-known in theory weight matrix. The process of defining a weight matrix is defined by (Odland 2020) as one of the most important, as the weighting function is a means of ascertainment a hypothesis regarding relationships between the researched locations.
The development uses the metric weight defined in (Okabe, Sugihara 2012):
Where ds(pi, pj) is the shortest distance, and α and β are positive constants.
The used metric weight (1) is a function of the shortest distance on a network in the special case where the reciprocal of the distance in kilometers is used. In this model, the main idea is that closer objects have a greater influence on the result, which is practically an expression of the First Law of Geography, defined by (Tobler 2004) − "everything is connected to everything else, but nearby things are connected more than distant".
For each centroid (pre-assigned to its nearest edge), the shortest distance on network to all centroids of neighboring polygons is determined. Due to the presence of the neighborhood matrix, the computational resource is reduced by determining the distances only between neighboring cells and not between all.
The result of the physical execution through a Python script is a rectangular matrix of shortest distances with dimension the number of network cells, such that between non-adjacent cells, the values are 0. Based on the distances, spatial weights of each cell with each of its neighbors were calculated, using formula (1). The result is a weight matrix with dimension the number of polygon objects, again the relations of non-adjacent cells are assumed to be 0.
- Georeferencing of road accident data. This step aims to determine the total number of attribute values under analysis. With real road accident data available, each road accident can be georeferenced according to the linear reference standard depending on the availability of source data, and the result is a spatially defined object that is attached to a graph edge based on the shortest distance as needed.
The development used real data from an open data portal for road accidents [https://opendata.yurukov.net/], which contains spatial information about severe road accidents that occurred on the territory of the city of Sofia in KML format with an available text description. The data are processed by exporting the geodetic geographic coordinates and the available textual information. Structuring the data includes transforming the coordinates into the project coordinate system (the normatively established Bulgarian geodetic system BGS2005, UTM 35N, EPSG 7800), extracting the date from the textual data for its differentiation by query, adding the descriptive part as an attribute field and importing it in a GIS in a usable format. The available data contains 801 serious road accidents for 2013 and 487 for 2012.
Each road accident is assigned to a nearest edge automatically via a Python script, after which the total number of severe road accident for each area is determined.
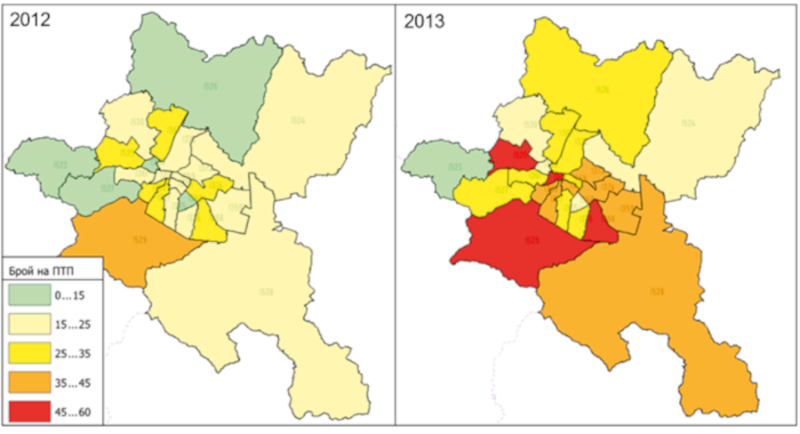
- Determining the total number of attribute values for each cell. The purpose of the step is to supply the last component necessary for calculating spatial autocorrelation – number of attribute data examined for each region. For each territorial unit, the number of serious road accidents within its boundaries is determined using a inner-point algorithm created in Python. The coordinates of the road accidents were used as an input parameter, and for each polygon object "region" it was determined whether the point is internal to its coordinates in the unified coordinate system. The result (number of accidents for each region) was assigned as an attribute value of each region (Figure 3, column 6,Figure 4) and it is used in the calculation of the autocorrelation.
Figure 3. Determining the number of road accidents for each territorial unit with output data from an open portal. / Slika 3. Utvrđivanje broja prometnih nesreća za svaku teritorijalnu jedinicu s izlaznim podatcima s otvorenog portala.
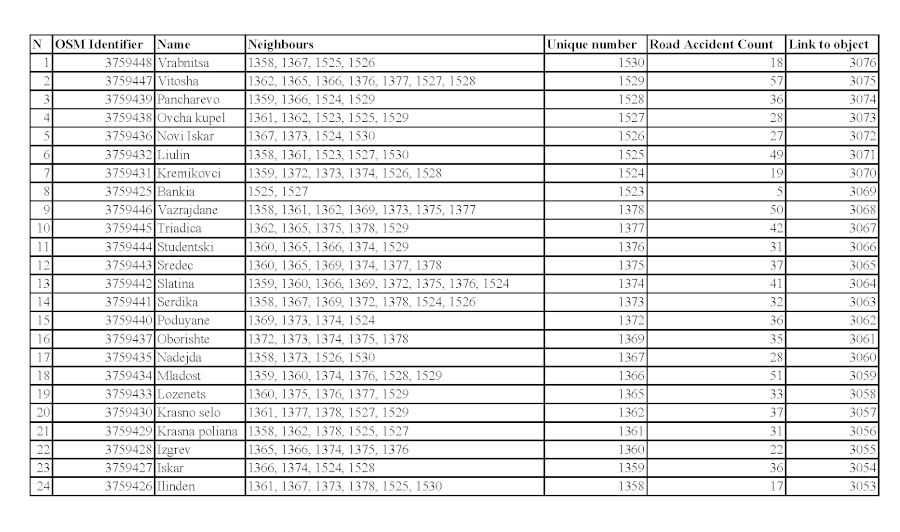
Figure 4. Thermically visualization − number of road accidents for 2012 and 2013. / Slika 4. Termička vizualizacija - broj prometnih nesreća za 2012. i 2013. godinu.
- Calculation of a local case of spatial autocorrelation by Moran's method. To determine the Moran index, the formulas from (Black, Thomas 1998,Black 2010,Anselin 1995) and (Okabe 2012) are used:
where: Ii autocorrelation Moran`s index;
n – number of polygon objects (territorial units);
xi – attribute value of the investigated indicator for current cell i;
is the empirical mathematical expectation, or the average value of the attributes for all network cells.
It should be noted that the index i denotes the current cell, and the index j denotes its neighboring cells. It is also assumed that i ≠ j and wii = 0.
The overall solution is performed using the built-in Python script, and the result is the determination of a Moran`s autocorrelation index value for each territorial unit (Figure 5, column 3). For code efficiency, the denominator is only considered once since it is a constant value.
- Assessment of the accuracy and reliability of the autocorrelation coefficient. Typically, the null hypothesis approach is used to assess accuracy, in which a comparison is made with a variable assumed to be normally distributed (Anselin 1995,Okabe 2012, Samsonov 2020). The null hypothesis states that the analyzed variables are randomly and independently distributed in the studied territories.
The formulas from (Black, Thomas 1998,Black 2010,Anselin 1995,Okabe 2012,Leung et al. 2003s) are used to estimate the accuracy:
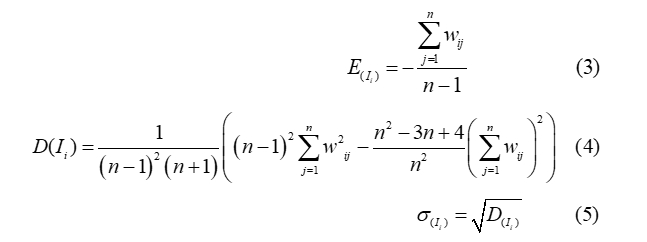
where: E(Ii) – theoretical expected value;
wij – weighting coefficients from a weighting matrix;
n – number of all network cells;
D(Ii) – variance of the coefficient.
The variance formula is derived in (Leung et al. 2003) and (Anselin 1995).
The physical meaning of the theoretical expected value is that if the empirically determined value of the coefficient approaches it within the limits of the statistical confidence probability, the values of the studied variable are independent with respect to the neighboring locations. As can be seen from the formula (3), the expected value is a function of the weighting coefficients and the number of studied areas and does not depend on the studied variable. Values that exceed more than 3 times the standard deviation (the so-called rule of three sigma) indicate positive spatial autocorrelation, and values that are 3 times below it indicate negative autocorrelation (Odland 2020).
Indicators of "significance" are the z-value and corresponding to each z-value probability or p-value of the coefficient (Samsonov 2020):
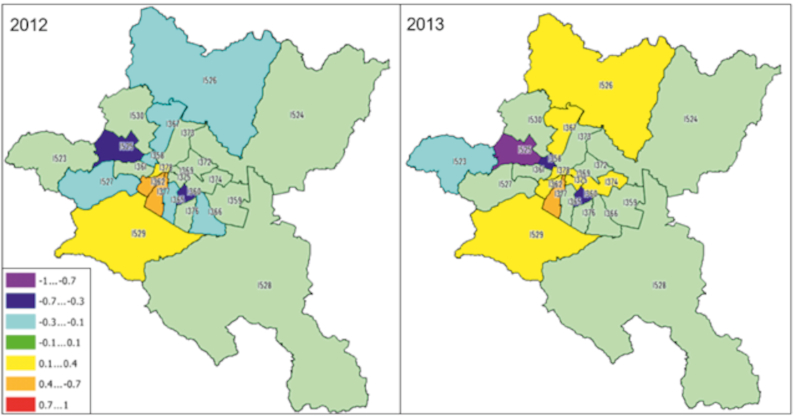
The described formulas are algorithmized using the Python programming language, and a list of Laplace coefficients is created for Fisher's criterion. The results of the calculations, representing the accuracy and reliability of the coefficient, are assigned as attribute values to the "region" objects. For graphical presentation, the hypsometric thematic visualization with the autocorrelation index is used (Figure 6).
Figure 5a. Presentation of Moran's coefficient for spatial autocorrelation of road accidents and its assessment of accuracy and reliability as an attribute value of regions of Sofia for 2012. / Slika 5a. Prikaz Moranova koeficijenta za prostornu autokorelaciju prometnih nesreća i njegove procjene točnosti i pouzdanosti kao vrijednosti atributa regija Sofije za 2012. godinu.
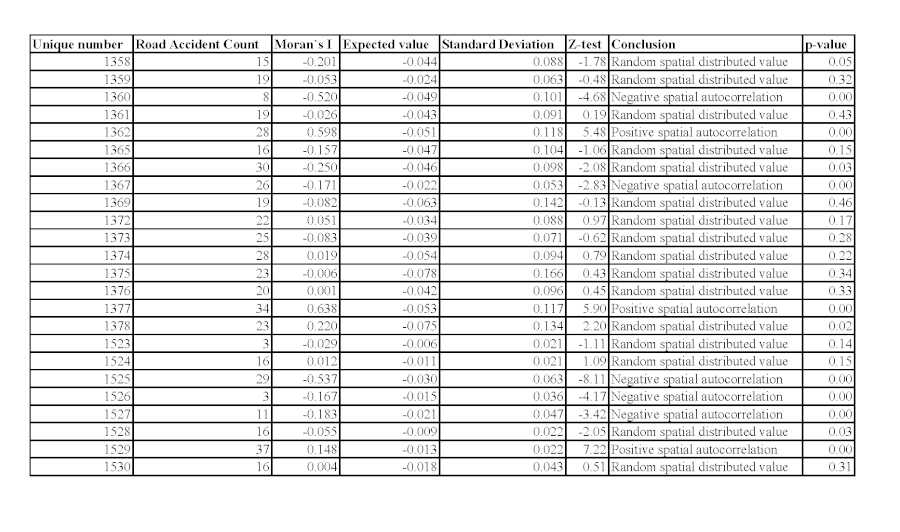
Figure 5b. Presentation of Moran's coefficient for spatial autocorrelation of road accidents and its assessment of accuracy and reliability as an attribute value of regions of Sofia for 2013. / Slika 5b. Prikaz Moranova koeficijenta za prostornu autokorelaciju prometnih nesreća i njegove procjene točnosti i pouzdanosti kao vrijednosti atributa regija Sofije za 2013. godinu.
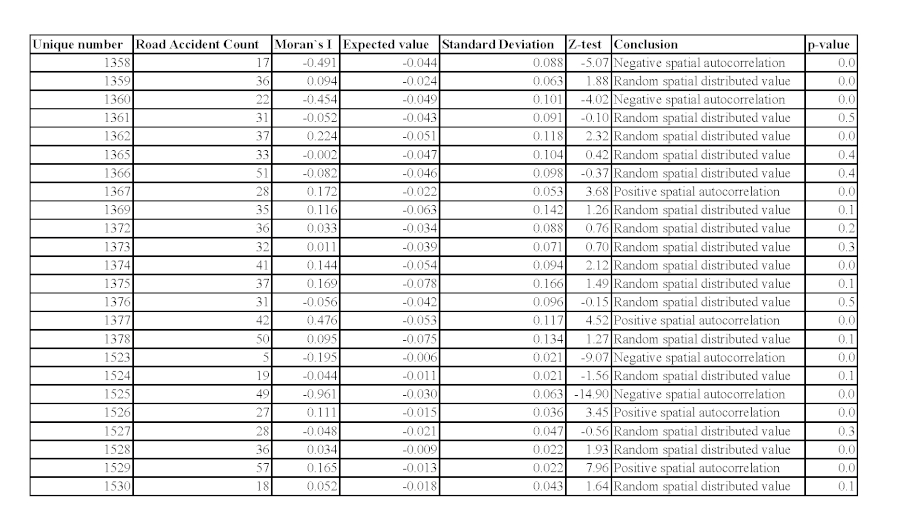
Figure 6. Hypsometric thematic visualization of spatial autocorrelation of road accidents in Sofia Municipality for 2012 and 2013. / Slika 6. Hipsometrijska tematska vizualizacija prostorne autokorelacije prometnih nesreća u općini Sofija za 2012. i 2013. godinu.
- Interpretation of the results. For the interpretation of the results, the statement of (Anselin 1995) can be used that positive values of the index (with reliability according to the rule of three sigma) inform about spatial clustering of similar values (high or low), and negative values of the index − about clustering of dissimilar values (for example, an area of high values surrounded by areas of low values). It should be noted that, of course, the values of the autocorrelation coefficient depend on the chosen weighting model. In this case, a different from the standard binary model was chosen, which reflects only the presence or absence of contiguity.
The analysis of the results determines that for 5 regions out of 24 for both years there is the presence of spatial autocorrelation with z-value >1.96 and correspondingly p-value <0.05. The regions with established autocorrelation are: 1377 with a strongly pronounced positive for both years −0.43 and 0.68, respectively; and 1529 with a weak positive for both years −0.15 and 0.17, respectively. The two regions are adjacent, i.e. a clustering indicator with common metrics is available. A factor in the availability of the index is the claim that the two regions have a similar number of road accidents as the neighboring locations. For region 1360 and 1525, a clearly expressed negative spatial correlation is established for both years (respectively −0.52 and −0.45 and −0.53 and −0.96). A factor in this result is the fact that in 1360 there are more than twice as many road accidents compared to the surrounding areas, and in 1525 more than twice as many road accidents as compared to those surroundings it. For the region 1358 in both years there was once a randomness with a confidence probability of the limit (95%), once a strong negative value, and this can be interpreted as two consecutive years with a negative autocorrelation with a risk of error of 5%. This negative index shows that there is a noticeable difference in the number of road accidents with the neighboring regions. A similar approach can be applied to region 1362. These spatial results can be used to determine the so-called "black areas" with a concentration of traffic accidents and as a foundation for subsequent analysis of various factors to establish complex of causes for the autocorrelation index values.
In more than 50% of the regions, both consecutive years show that there is no spatial autocorrelation, therefore it can be assumed that the number of road accidents in them is distributed randomly and independently of the neighboring locations. In three of the regions, there is a variation between a positive and a negative coefficient for both years, with the coefficient having a small value <0.2 (this are 1367, 1526 and 1527). Given the small value of the coefficient, various hypotheses can be made with the subject of subsequent analysis.
The above statements are with a degree of reliability calculated as the last component of the development (Figure 5, columns 4, 5, 6, 7 and 8). Here, the fundamental rule in mathematical statistics should be considered, that the absolute value of the coefficient is not of primary importance, but its degree of accuracy and reliability, which is a fact of the results.
As with any spatial statistical model, the interpretation of the results is a function of the accuracy, reliability, and completeness of the source data. It should be noted that the data is archival (from 2012 and 2013), and its completeness and veracity are not guaranteed by its source. Also, the studied areas are of different area. In this regard, considering the dynamics in the management of the transport system, the results of their analysis are also not of a sufficient degree of relevance, which is the reason of not carrying out in-depth analysis. The main goal of the research is to demonstrate a methodology for performing spatial analysis of road accidents.


