1. Introduction
According toISO (2003) height represents the distance between selected point at Earth’s surface and selected reference surface (ellipsoid, geoid, quasi-geoid) “measured” along the perpendicular direction to selected reference surface through the point. In geodesy two types of heights are considered: ellipsoidal height which is strictly geometrical distance between point at Earth’s surface and surface of the ellipsoid of revolution “measured” along normal line (direction perpendicular to surface of ellipsoid of revolution) through the selected point and gravity related-height (orthometric, normal and normal-orthometric) which represents the distance between mean sea level and selected point at Earth’s surface “measured” along gravity vector through the point. Precise height determination is one of the most complicated geodetic tasks with high accuracy demand especially when speaking of basic geodetic works i.e. establishment of national height systems and computation of national geoid models.
2. Geodetic height determination methods
There are a several different geodetic methods for determining of heights or height differences. These methods, depending on used measuring technique, can be divided in two main groups: geodetic terrestrial methods and geodetic satellite methods. Geodetic terrestrial methods assume the usage of ground-based instruments (theodolites and levels) with numerical readings of height differences on levelling rods and zenith angles with slope or horizontal distances. Geodetic satellite methods use distances from satellites (orbiting the Earth) to ground-based satellite receivers obtained from measuring time travel of emitted electromagnetic signal or number of its phases. Terrestrial methods determine height differences between two points at Earth’s surface relatively that is height of one point is obtained relatively to the height of second point while geodetic satellite methods directly obtain heights of ground-based receivers. Geodetic terrestrial methods, according to used surveying instruments, are classified as geometric levelling (using level) and trigonometric levelling (using theodolite) while the most common geodetic satellite method is so called “GNSS/levelling” (Global Navigation Satellite Systems; include: USA NAVSTAR GPS, Russian GLONASS and European Galileo) (Kasser, 2002).
For the purpose of this paper geometric levelling and GNSS/levelling were used.
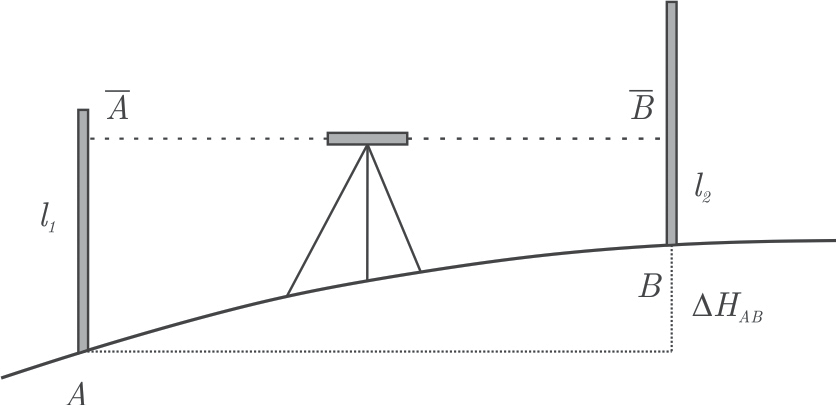
Geometric levelling is determination of height differences using geodetic levelling instrument called level and at least one levelling rod. To measure the height difference between two points A and B, levelling rods are set up opposite each other at these two points and a level (levelling instrument) somewhere between them (Fig. 1). Since the line is horizontal, the difference in the rod readings and represents the height difference (Hofmann-Wellenhof et al., 2006).
Geometric levelling can be divided in several groups (orders) regarding to accuracy: 1st order – levelling of high accuracy (reference probable error ), 2nd order – precise levelling and city levelling ) (Macarol, 1960;Klak et al., 1993). Third and fourth order refer to technical levelling () (ibid.)
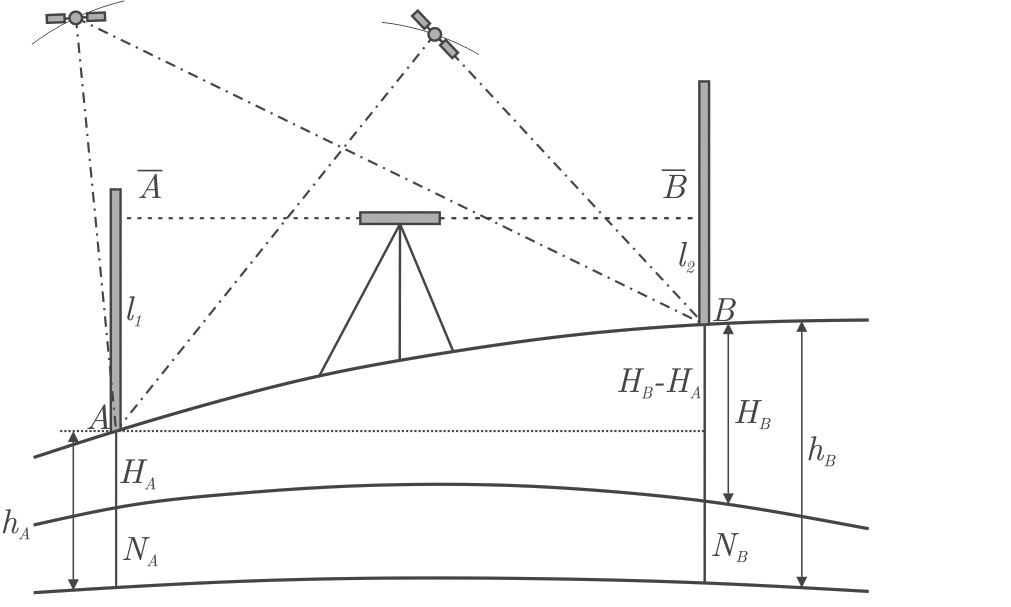
Geometric levelling is a very time-consuming operation. GNSS has introduced a revolution also there. The basic equation is . This equation relates the gravity-related height H with ellipsoidal height h (above the ellipsoid) and geoidal undulation N (distance between geoid and ellipsoid). If any of these quantities are determined through measurements, then the third quantity can be computed.
If h is obtained by GNSS, and if there exists a reliable digital geoid map of N, then the orthometric height H can be obtained immediately. GNSS/levelling can be used for geoid determination, if h is measured by GNSS and H is available from levelling, the geoid N can be determined as . Referring to Fig. 1 and applying to points A and B leads to .
With GNSS/levelling is obtained, so that with a known geoid, i.e. known , the orthometric height difference may be computed. This is a tremendous advantage since otherwise the classical levelling together with gravity measurements is required to determine the orthometric height difference ( Hofmann-Wellenhof et al., 2006).
3. Croatian height systems and geoid models
Republic of Croatia has historically inherited two reference height systems/ datums, based on two levelling networks of highest order: Austrian Precise Levelling (cro. Austrijski precizni nivelman – APN) and 1st High Accuracy Levelling (cro. I. nivelman visoke točnosti – INVT). APN was conducted in period from 1874 to 1916 including whole southern and southeastern part of former Austrian-Hungarian Monarchy that is territories of today’s countries: Croatia, Slovenia and Bosnia and Herzegovina (Rožić et al., 2011;Rožić, 2007a;Rožić, 2007b; Rožić, 2001). At the 2nd Conference of Government Commissioners in 1867, APN was suggested to be a basis for height system realization. The holder and contractor was MGI (Military Geographic Institute) from Vienna. During levelling measurements at APN, no gravimetric measurements along levelling sides were performed, so the adopted height system was normal orthometric. Reference surface for this height system (mean sea level – geoid) was determined using one year measurements in 1875 at tide gauge in Trieste, Mole Sartorio (Feil et al., 1993) with 1 cm accuracy (Rožić, 2001). This height system was colloquially called “Austrian Height Datum 1875” (cro. Austrijski visinski datum 1875 – AVD1875). After the World War II, the only height basis of former Yugoslavia was the one from APN which indicates that there were no levelling measurements between two World Wars. Since the long period of APN establishment has passed, Federal Geodetic Administration of Yugoslavia ordered a revision of APN benchmarks. After the revision and taking in consideration the state of preservation of APN benchmarks, in 1946 MGI from Belgrade started levelling measurements at INVT. The configuration of INVT was mostly coincided with APN with additional benchmarks stabilizations along levelling lines. Levelling measurements lasted till 1955 with some repeating measurements till 1963. There were no gravity measurements as well so the adopted height system was again normal- orthometric with same origin at Mole Sartorio. The main characteristic of INVT was that it didn’t satisfy the conditions for levelling of high accuracy (with reference probable error ). Reference height system based on INVT (and APN) was called “Croatian Reference Height System 1875” (cro. Hrvatski visinski referentni sustav 1875 – HVRS1875).
The new height datum of Republic of Croatia (NN, 2004) is realized with the network of 2nd High Accuracy Levelling (IINVT) which was stretched over the territory of former Yugoslavia. Levelling measurements on IINVT were performed in relatively short period from 1970 to 1973. Changes in IINVT network were related to extensions of INVT network along modern roads and railroads and inclusion of APN and INVT benchmarks at places of its overlapping (Rožić, 2001). Mean seal level was determined by measurements at 5 tide gauges at eastern coast of the Adriatic Sea: Koper (Slovenia), Rovinj, Bakar, Split and Dubrovnik for period of 18.6 years and epoch defined on 1st July 1971 (epoch 1971.5). MGI from Belgrade performed gravimetric measurements at only one part of IINVT network so the adapted height system was once again normal-orthometric. IINVT unlike APN and INVT matched the modern criteria of levelling oh high accuracy with reference probable error . The framework of IINVT are 5 regularly distributed so called “fundamental benchmarks”: Koprivnica, Kostajnica, Knin, Otočac and Strizivojna (Klak et al., 1995). The height system with mean seal level determined by 5 tide gauges and realized by IINVT benchmarks in epoch 1971.5 is called “Croatian Reference Height System 1971” (cro. Hrvatski visinski referentni sustav 1971 – HVRS71).
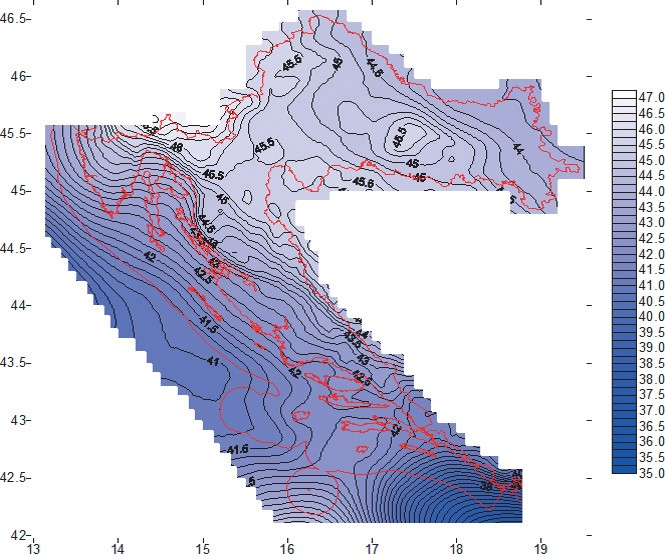
As already mentioned, reference surface for gravity related heights determination is mean sea level (geoid). For the territory of Republic of Croatia, several (quasi) geoid solutions were computed. In 1992 for the first time at the territory of Republic of Croatia (northwestern part) astro-geodetic relatively orientated geoid was computed (Čolić et al., 1993). In 1993 the first geoid solution for the Adriatic Sea, based on satellite altimetry missions’ data (Bašić, 1993) and first gravity geoid using FFT method (Bašić and Čolić, 1993) were computed as well. In 1998, for the first time at the territory of Republic of Croatia, absolutely orientated geoid HRG98 was calculated with internal accuracy of ±5 cm over whole territory of Croatia (Bašić et al., 1999;Bašić et al., 2000). Shortly after, improved solution HRG98A was calculated (Bašić and Brkić, 1999). In calculation of HRG98, for the first time, gravity point data, recalculated to free air anomalies at GRS80 level-ellipsoid were used. Furthermore, 200 astro-geodetic points with known vertical deflection components, ERS-2 satellite altimetry data and 28 GPS/levelling points (for absolute orientation of geoid surface) were taken into calculations as well (Bašić et al., 2000). In 2000, first Croatian official geoid solution HRG2000 (Fig. 2) was computed and implemented in computer software program IHRG2000 (cro. Interpolacija Hrvatski Geoid 2000). Absolute orientation of HRG2000 surface was obtained by 138 GPS/levelling points which was signifycant effort due to HRG98. Internal accuracy of HRG2000 is from ±1–2 cm for the most of Croatian territory to ±5 cm at edge border areas (Bašić, 2001).
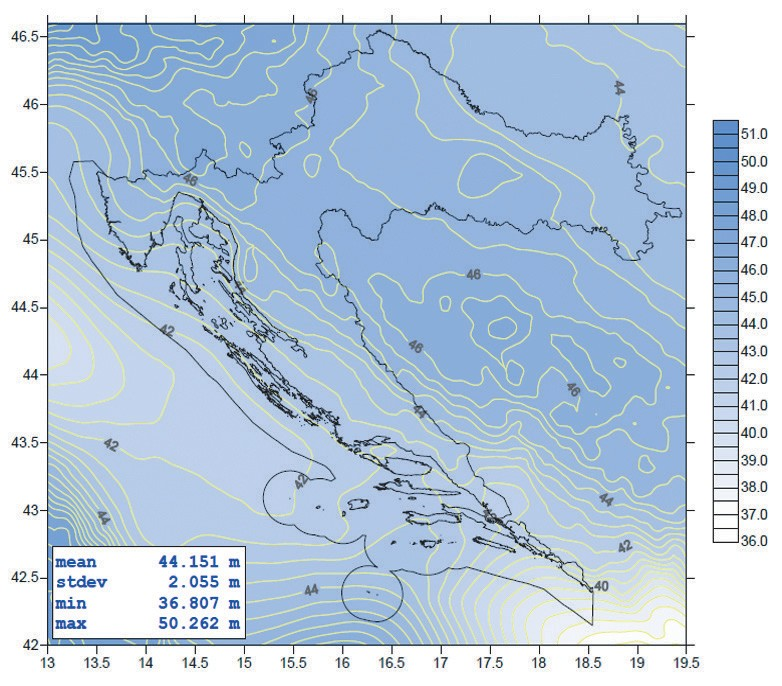
In 2008, within the project New geoid model of Republic of Croatia and improvement of T7D transformation model (Bašić, 2009) new official geoid solution HRG2009 (Fig. 2) was calculated. Main reasons for new geoid computation werethe facts that HRG2000 was compliant with inherited height system HVRS1875 and that new combined geopotential model EGM2008 (Pavlis et al., 2012) was released. The project started with the establishment of 500 GNSS/ levelling points with geoid undulations determined in relation to HVRS71 by connecting GNSS/levelling points to the nearest benchmarks of IINVT with known heights in HVRS1875 and in HVRS71 while coordinates were determined using CROPOS real-time high-precise positioning service (cro. Visokoprecizni Pozicijski Servis – VPPS). From 500 GNSS/levelling points, 495 were selected for the absolute orientation of the new geoid solution HRG2009. GNSS/levelling points had a double purpose: the absolute orientation of the new
geoid surface and determination of outer accuracy of HRG2000. Standard deviation of 9.3 cm in 495 GNSS‑levelling points pointed out to high accuracy of HRG2000 despite that fact that it was calculated with the relatively small amount of data. In addition to the need for the new geoid solution was also the fact that new combined geopotential model EGM2008 has maximal order and degree of 2160 (2190) which correspondents to wavelength of 9 km, while HRG2000 was computed using EGM96 (with order and degree of 360 and wavelength of 55 km). Standard deviation of differences between geoid undulation of 495 selected GNSS-levelling points and geoid undulations from EGM2008 was 4.8 cm. Topographic influences were obtained from Croatian SRTM 3˝ × 3˝ DTM (Bašić and Buble, 2007). The calculation of HRG2009 geoid solution was performed on the basis of 30 000 carefully selected free air anomalies at GRS80. Calculation limits were the same like for HRG2000 (42.0°–46.6° by geodetic latitude and 13.0°–19.5° by geodetic longitude) but with denser grid 30˝ × 45˝ which correspondents to spatial resolution of ∼ 1 km × 1 km. Inner accuracy at 495 GNSS/levelling points of 2.7 cm indicates to very high accuracy and calculation reliability. Independent outer accuracy was calculated in 59 equally distributes GNSS/levelling points which weren’t included in geoid solution calculation. The standard deviation of differences between geoid undulations in those points and geoid undulation interpolated from HRG2009 of 3.5 cm indicates to very high absolute reliability of the new geoid solution.
4. Croatian positioning system (CROPOS)
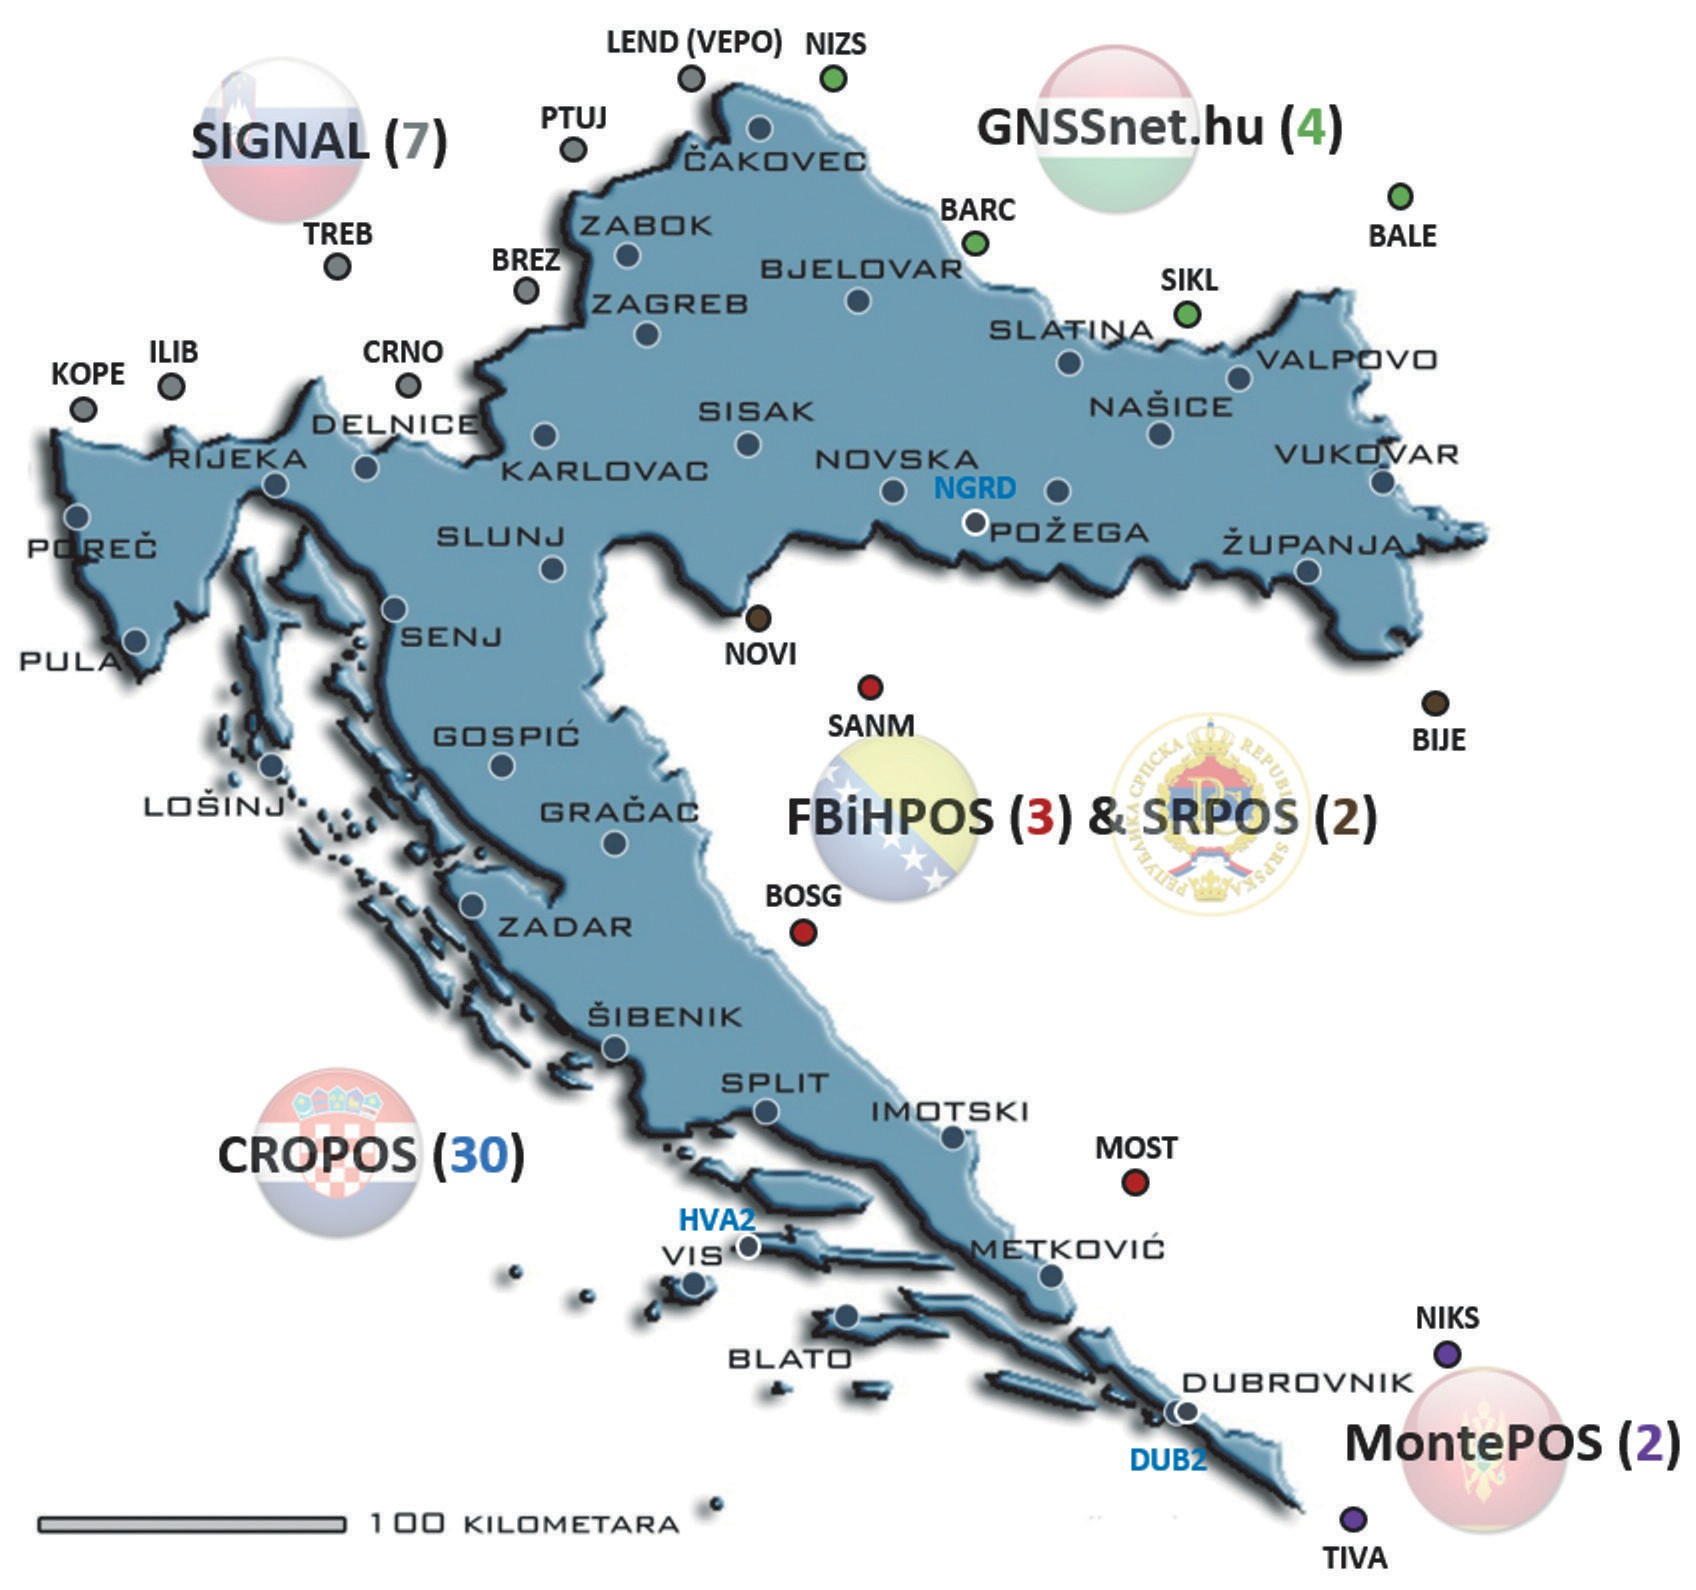
On 9th December 2008, Croatian State Geodetic Administration (CSGA) introduced Croatian Positioning System – CROPOS to official public use. CROPOS represents a network of 30 GNSS continuously operating reference stations (CORS) evenly distributed over the territory of Croatia, approximately 70 km apart (Fig. 3). System is operative 365/24/7 providing real time positioning to its users through differential positioning service (DPS) and high-precise positioning service (VPPS) with 0.3–0.5 m (for DPS), 0.02 m horizontal and 0.04 m vertical (for VPPS) declared accuracy (Marjanović et al., 2009). VPPS provides two possible survey modules: CROPOS_VRS_HTRS96 – enables the usage of new official horizontal reference system (HTRS96) with new official geoid solution HRG2009 and new official reference height system (HVRS71) and CROPOS_ VRS_HDKS – enables the usage of inherited horizontal (HDKS) and height reference system (HVRS1875). CROPOS also provides post-processing through geodetic precise positioning service (GPPS) by downloading CROPOS CORS data or generating virtual reference station (VRS) data in receiver independent exchange (RINEX) format via CROPOS RINEX web-shop with possible below cm level of accuracy.
In June 2009 at 1st CROPOS Conference held in Zagreb, CSGA, Surveying and Mapping Authority of the Republic of Slovenia, Hungarian Institute of Geodesy, Cartography and Remote Sensing (FÖMI) and Real Estate Administration of Government of Montenegro signed an agreement on data exchange of border permanent stations of corresponding positioning systems: CROPOS, SIGNAL, GNSSnet.hu and MontePOS. With this agreement, CROPOS was supplemented with 13 reference stations (7 SIGNAL, 4 GNSSnet.hu and 2 MontePOS) (Fig. 3) (Marjanović et al., 2009).
In December 2013, CSGA, Federal Geodetic Administration of Bosnia and Herzegovina (FGA) and Republic Administration for Geodetic and Property Affairs of Republic of Srpska signed an agreement on data exchange of border permanent stations of corresponding positioning systems: CROPOS, FBiHPOS and SRPOS. With this agreement, CROPOS was supplemented with additional 5 reference stations (3 FBiHPOS and 2 SRPOS) (Fig. 3).
On 13th November 2011 CSGA disconnected IGS station Dubrovnik (DUBI) and established a new one (DUB2), located just 22 m away (Fig. 3). On 29th October 2012 (GPSW 1712, DOY 303) GSGA also established new permanent station at island Hvar (HVA2), inside Astronomical Observatory (Fig. 3). Both stations, DUB2 and HVA2 were included in CROPOS networked solution during 2015. Former IGS station Osijek (OSJE) was moved to Nova Gradiška (NGRD) and began operating on 14th July 2013 (GPSW 1749, DOY 195). Station NGRD (Fig. 3) was also included in CROPOS networked solutions during 2015.
Today, CROPOS with positioning systems of neighboring countries represents total networked solution of 51 reference station.
During 2011, CSGA proposed to EUREF EPN Centre to include 5 CROPOS stations (CAKO, DUB2, PORE, POZE and ZADA) in EUREF EPN. After the period of data analysis as well as fulfilling criteria, those stations were included in EUREF EPN as class B stations on 16th June 2013 (Marjanović, 2013).
CROPOS reference frame is defined due to European Terrestrial Reference Frame 2000 (ETRF2000; R05), transformed from ITRF2005 (Altamimi et al., 2007) using an adopted 14-parameter transformation procedure according to EUREF TWG Memo specifications (Boucher and Altamimi, 2011). Initial adjustment of CROPOS network was performed using 24h session data for GPS Week 1503 (e 2008.83) (Marjanović et al., 2009;Marjanović, 2008)
5. Vertical (levelling) network of the City of Zagreb
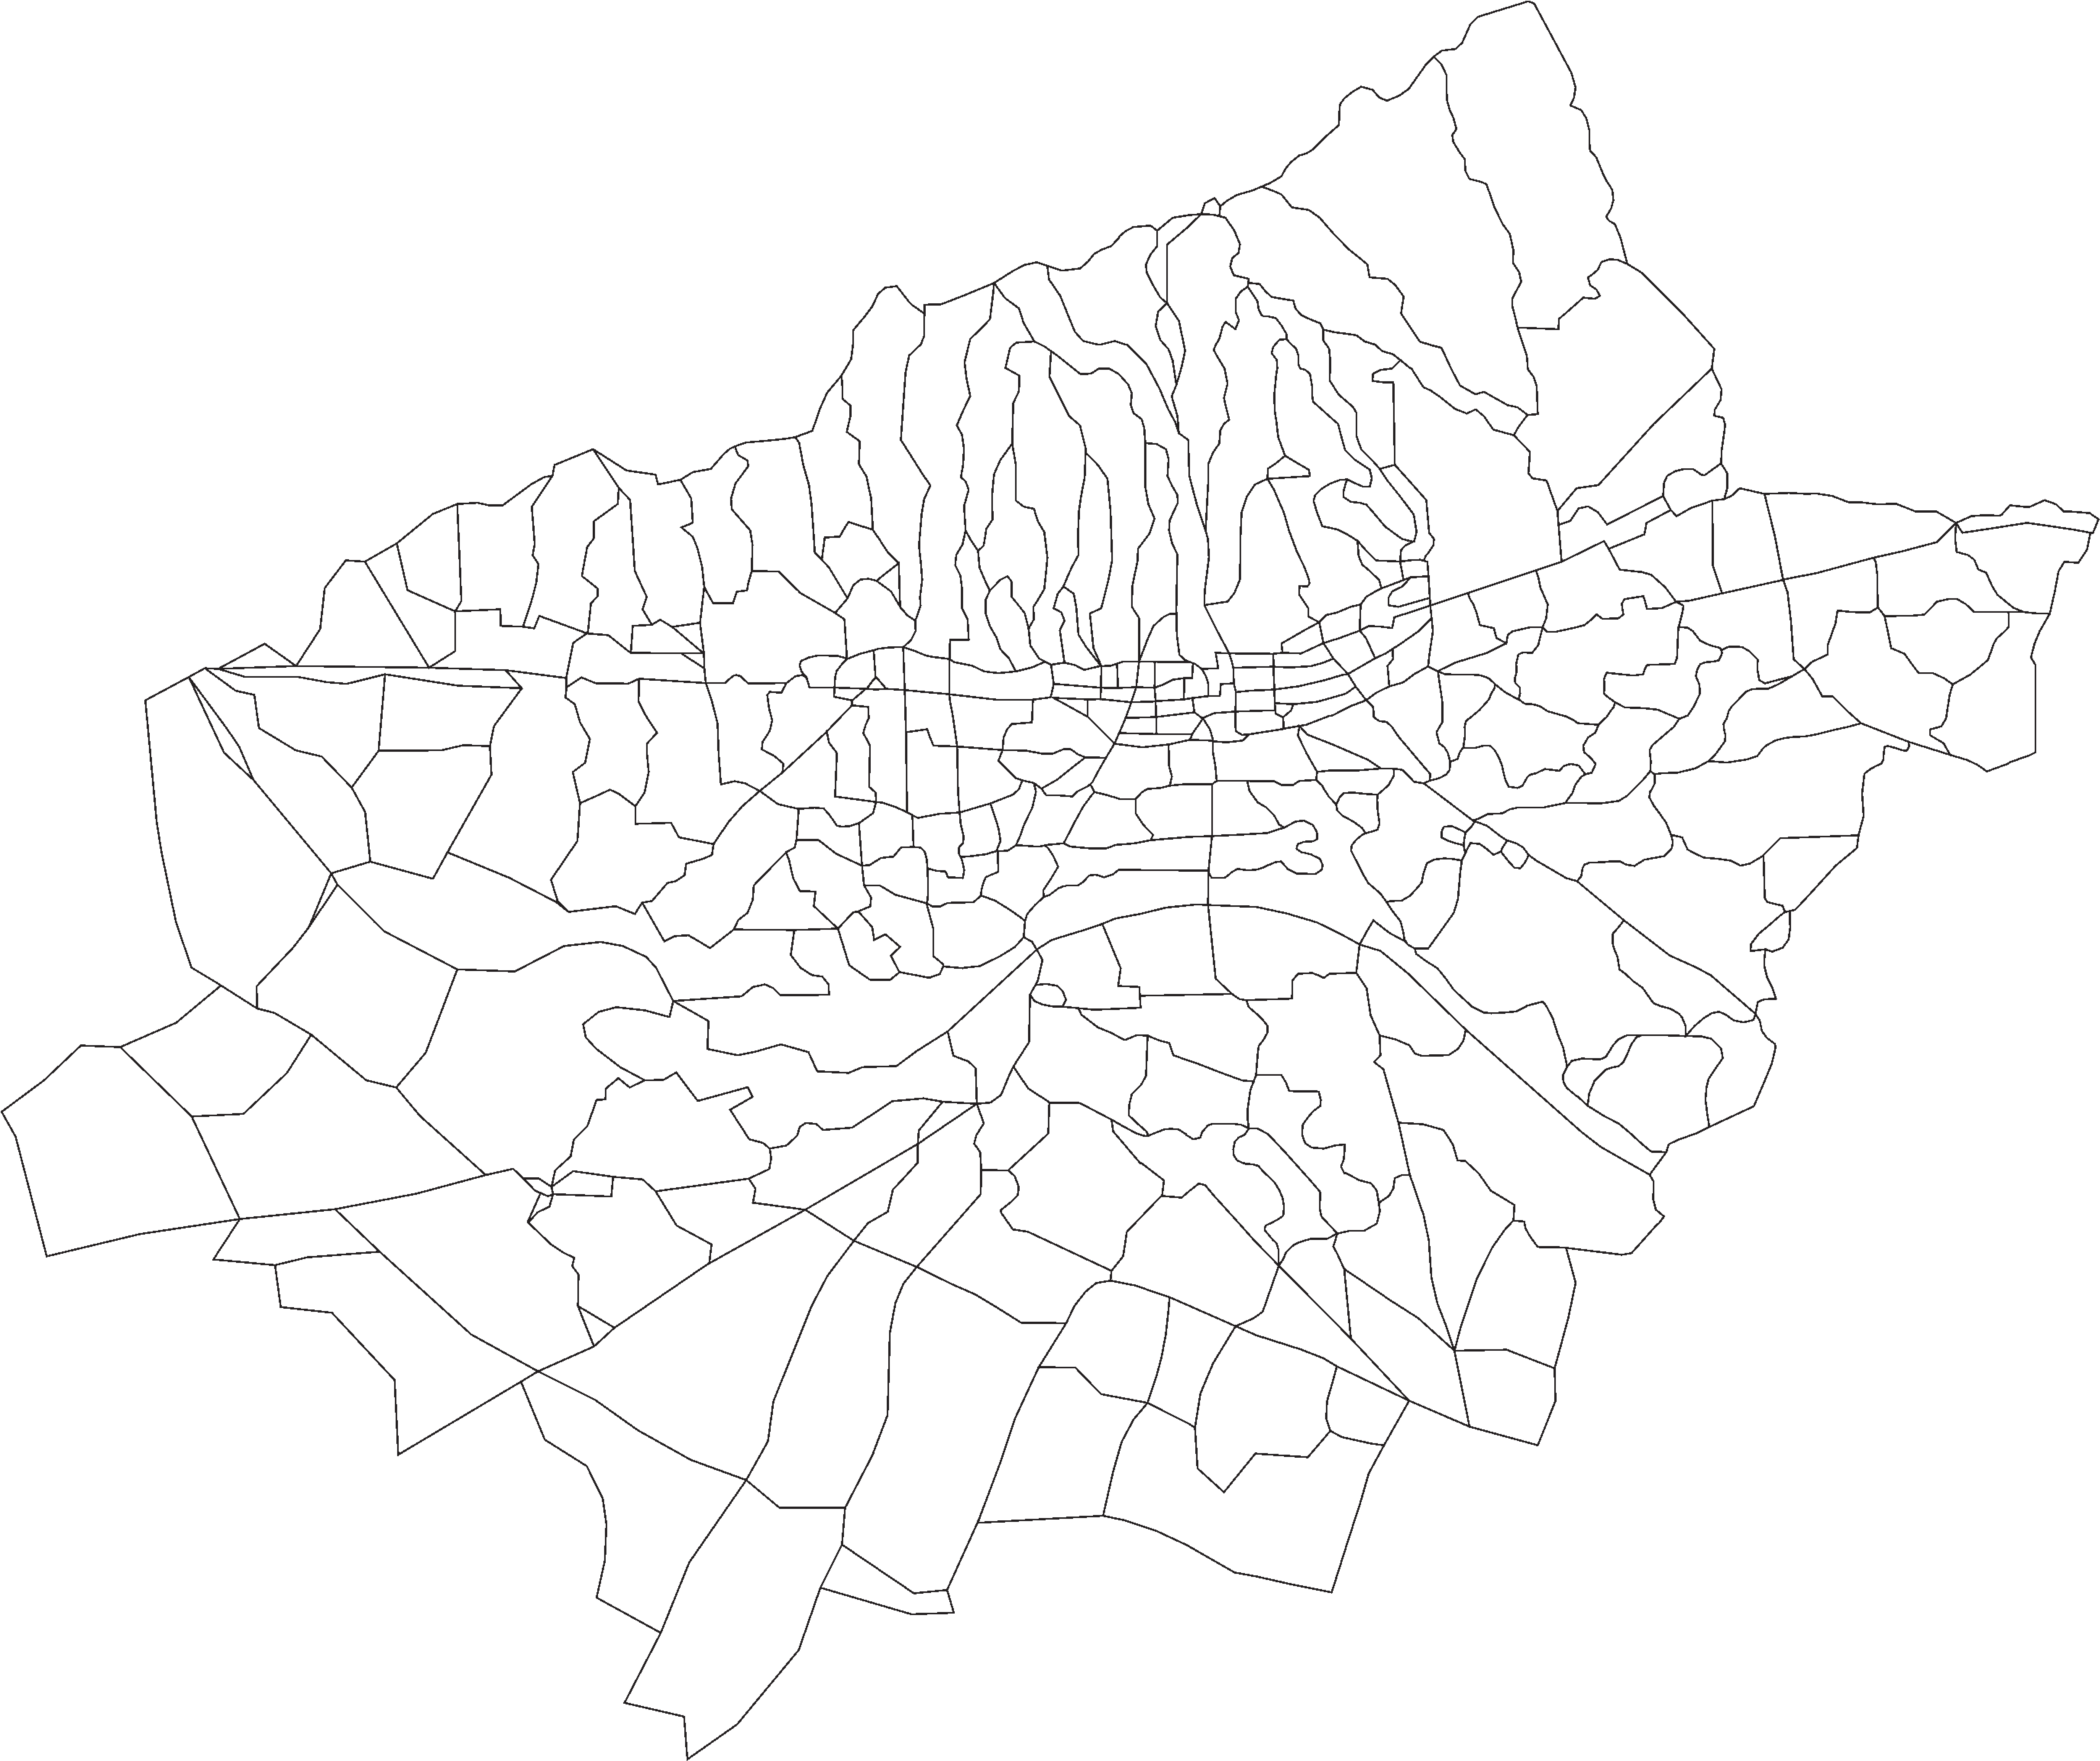
The first vertical (levelling) network of the City of Zagreb consisted of levelling lines, figures and benchmarks based upon precise geometric levelling (II order) during the years 1946–1947 and 1959, and is kept in the archives of the Croatian State Geodetic Administration as a levelling line number 630 (Fig. 4).
Back in the 1950s it covered entire former metropolitan area and consisted of 1104 benchmarks. Due to its size, it was divided into basic and densification network and connected to the levelling lines of I order (I NVT) passing the metropolitan area. During the period between 1970 and 1973, area of the City of Zagreb was once again levelled, but this time with geometric levelling of high accuracy (I order, II NVT). Former measurements were unified with the new ones, and the new vertical network was created (Klak et al., 1994).
Last official revision of network was completed during the 1994, with purpose to determine the state of the preservation of the network, of 1126 benchmarks, total of 560 benchmarks were found. At the same time network was once again adjusted, with mean reference mean error (former mean error of unit weight; today’s reference standard deviation) of , and mean error of unknowns (heights of the nodal benchmarks) in range from ±0.26 mm to ±3.24 mm (Feil et al., 2001).
6. Established GNSS/levelling points
Field work consisted of revision of the selected bench marks and establishment of the GNSS/levelling points at the area of the City of Zagreb. All field work was done simultaneously with stable weather conditions without major fluctuations in temperature and air pressure.
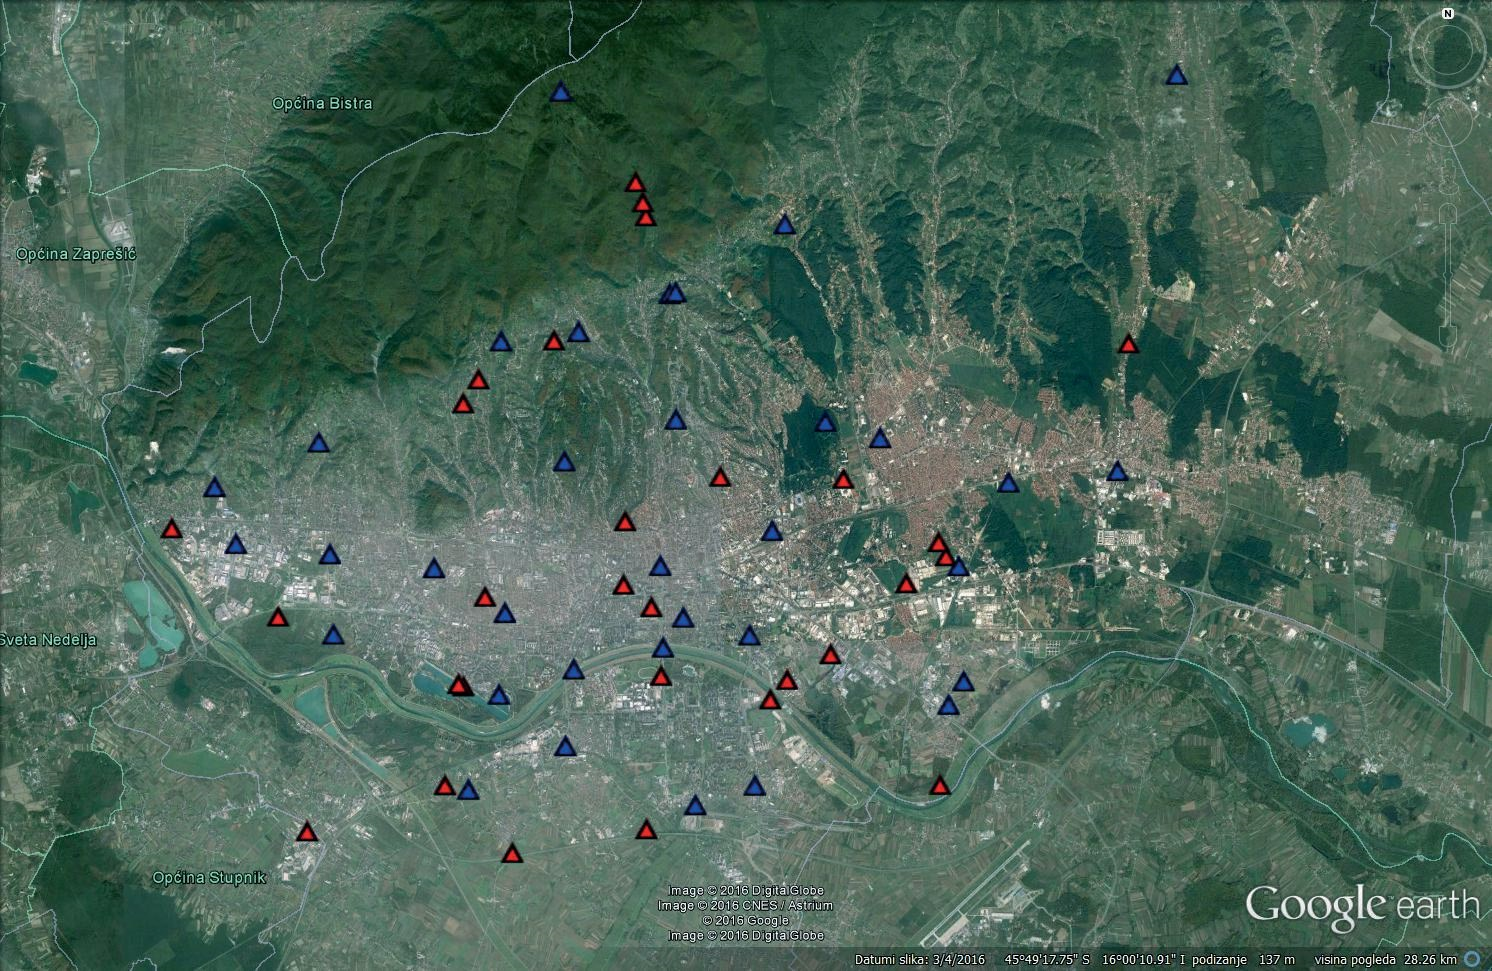
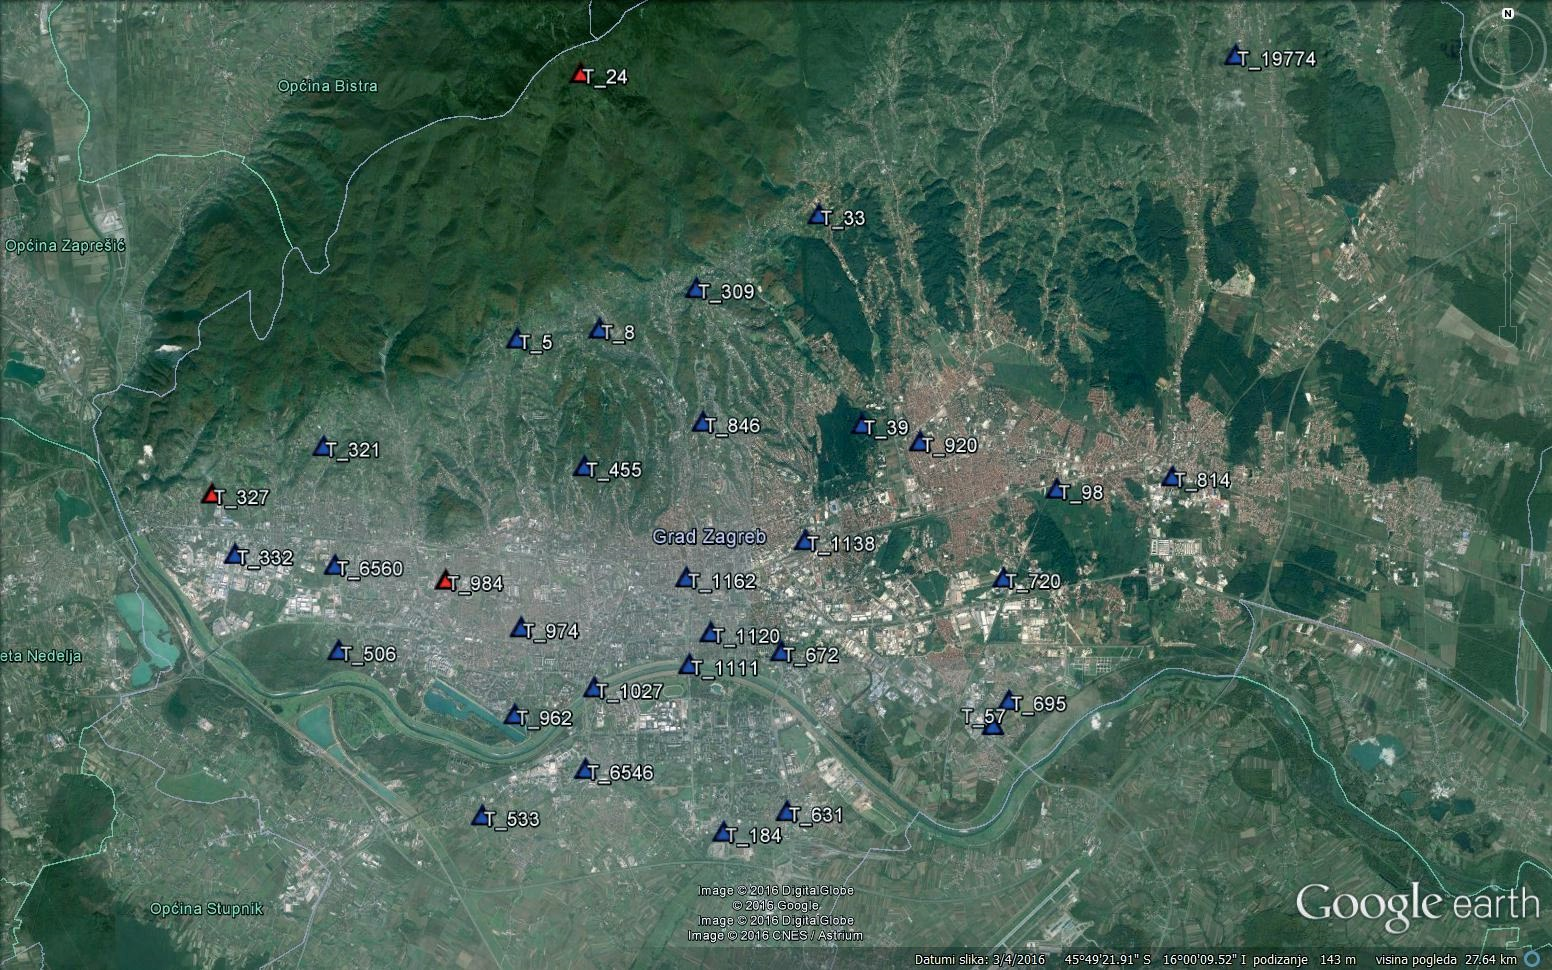
As levelling line 630 covers only 37% of today’s city area (Klak et al., 1994), bench marks from levelling lines number 265, 266, 626 and 643 were also used. Levelling lines 265 and 266 are part of the INVT, and levelling lines 626 and 643 are lines of the technical levelling of higher accuracy (III order) (Klak et al., 1994). Due to the high level of devastation since last official revision, initial set of 40 benchmarks was extended to a total of 63 bench marks, 18 bench marks were destroyed or inaccessible and 11 bench marks were not found.Figure 5 shows selected bench marks after its revision. Inaccessible, destroyed and unfound benchmarks are colored red, while benchmarks used for the establishment of GNSS/levelling points are colored blue. Image analysis shows bad preservation of selected benchmarks and consequently of vertical network in total. Bad preservation is noticeable for all parts of town, and especially for eastern part.
Lack of benchmarks and its bad preservation in northern part of town, especially at higher altitudes will become noticeable during processing and analyzing of the data.
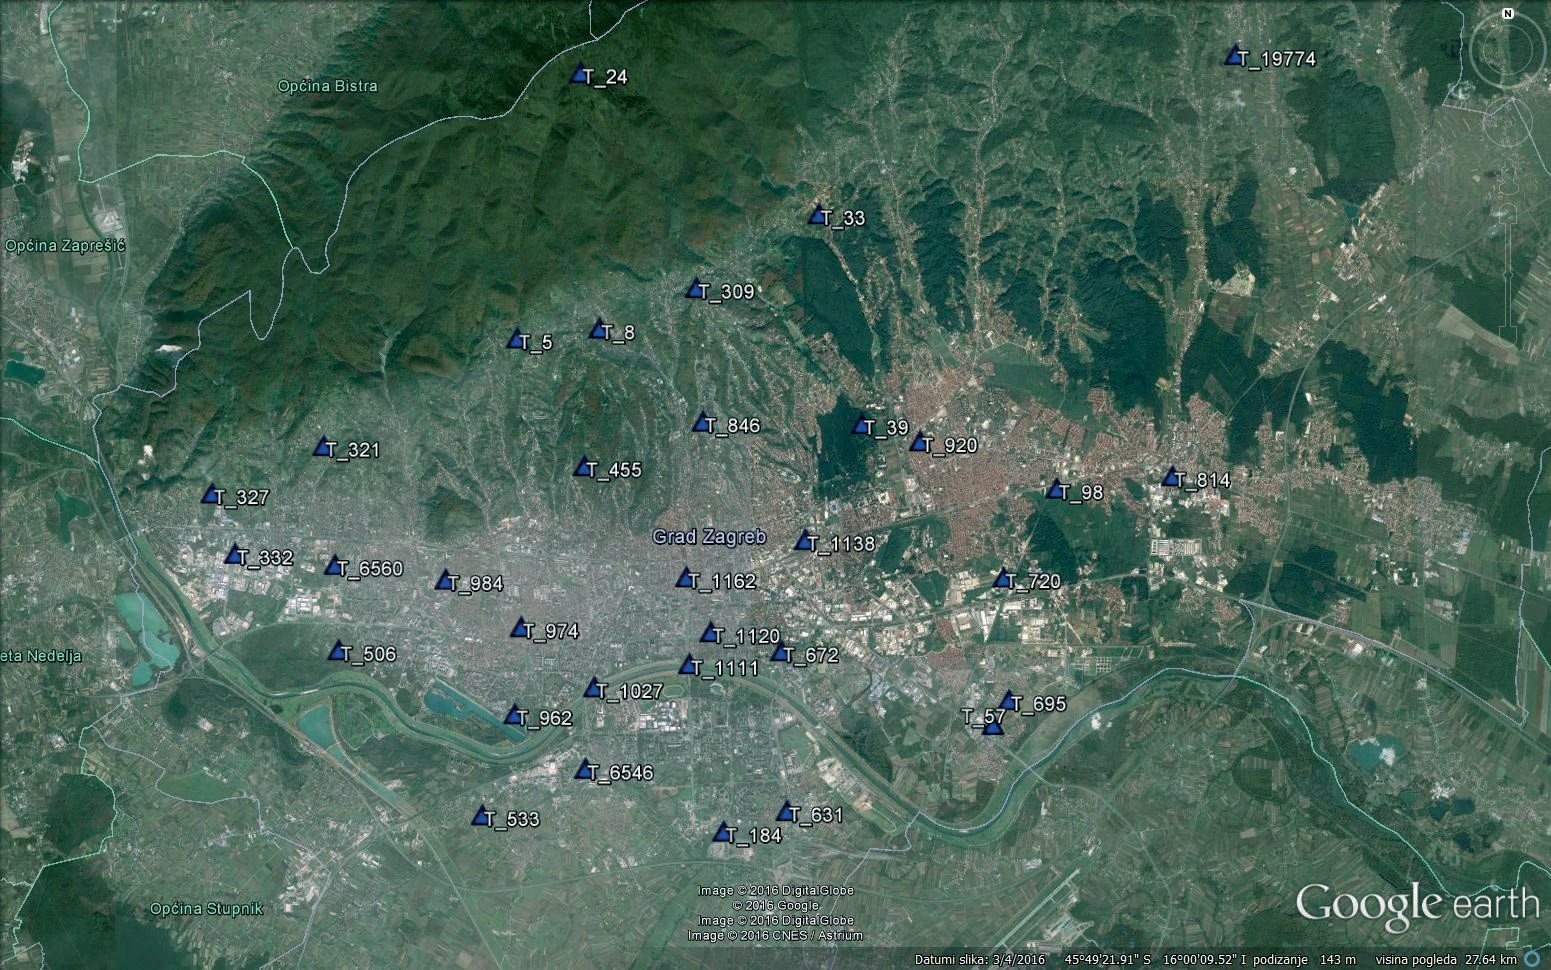
For the purpose of the research, and based on the selected benchmarks, 33 GNSS/levelling points were established (Fig. 6). Each GNSS/levelling point was named T_XXX, where XXX marks name of the benchmark used for its establishment. Benchmarks 309D and 309L are on the right and left side of the pedestrian tunnel, at the distance of approximately 10 meters one from another, therefore for the establishment of the T_309 only one of the mentioned benchmarks
was used (309D). During establishment of the GNSS/levelling points it was taken into account that they are as far as possible from electrical and other wires, trees, buildings and other reflective surfaces in order to minimize the multipath effect in GNSS measurements. Also, it was taken into account that horizon above and around GNSS/levelling points must be clear, in order to obtain a fixed solution of GNSS observations. GNSS/levelling points were generally stabilized with steel survey points along the edge of the sidewalk or some other permanent place. GNSS observations of established points were conducted using modified CROPOS_VRS_HTRS96 VPPS service. Each point was observed twice in 200 epochs (3 minutes and 20 seconds), with minimum of two-hour difference between the observations and independent initialization of 2 meters high receiver. During observations ellipsoid coordinates in HTRS96 (on GRS80 level-ellipsoid) were determined, but instead of normal-orthometric height (H), ellipsoid height (h) was determined. Coordinates were displayed on the controller in the format of Croatian official planar map projection HTRS96/TM (NN, 2004;Lapaine and Tutić, 2007).
Height connection of bench marks and GNSS points was performed using geometric levelling with BFFB (back-forward-forward-back) levelling rod observation order in lines with one viewpoint, with exception of the points T_1138 and T_24 where, due to the dense vegetation, levelling was done in lines with two and three viewpoints. Established GNSS/levelling points cover the area with range in altitudes of 802.51 meters (HVRS71), T_695 is the point with lowest altitude (108.38 m) and T_24 point with the highest altitude (910.89 m). Second highest established point is T_369 at altitude of 278.04 m (HVRS71). Difference of altitudes between highest (T_24) and second highest point (T_369) is 632.85 m, so the average altitude of 32 established GNSS/levelling points (T_24 is excluded) is only 151.09 m, and is a direct result of the lack of benchmarks and its bad preservation in northern part of town.
GNSS observations were conducted using Trimble R8 GNSS receiver and corresponding TSC3 controller, while levelling was done using precise digital level Leica Geosystems DNA03 and fiberglass levelling rod with dual measuring faces, one with bar code and the other with centimeter graduation.
6.1 Quality of performed GNSS observations
Dilution of precision (DOP) (Hofmann-Wellenhof et al., 2008), number of visible satellites, horizontal and vertical accuracy and difference in height and position between two observations were used as indicators of the quality of performed GNSS observations. Dilution of precision is numerical factor that represents the quality of the geometry of the satellite constellation during observation. GNSS receivers report several components of DOP, including horizontal dilution of precision (HDOP) and vertical dilution of precision (VDOP). The combination of these two components of the three-dimensional positioning is called PDOP (Position Dilution Of Precision). DOP associated with an ideal arrangement of the satellite constellation equals approximately 1, and generally accepted tolerance value is 6.
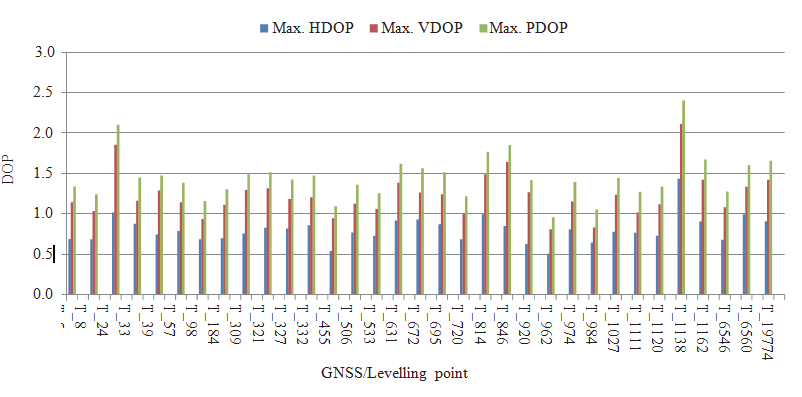
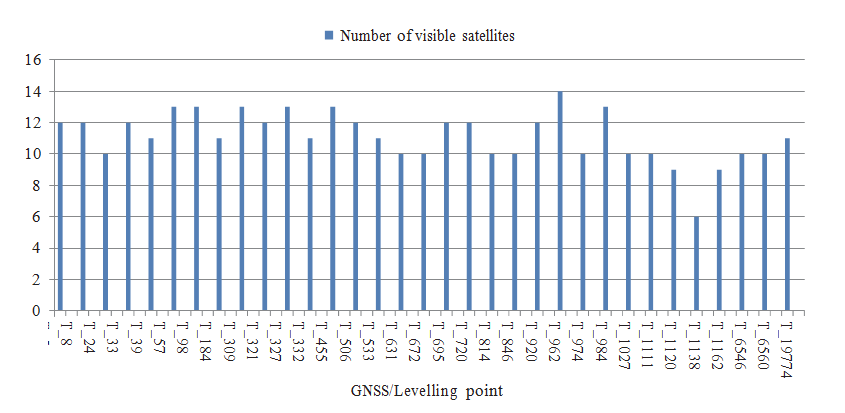
Figure 7 shows maximum values of HDOP, PDOP and VDOP factors for established GNSS/levelling points. Points T_24 and T_1138 shows higher values of DOP factors than the remaining points. For the point T_1138 the reason could be decreased number of available satellites at the time of the observation (only 6,Fig. 8), and for point T_24 due to the favorable number of available satellites at the time of the observation (10,Fig. 8), theirs (unfavorable) constellation. Minimum values of DOP factors occurred for point T_962, point with highest number of available satellites during observation (14,Fig. 8). For the most of points HDOP fluctuates between 0.5 and 1.0, VDOP and PDOP between 1.0 and 1.5.
Table 2 shows statistical indicators of HDOP, VDOP and PDOP factors for established GNSS/levelling points. Average value of 0.8 for horizontal, 1.2 for vertical and 1.5 for positional dilution of precision is more than satisfactory, and indicates good quality of performed observations.
| Statistics | HDOP | VDOP | PDOP |
| Min. | 0.5 | 0.8 | 1.0 |
| Max. | 1.4 | 2.1 | 2.4 |
| Avg. | 0.8 | 1.2 | 1.5 |
| St. dev. | 0.2 | 0.3 | 0.3 |
Figure 8 shows number of visible satellites during observations. Tolerance value for the minimum number of visible satellites, in order to obtain fixed GNSS solution is five. Lowest number of visible satellites (6) was recorded for point T_1138 in urban city area, and highest number (14) for point T_962 with clear horizon around it. For most of the points number of visible satellites fluctuates between 10 and 12, with average value of 11 visible satellites at the time of observation.
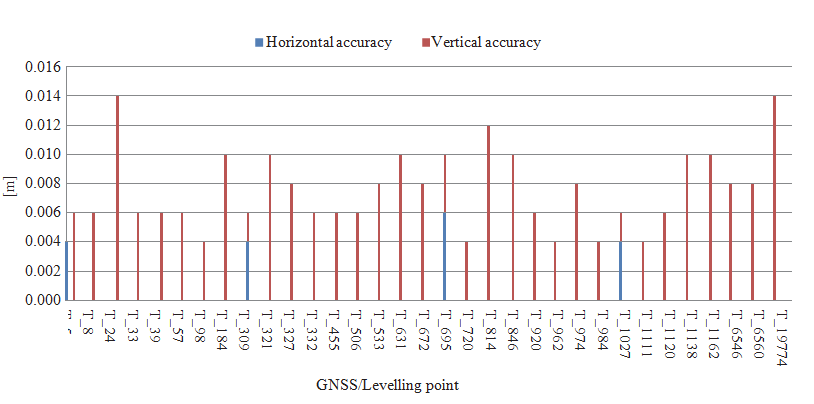
Numerical values of horizontal and vertical accuracy indicate to reliability of obtained data. Declarative horizontal accuracy of CROPOS VPPS service is 2 cm, and declarative vertical accuracy is 4 cm. Figure 9 shows horizontal and vertical accuracy achieved for established GNSS/levelling points. As expected, lowest accuracy was recorded for points with highest values of DOP factor and lowest number of visible satellites. Unexpectedly low accuracy was recorder for the point T_19774, because of high number of visible satellites (11) and average values of DOP factors. This can be attributed to the multipath effect, as the point was established on the place surrounded by electric wires (only possible location).
Highest accuracy was achieved for point T_962, the point with highest number of visible satellites and lowest value of DOP factors.Table 3 shows statistical indicators of horizontal and vertical accuracy achieved for established GNSS/levelling points. Average values are above CROPOS VPPS accuracy, but within the accepted tolerance limit.
Each established GNSS/levelling point was observed twice, so the coordinates (E, N, h) of each point were determined twice.Table 4 shows statistical indicators of the absolute differences in coordinates between two observations of the same point. Average values are within CROPOS VPPS accuracy, while maximum values are above it, but acceptable.
| Statistics | Horizontal accuracy [m] | Vertical accuracy [m] |
| Min. | 0.003 | 0.004 |
| Max. | 0.009 | 0.014 |
| Avg. | 0.005 | 0.008 |
| St. dev. | 0.002 | 0.003 |
| Statistics | ΔE [cm] | ΔN [cm] | Δh [cm] |
| Min. | 0.10 | 0.00 | 0.20 |
| Max. | 3.50 | 4.40 | 4.80 |
| Avg. | 1.32 | 1.27 | 1.83 |
| St. dev. | 1.07 | 1.12 | 1.32 |
From 33 established and twice observed GNSS/levelling points, 15 had positional deviation above the declarative horizontal accuracy of CROPOS VPPS. Seven points showed positional deviation higher than 2 cm for N coordinate and 8 points for E coordinate, of which two points (T_321 and T_1027) showed horizontal deviation greater than 2 cm for both coordinates (Fig. 10).
Maximum value of height difference between two observations, 4.80 cm, was recorded for point T_1120 (Fig. 11), and it is quite unexpected because point T_1120 has almost ideal value of VDOP factor 1.12 (Fig. 7) and 9 visible satellites (Fig. 8) were recorded during observation. Minimum value of height difference was recorded for point T_24, the point with highest values of DOP factors, lowest vertical accuracy and lowest number of visible satellites during observation, what is again quite unexpected.
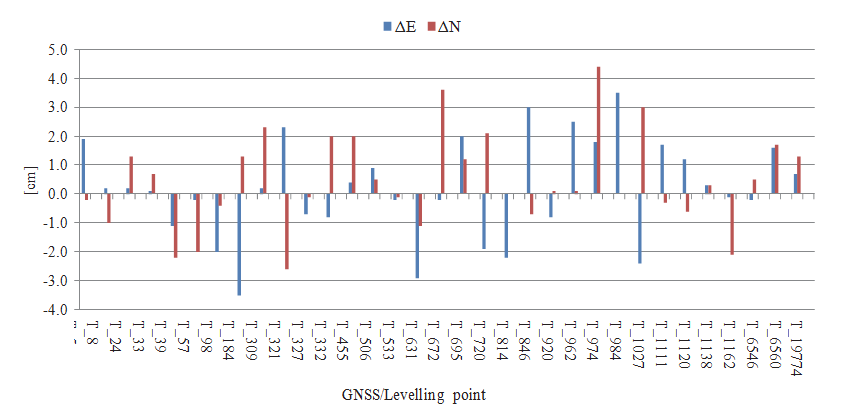
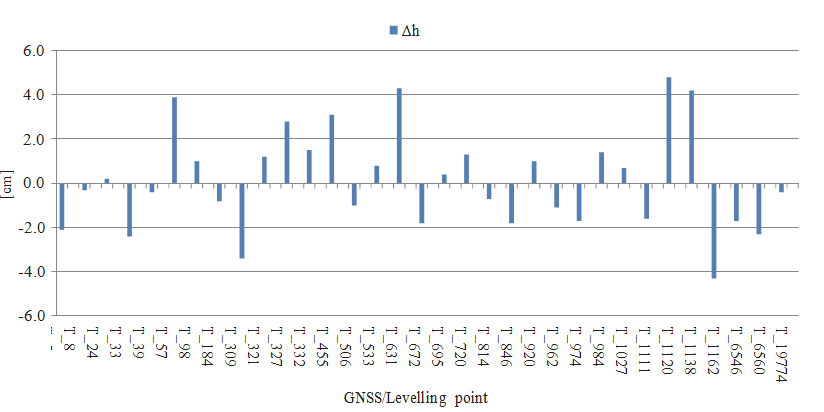
Figures10 and 11 show irregular trend of positive and negative coordinate differences. Interdependence of coordinate differences, weather conditions and time of observations for each point could not be defined from conducted observations. Therefore, the variability of the solutions for the same points was attributed to the random oscillations of network solutions and (unfavorable) constellation of satellites.
6.2. Analysis of the geoid undulations obtained from Croatian official geoid models with undulations obtained by GNSS/levelling
Main goal of this research was the comparison of the geoid undulations from Croatian official geoid models HRG2000 (Bašić, 2001) and HRG2009 (Bašić, 2009) with undulations obtained by GNSS/levelling at 33 established GNSS/levelling points. Statistical indicators of this comparison are showed inTab. 5.
Unexpected maximum of differences occurred for both geoid models, 0.686 meters for HRG2000 and 0.745 meters for HRG2009, and it was recorded at GNSS/levelling point T_327. Analysis of the location of the point T_327 and benchmark used for its establishment (located at the near family house) showed that both, point and benchmark are located within borders of active landslide Kostanjek, so therefore point T_327 was excluded from further analysis. Landslide Kostanjek is the largest active landslide in the Republic of Croatia and it is located at the western part of the City of Zagreb, in residential area at the base of the south western slope of Mtn. Medvednica (1033 m). It was initially activated in 1963, five years after the benchmark was established, but its remediation hasn’t been done until now. Since its activation landslide has caused substantial damage to the buildings and infrastructure (Krkač et al., 2011).
| Statistics | NHRG2000–NGNSS/lev.(HVRS1875) [m] | NHRG2009–NGNSS/lev.(HVRS71) [m] |
| Min. | –0.203 | –0.055 |
| Max. | 0.107 | 0.132 |
| Avg. | 0.001 | 0.030 |
| St. dev. | 0.134 | 0.133 |
Notable decrease of maximum values of differences between undulations for both geoid solutions is apparent after point T_327 was excluded from further analysis (Tab. 6). For HRG2000 maximum was decreased from 68.6 cm to 10.7 cm, and for HRG2009 from 74.5 cm to 13.2 cm. Regardless of the significant decrease of maximum values they are still quite high, especially for the HRG2009 geoid model. Maximum for both geoid solutions was recorded for the GNSS/levelling point T_984, located in urban city area at the altitude of 119.55 m (HVRS71). Analyzing the location of the point T_984 and bench mark used for its establishment (located at the near family house) it was found that there is no knowledge of the sliding surfaces or local impact of geodynamics, and values of DOP factors, number of visible satellites, horizontal and vertical accuracy and difference in height and position between two observations indicated the good quality of performed GNSS observations. Location of the point T_984 and good quality of performed GNSS observations indicate that benchmark used for its establishment is either located at the house that experiences subsidence (in period of 50 years) or has wrong determined altitude, therefore point T_984 was excluded from further analysis. Unexpected minimum of –20.3 cm occurred for HRG2000 geoid solution, and it was recorded for the GNSS/levelling point T_24, point with highest altitude (910.89 m, HVRS71). Minimum of differences for HRG2009 geoid solution of –5.5 cm was also recorded for the point T_24, but in significantly smaller amount and within accepted tolerance limit. Therefore, noticeable difference in the results between HRG2000 and HRG2009 geoid solutions for the point T_24 was attributed to the influence of geodynamics (Pribičević et al., 2007), and the point T_24 was excluded from further analysis. Excluding the point T_24 from further analysis, point T_369 became the point with highest altitude (278.04 m), and range in altitudes of established points decreased for 632.85 m (HVRS71).Figure 12 shows established GNSS/levelling points. Points excluded from further analysis T_327, T_984 and T_24 are colored red.
Table 7 shows statistical indicators of undulation differences for remaining 30 established GNSS/levelling points. In absolute terms, minimum of 0.0 cm for HRG2000 was recorded at the point T_98 (121.55 m, HVRS71), and minimum of 0.0 cm for HR2009 for the point T_506 (121.19 m, HVRS71). Maximum (in absolute terms) of 8.5 cm for HRG2000 was recorded for the points T_309 (278.04 m, HVRS71) and T_321 (225.76 m, HVRS71), and maximum of 5.5 cm for HRG2009 for the point T_533 (118.58 m, HVRS71). Standard deviation of undulation differences based on 30 established GNSS/levelling point is 3.7 cm for HRG2000, and 2.4 cm for HRG2009. Comparison of these values to outer accuracy of Croatian official geoid solutions (9.3 cm for HRG2000;Bašić, 2001 and 3.5 cm for HRG2009Bašić, 2009) shows exceptional reliability of both geoid models at the area of the City of Zagreb.
| Statistics | NHRG2000–NGNSS/lev.(HVRS1875) [m] | NHRG2009–NGNSS/lev.(HVRS71) [m] |
| Min. | –0.085 | –0.029 |
| Max. | 0.044 | 0.055 |
| Avg. | –0.019 | 0.006 |
| St. dev. | 0.037 | 0.024 |
Figures13 and14 give graphical representation of differences between undulations from official geoid solutions (HRG2000 and HRG2009) and undulations obtained by GNSS/levelling points. Red color shows areas with positive values of undulation differences or areas where geoid solution (HRG2000 or HRG2009) gives higher values of undulations than GNSS/levelling ones while respectively blue color shows area with negative values of undulation differences or areas where geoid solution (HRG2000 or HRG2009) gives lower values of undulations than GNSS/levelling. As expected, due to the impact of the masses under the Mtn. Medvednica, negative differences are mainly recorder for the northern upland part and positive differences for the southern lowland part of the City of
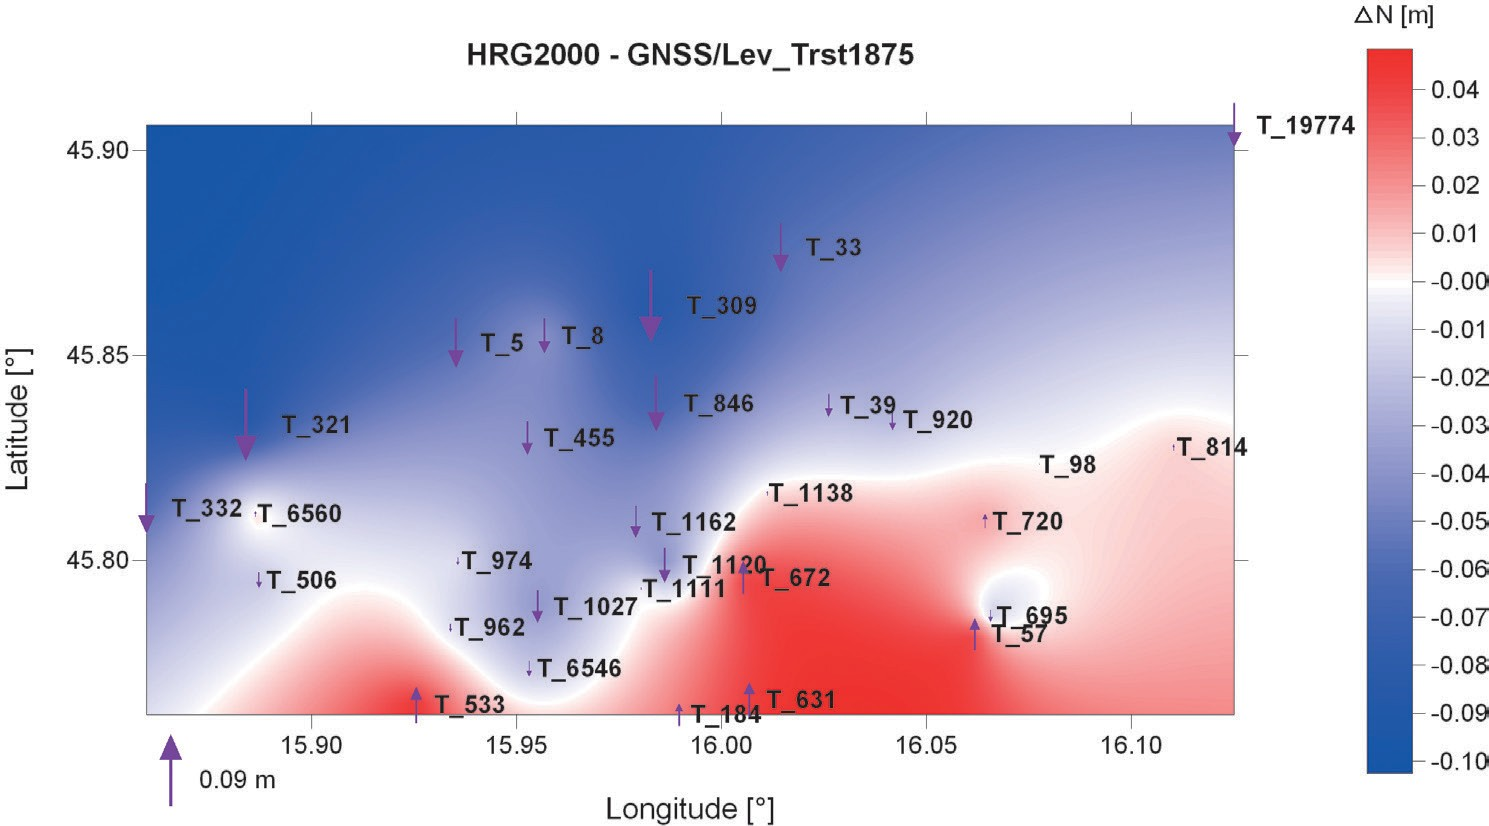
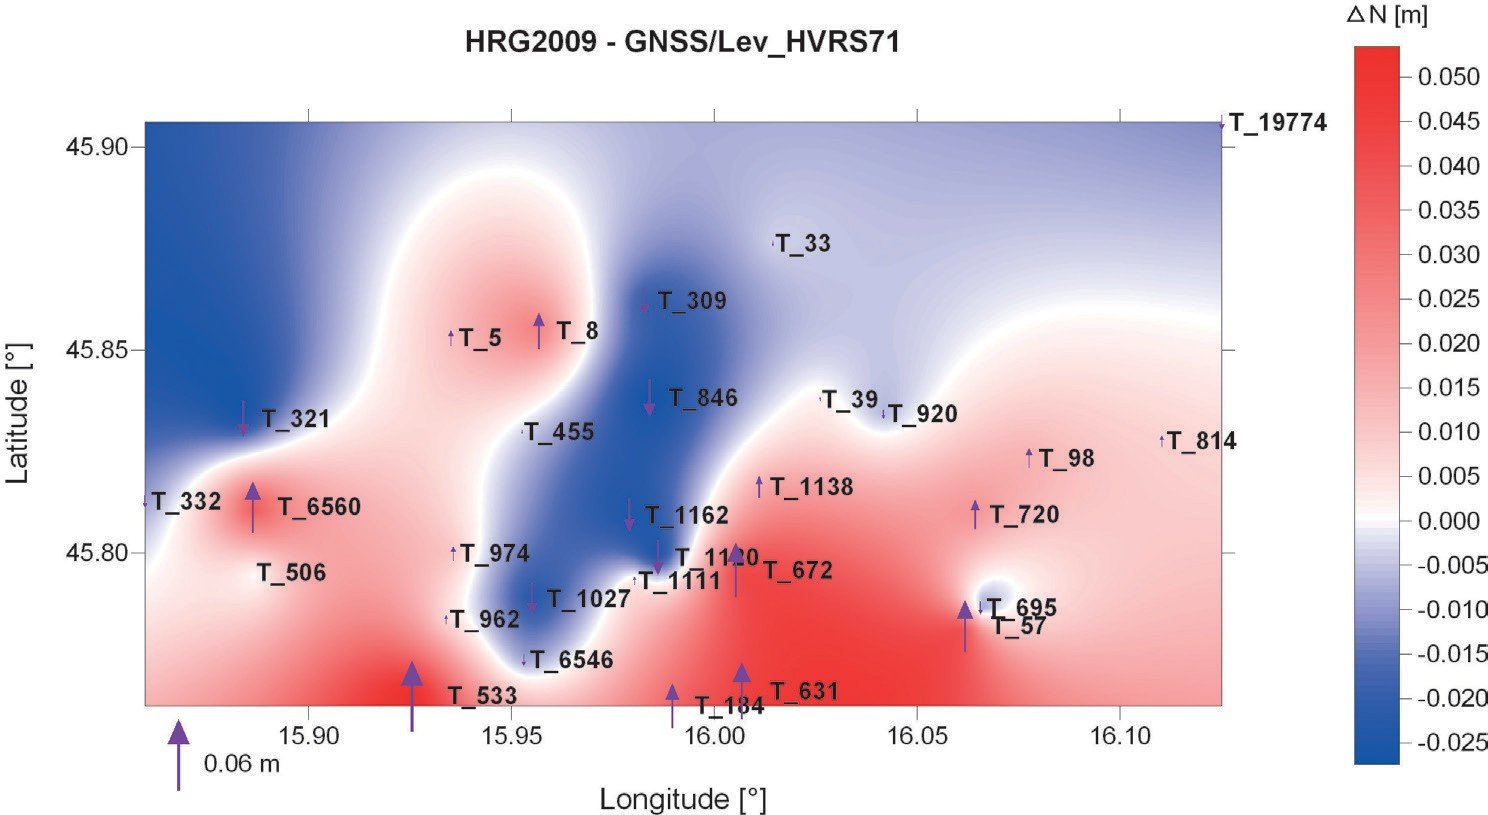
Zagreb. Comparison of Figs.13 and14 shows changes in the distribution of red and blue areas and maximum values of undulation differences between HRG2000 and HRG2009 geoid solutions. Area where HRG2009 geoid solution gives lower values of undulations than GNSS/levelling still covers most of the northern upland part of the City of Zagreb, with exception of points T_5 (256.40 m, HVRS71) and T_8 (253.91 m, HVRS71) where positive differences occurred, and point T_695 (108.38 m, HVRS71) at southeast part of town where negative difference occurred. For HRG2000 geoid solution positive differences were recorded for 10 points, and negative differences for 20 points, while for HRG2009 geoid model positive differences were recorded for 17 points, and negative differences for 13 established GNSS/levelling points. This was attributed to the different datasets and (available) technologies that were used for defining the official geoid solutions.
7. Conclusion
As a result of the research 33 GNSS/levelling points were established at the area of the City of Zagreb, with the purpose of comparison of the geoid undulations from official geoid solutions of the Republic of Croatia (HRG2000 and HRG2009) with undulations obtained by GNSS/levelling for accuracy validation of both geoid solutions. Due to the high level of devastation and bad preservation of the vertical network of the City of Zagreb, initial set of 40 benchmarks planned for the establishment of GNSS/levelling points was extended to a total of 63 benchmarks (29 benchmarks were destroyed, inaccessible or unfound). Established GNSS/Levelling points cover the area with range in altitudes of 802.51 meters (HVRS71), T_695 is the point with lowest altitude (108.38 m) and T_24 point with the highest altitude (910.89 m).
Dilution of precision, number of visible satellites, horizontal and vertical accuracy and difference in height and position between two observations were used as indicators of the quality of performed GNSS observations and they showed good quality of performed observations and extreme reliability of the CROPOS.
Analysis of the differences between undulations from official geoid solutions and undulations obtained by GNSS/levelling showed unexpected maximum for three points T_327 (landslide), T_984 (benchmark that slowly subsides or has wrong determined altitude) and T_24 (geodynamics), therefore they were excluded from further analysis. Standard deviation of absolute values of undulation differences based on 30 established GNSS/levelling point is 3.7 cm for HRG2000 and 2.4 cm for HRG2009 geoid solution. Comparison of these values to outer accuracy of Croatian official geoid solutions (9.3 cm for HRG2000; and 3.5 cm for HRG2009) shows exceptional reliability of both geoid solutions at the area of the City of Zagreb. Main obstacle of these research was high level of devastation of the vertical network of the City of Zagreb, especially at the northern part of town, therefore it is necessary to dedicate more attention to the preservation of the benchmarks in the future. Age of the network of more than fifty years, high level of destruction and lack of coverage of today’s metropolitan area of the City of Zagreb (37%) should be motives for its renewal in near future.

