1. Introduction
At the end of the eighteenth century, a large amount of information had been accumulated in the archives in Portugal, originating from astronomical observations, cartographic documents, hydrographic surveys, which had been used to support the demarcation treaties of Madrid and Santo Idelfonso (1750 and 1777 respectively). Thus, it was possible, for the first time, to trace with reasonable precision, an overview of all lands belonging to the Portuguese Crown, as well as the lands of Spain.
In 1795, the order of the then Minister of the Navy and Overseas Domains, D. Rodrigo de Souza Coutinho was issued to prepare a general map of Brazil, using the best information that had been used in the demarcations, especially those that were represented by “its true latitude and longitude points”. The responsible for the organization was Dr. Antonio Pires da Silva Pontes Leme, with José Joaquim Freire and Manoel Tavares da Fonseca acting as "designers". The astronomer Miguel António Ciera, an Italian engineer who came to Portugal in the middle of the eighteenth century to assist the topographic demarcation of the limits of Portuguese possessions in southern America also assisted in the conference of astronomical observations (Adonias 1945, MJRI 1944,MRE 1960).
However, it appears that the Portuguese concern with the accuracy of terrestrial positions, as well as their cartography began around 1730, through the gathering and use of any and all information that could support the cartographic works to be developed throughout the Colony, listing the reports developed by wilderness explorers (sertanistas), bandeiras (the so-called exploratory expeditions to the interior of Brazil), as well as the cartography elaborated by De Lisle, La Condamine and other cartographers (Cintra 2012). At the same time, the official astronomical and cartographic mission arrived in Brazil: priests Diogo Soares and Domingos Capassi, Jesuits, designated in a special permit by D. João V, King of Portugal, to develop demarcations and precise terrestrial positioning. In 1748, Jean Baptiste Bourguignon d'Anville, one of the main French cartographers, at the service of Portugal, developed the Carte de l'Amérique Méridionale, which was a synthesis of the information existing at the time.Figure 1 shows two maps of d'Anville, existing in the Bibliothèque National de France (BNF) and Fundação Biblioteca Nacional (BNRJ).
Figure 1. Maps of D’Anville, 17?? (BNF) and 1748 (BNRJ), (Source: BNF and BNRJ). / Slika 1. Karte D’Anvillea, 17?? (BNF) i 1748. (BNRJ), (izvor: BNF i BNRJ)
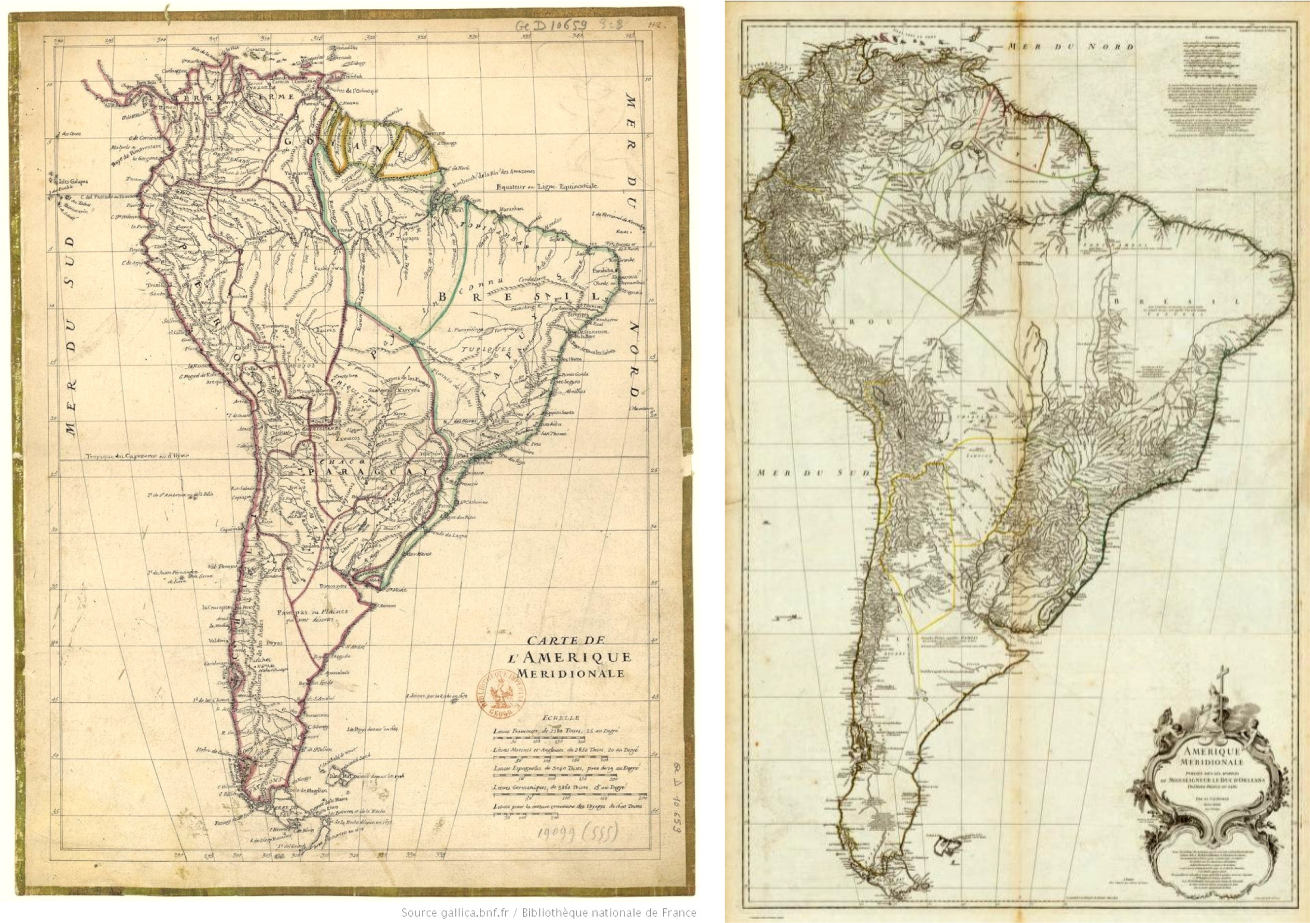
These maps show the graticule and markings of the parallels and meridians, in possibly transverse orthographic or sinusoidal projections. It should be mentioned that the sinusoidal or Sanson-Flamsteed projection was one widely used by the French school. Thus, there was a major advance in relation to accurate knowledge of the territory and cartography.
The Map of the Courts, prepared according to Diogo Soares and Domingos Capassi for the southern regions, the Danville Charter for the Spanish lands of the La Plata Basin, is still drawn on the maps of the Spanish Jesuits of Paraguay. Maps by Gomes Freire de Andrade, for the Central-West and part of the Amazon, and by Charles Marie de La Condamine, a French scientist and explorer, for the Rio Negro valley, made in 1735, also contributed.
In the fifteenth and sixteenth centuries, map projections were used in Europe, showing a graticule with characteristics specific to some projections. They were used in maps such as those of Mercator, Ortelius, Sanson, Blaue, DeLisle, La Condamine, d'Anville and others. However, despite presenting a grid of parallels and meridians, there was no reference to the adopted map projection. It was common to use the Mercator projection, the Ortelius oval projection, stereographic or orthographic azimuthal in global terms, but for more restricted areas, the projection matching the spacing between parallels and meridians was quite common in a Plate Carrée projection or equirectangular. In Portuguese cartography, the representation of the graticule was not common, nor was the marking of longitudes, which, when represented, were over the Equator. Latitudes were represented on most maps. In an implicit way, it is possible to associate most of the projections to the equirectangular projection.
As an example,Figure 2 presents the map of Luiz Teixeira from 1574 and the Map of Cortes, from 1749.
Figure 2. Map of Luis Teixeira and one of the versions for the Mapa das Cortes by an unknown author / Slika 2. Karta Luisa Teixeire i jedna od inačica karte Mapa das Cortes nepoznatog autora
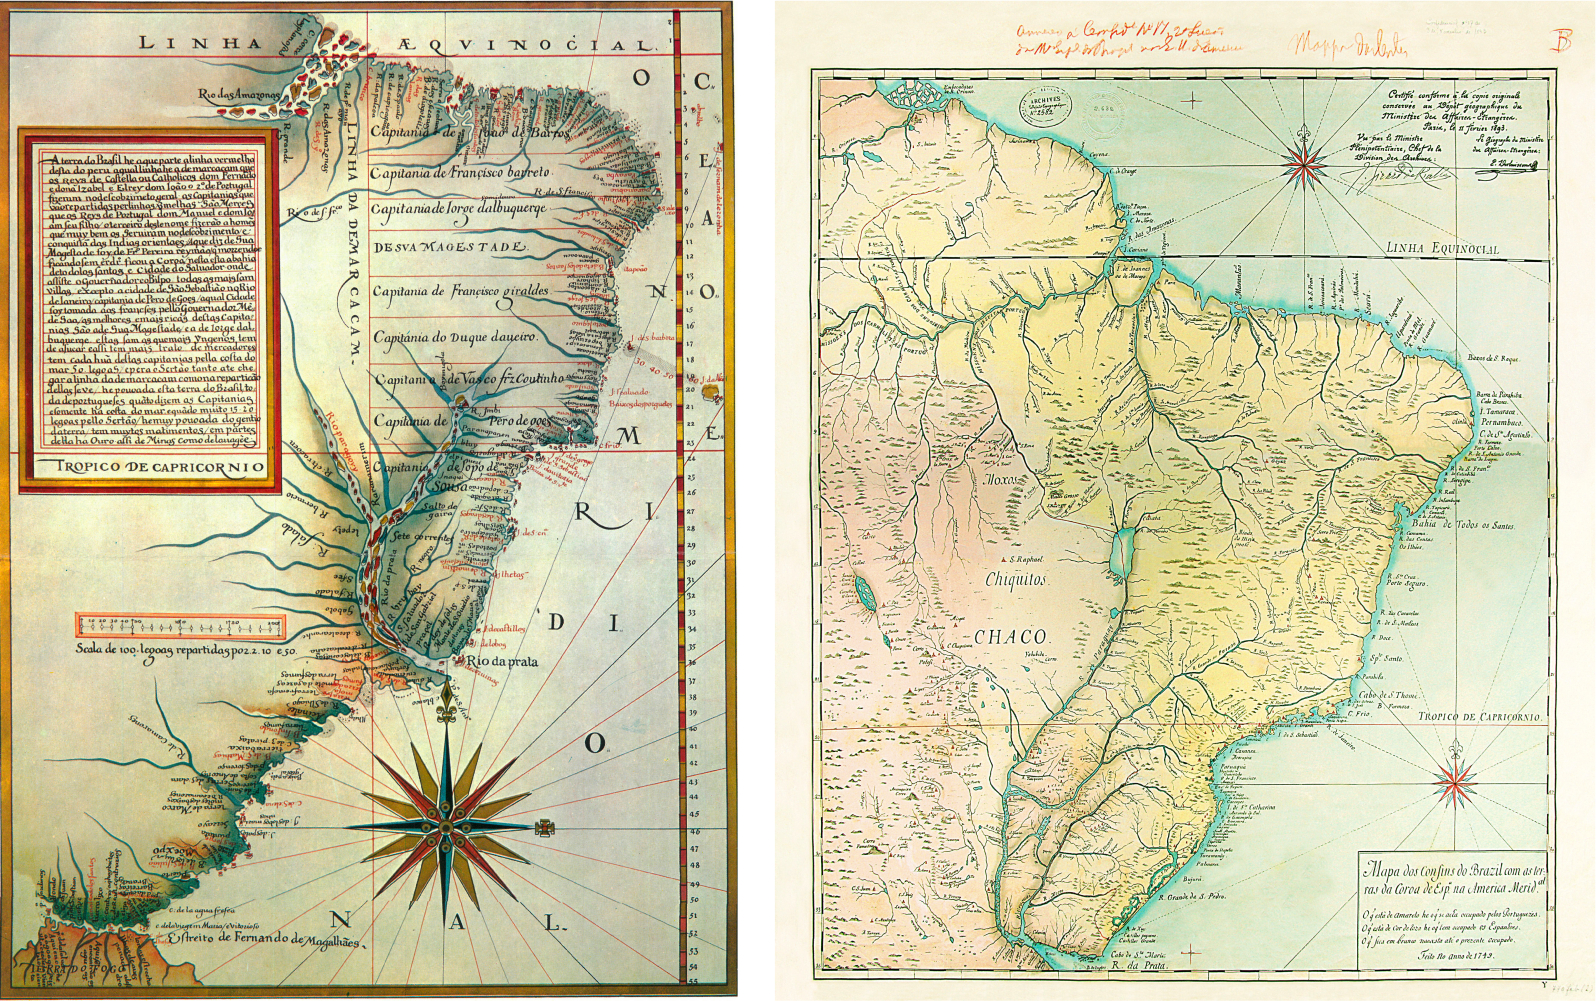
For the work carried out on the versions of the Nova Lusitania map, maps with definite projections were certainly used, which had to be redrawn for the projection attributed to the map.
There are few references to the cartographic process carried out, as well as of the map projection of the versions.Coelho (1950) states that from the words "spherical and orthogonal", "it seems to mean the equivalent projection that in the treaties, is called Sanson-Flamsteed". In addition,Martins (2017) states that this is a Sanson-Flamsteed projection, detailing its properties and referring to the suggestion ofFurtado (1969), concluding that it is an equivalent projection. However, the words spherical and orthogonal also lead to the presupposition of the application of an equatorial orthographic azimuthal projection to the researched maps.
Since there is not a well-founded definition of the real projection used, the objective of this work is to present a precise study of the two possible projections: the Sanson-Flamsteed (sinusoidal) and the transverse orthographic projection applied in the versions of Nova Lusitania, on the 1798 version, thus allowing to establish which projection was really used.
All the work was developed on the digital image, at 300 dpi, provided by Colonel Gouveia Prado, former head of the then 5th Survey Division of the Army Geographic Service.
2. Versions of the Nova Lusitania Map
The first version, dating from 1797, is now part of the collection of the Astronomical Observatory of the University of Coimbra, in the city of the same name in Portugal. This version displays the title Carta Geografica de Projeção Espherica da Nova Lusitania ou America Portuguesa e Estado do Brazil (Geographical Map of the Spherical Projection of New Lusitania or Portuguese America and the State of Brazil, seeFig. 4), and is 142 cm wide and 128 cm high. Pontes Leme had used, according to the inscription on the cartouche, "seventy-six maps" in its making.
It exhibits, in addition to eight graphic scales, three inserts to the left of South America, which show in greater scale three parts of the Brazilian coast, from the current states of Bahia, Rio de Janeiro and Rio Grande do Sul (Corrêa Martins 2011).Figure 3 shows the 1797 version.
Figure 3. Nova Lusitania 1797 version. Astronomic Observatory, Coimbra University, Coimbra, Portugal / Slika 3. Inačica Nove Luzitanije iz 1797. Astronomski opservatorij, Sveučilište Coimbra, Coimbra, Portugal
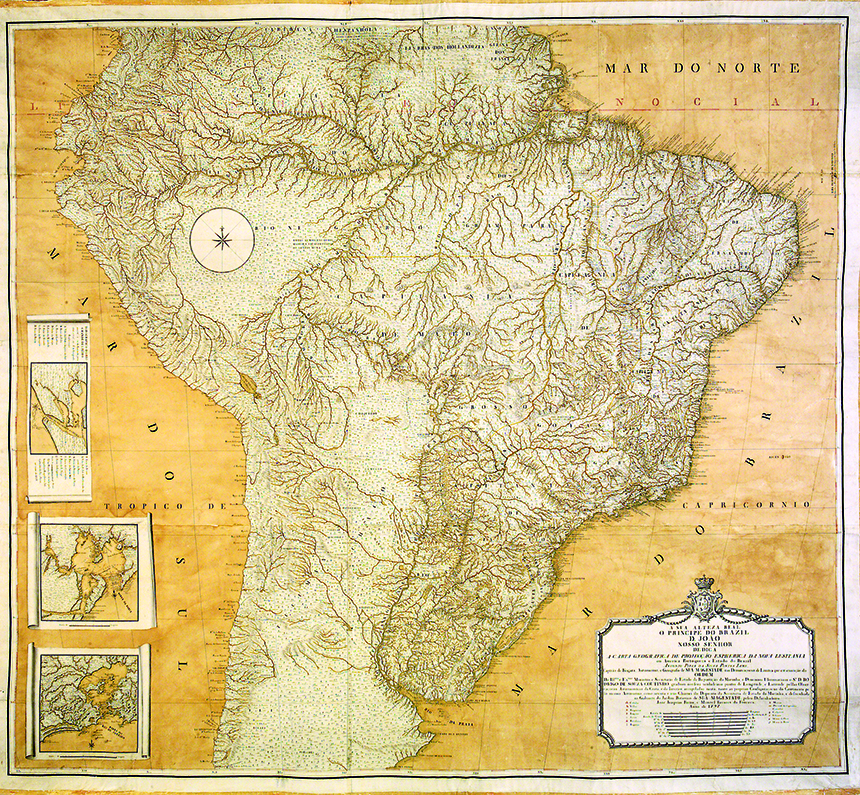
Figure 4. Cartouche from the Nova Lusitania 1797 map. The title of the map reads Carta Geografica de Projeção Espherica da Nova Lusitania ou America Portuguesa e Estado do Brazil / Slika 4. Kartuša s karte Nova Lusitania iz 1797. godine. Naslov karte je Carta Geografica de Projeção Espherica da Nova Lusitania ou America Portuguesa e Estado do Brazil.
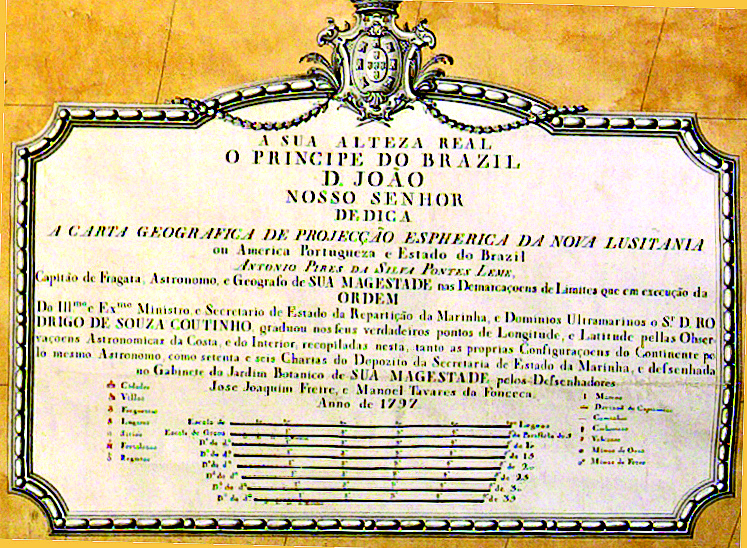
The second version, dating from 1798, is currently in the Map Library of the Brazilian Army Historical Archive (AHEx) in Rio de Janeiro, Brazil, with the title Carta Geografica de Projeção Espherica Orthogonal da Nova Lusitania ou America Portuguesa e Estado do Brazil (Geographical Map of the Spherical Orthogonal Projection of New Lusitania or Portuguese America and the State of Brazil), and is different from the first version. The word Orthogonal was added. It is 148 cm wide by 133 cm high, for which Pontes Leme worked on "eighty-six charts”, ten more than appear in the 1797 version (Corrêa-Martins 2011).
It has nine graphic scales and presents four points along the coast as inserts in detail and properly identified in the current states of Bahia, Pará, Rio Grande do Sul and Rio de Janeiro. This version also lists the names of 34 people, including astronomers, commissioners, and engineers, who contributed with astronomical observations and cartographic works to the making of this map, in addition to the "chorographic maps" from seven captaincies, whose governors were also listed (Corrêa-Martins 2011). The 1798 version can be seen inFigure 5.
Figure 5. The 1798 version. Brazilian Army Historical Archive, AHEx, Rio de Janeiro, Brazil / Slika 5. Inačica iz 1798. godine. Povijesni arhiv brazilske vojske, AHEx, Rio de Janeiro, Brazil
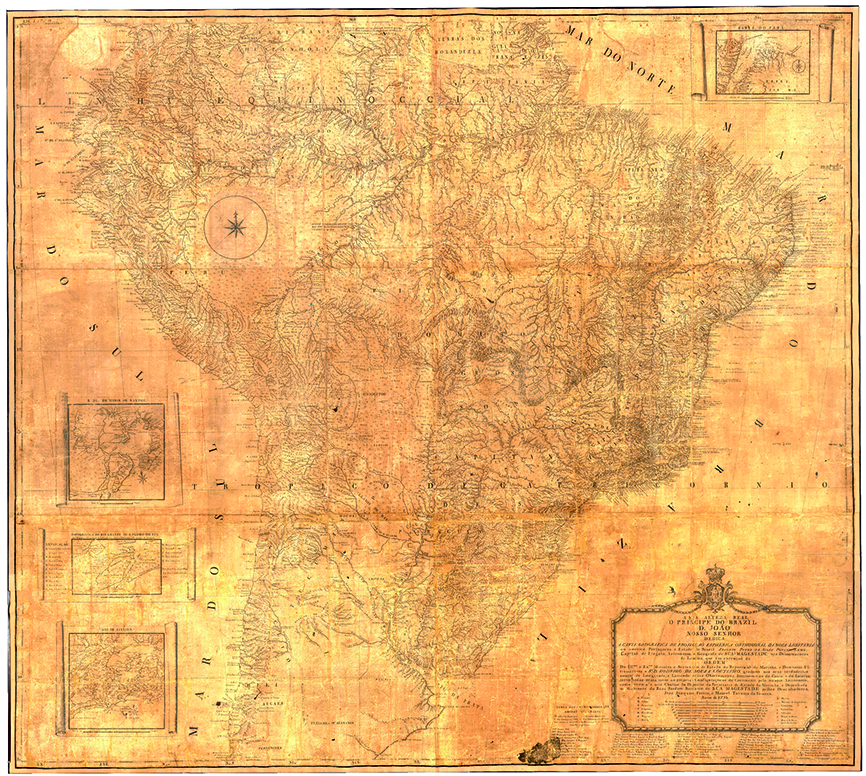
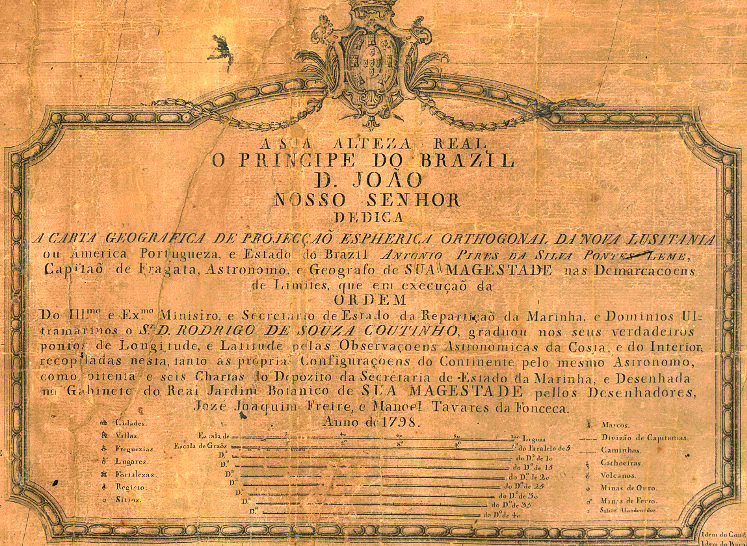
Figure 6. Cartouche from the Nova Lusitania map of 1798. The title of the map reads Carta Geografica de Projeção Espherica Orthogonal da Nova Lusitania ou America Portuguesa e Estado do Brazil / Slika 6. Kartuša na karti Nova Lusitania iz 1798. The title of the map reads Carta Geografica de Projeção Espherica Orthogonal da Nova Lusitania ou America Portuguesa e Estado do Brazil
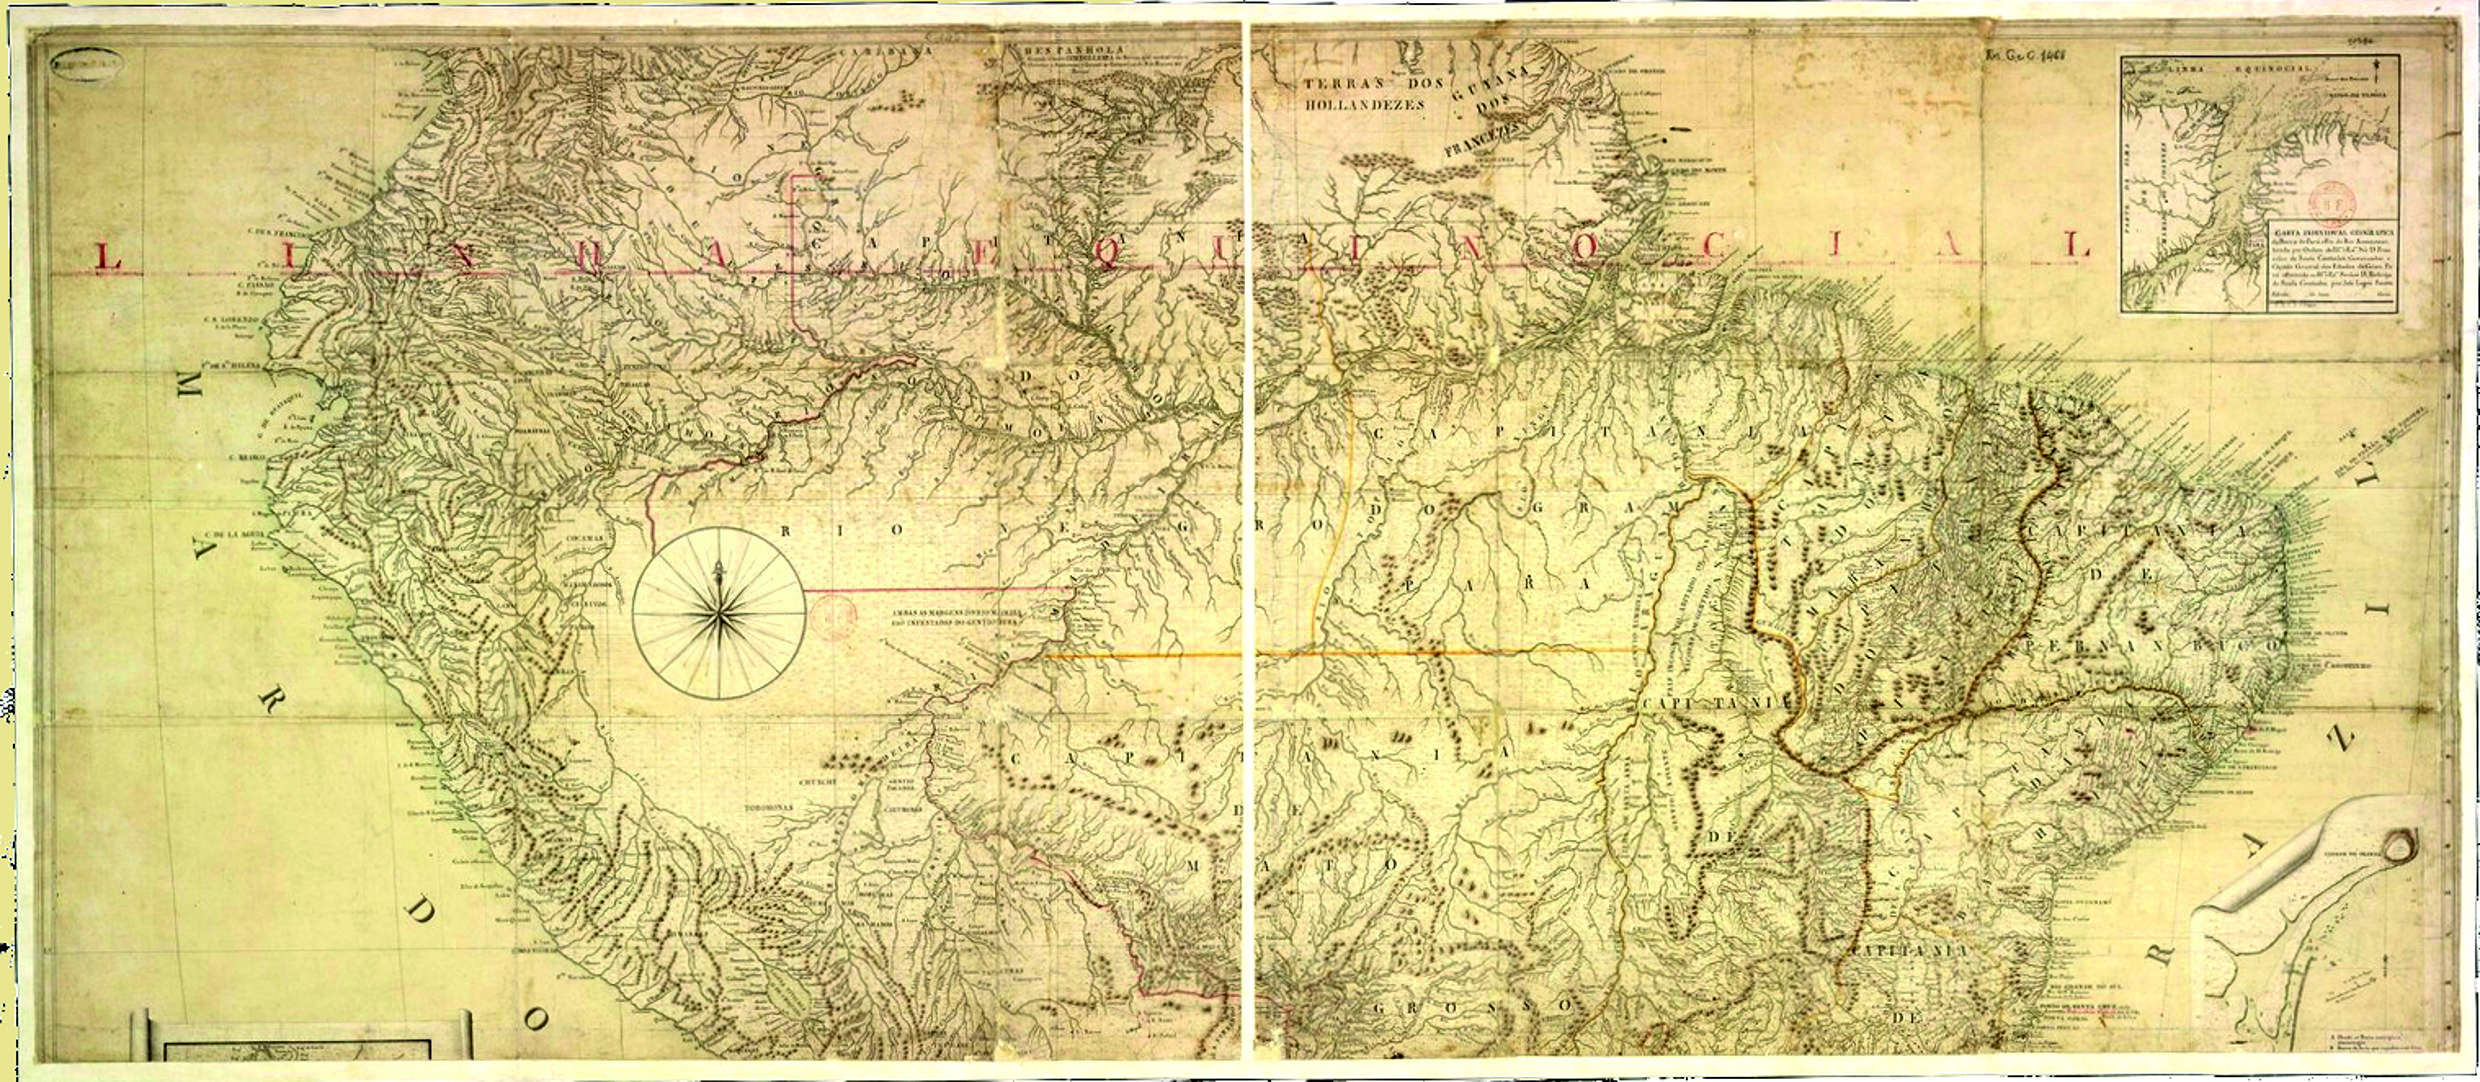
Part of the third version, from 1803, is in the collections of the National Library of France, catalogued as Carte de l'Amérique équinoxiale et du Brésil, and attributed to José Lopes Santo. It consists of two glued sheets, its dimensions are 156 cm wide and 68 cm high. Its identification was made only in 1903, according to the comparison with the map deposited in Brazil (Brazil 1903, p. 94–98). This incomplete copy brings two inserts, one related to the coast of the current State of Pará, and the other of the Pernambuco State, where the city of Olinda is represented (Corrêa Martins 2011).Figure 7 shows the 1803 version.
Figure 7. Nova Lusitania 1803 version. Bibliothèque Nationale de France, BNF, Paris, France / Slika 7. Nova Lusitania, inačica iz 1803. Bibliothèque Nationale de France, BNF, Pariz, Francuska
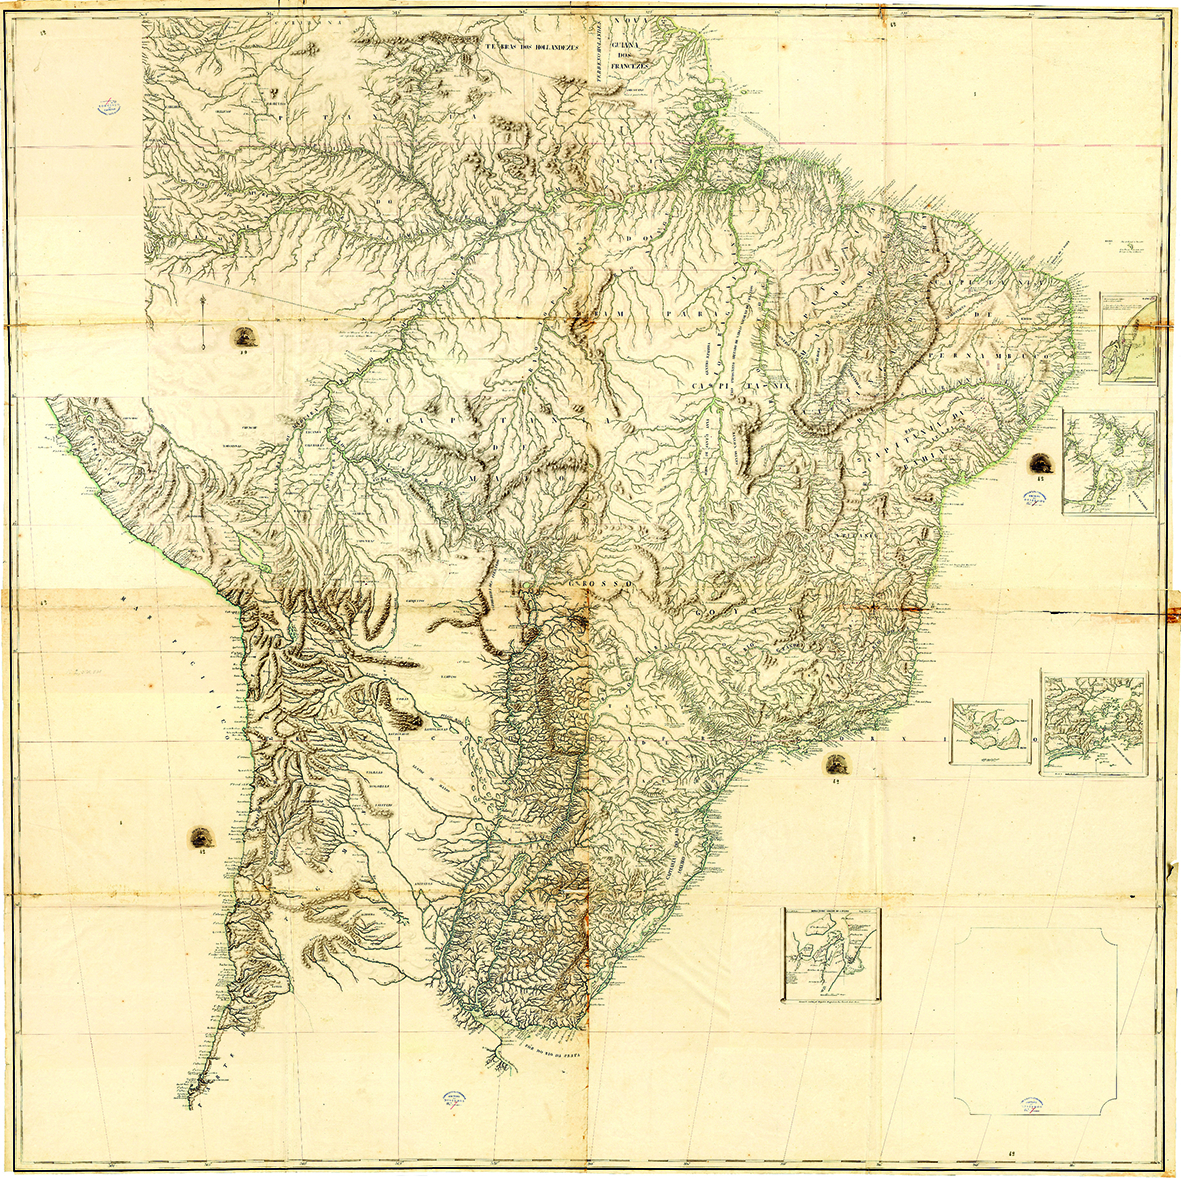
There is also a fourth version, which today is under the custody of the Gabinete de Estudos Arqueológicos da Engenharia Militar, Direcção de Infra-Estruturas do Exército, (Office of Archaeological Studies of Military Engineering, Directorate of Infrastructure of the Army), Lisbon, Portugal. This map has no title and is 202 cm wide and 199 cm high. It has two gaps: one in the upper left corner, with dimensions of five degrees longitudes by ten degrees latitude, and the other in the southern portion of South America, where part of the current Argentine territory is missing. This version has five inserts from coastal regions of the current states of Bahia, Pernambuco, and two from Rio de Janeiro and Rio Grande do Sul (Corrêa Martins 2011).
With no title, its comparison with the known versions of the Nova Lusitania led it to be recognized as one of its versions. However, there are questions about its production date, probably 1794 or 1795, but it is also possible after 1803, which requires further research.Figure 8 presents this fourth version.
Figure 8. Fourth version of the Nova Lusitania. Direcção de Infra-Estruturas do Exército, Lisbon, Portugal / Slika 8. Nova Lusitania, četvrta inačica. Direcção de Infra-Estruturas do Exército, Lisabon, Portugal
3. Description of the 1798 Nova Lusitania Map
3.1. General Characteristics
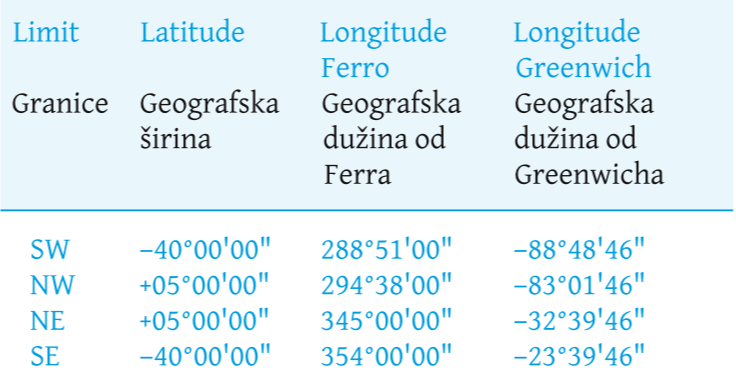
The map has dimensions of 148 × 133 cm, drawn on 6 sheets of paper, glued together. In this example, it is stated that Pontes Leme employed “eighty-six maps” to make this map. The origin meridian defined was the meridian of the Iron Island, Canary Islands. The central meridian of the projection is defined by the meridian 315º from Ferro, Canary Islands, counted in a clockwise direction, that is, from west to east. Considering that the meridian of the Iron Island is located at 20º W from the Paris meridian, and the latter is located at 2°39'14,025" East from the Greenwich meridian, the Iron Island meridian is located at 17°39'45,975" W of Greenwich. This way, the 315° meridian from Ferro corresponds to the meridian 62°39'45,975" W Greenwich, or –62°39'46", or –62,66277°. The map limits can be seen inTable 1.
Table 1. Limits of the 4 corners of the sheet in the Nova Lusitania 1798 version / Tablica 1. Granice četiriju vrhova lista karte Nova Lusitania iz 1798.
3.2. Map Scale
The map does not have a nominal scale. The scale initially assumed for the map was 1:3,865,000, according toCoelho (1950). From this scale all research on the cartographic structure was developed. Subsequently, the calculation according to measurements made on the map pointed to an approximate scale of 1:3,762,000.
The graphic scale is visualized by a set of nine different scales. The first is defined by a scale of 100 leagues, with 5 divisions of 20 leagues each. The rest are scales on parallels of 5 degrees of latitude with 5 divisions to the 1st degree. Graphical scales are shown in the cartouches inFigure 6.
Note that the scales establish that the division of a degree is equal to 20 leagues, which in turn allows to define that the league is the division of a degree into 20 parts (20 to the degree), that is, 5555.00 m, defining an arc of a maximum circle of 1 degree in 111.110 km (Marques 1931).
3.3. The Radius of the Sphere
According to the considerations on the league value, the radius of the projection sphere can be calculated, having obtained the value of 6,366,191.36 m, which was applied to the calculation of the arcs of parallels and meridians used in the analysis methodology.
3.4. Map Projections
3.4.1. Sinusoidal Projection
The sinusoidal projection is an equal-area pseudocylindrical projection, also known, later, as Sanson-Flamsteed. One of the first cartographers to use it was Jean Cossin from Dieppe on a 1570 world map.
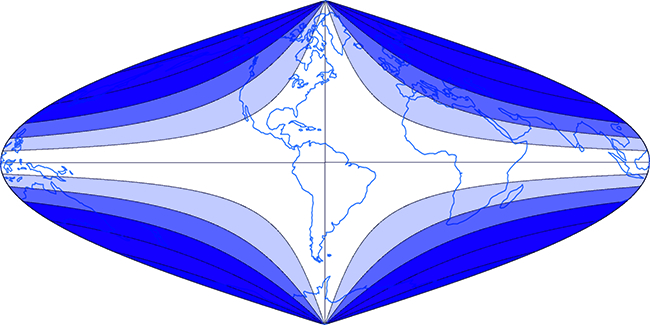
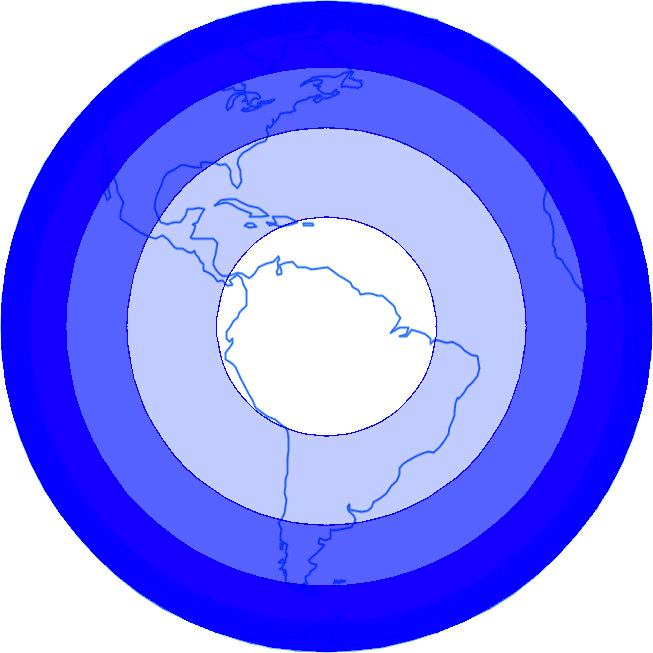
The projection represents the poles as points, parallels as straight lines, and the meridians as sinusoidal curves. Along the Equator and the central meridian there is zero distortion. The y -axis is in the image of the central meridian and the x -axis corresponds to the Equator. The distortion in this projection is a function of longitude and latitude and the greater the distance from the Equator and the central meridian, the greater the distortion. Sinusoidal projection is widely used in thematic maps.Figure 9 shows the appearance of the projection, andFigure 10 the distribution of distortion. The blank area has virtually no distortion.
The equations of this projection are:
x = R(λ - λ0)cosφ (1)
y = Rφ (2)
where R is the radius of the Earth sphere, φ is the latitude, λ the longitude and λ0 is the longitude of the central meridian.
Figure 9. World map on the Sinusoidal or Sanson-Flamsteed projection, with central meridian on the same meridian as Nova Lusitania / Slika 9. Karta svijeta u sinusnoj projekciji sa srednjim meridijanom kao na karti Nova Lusitania.
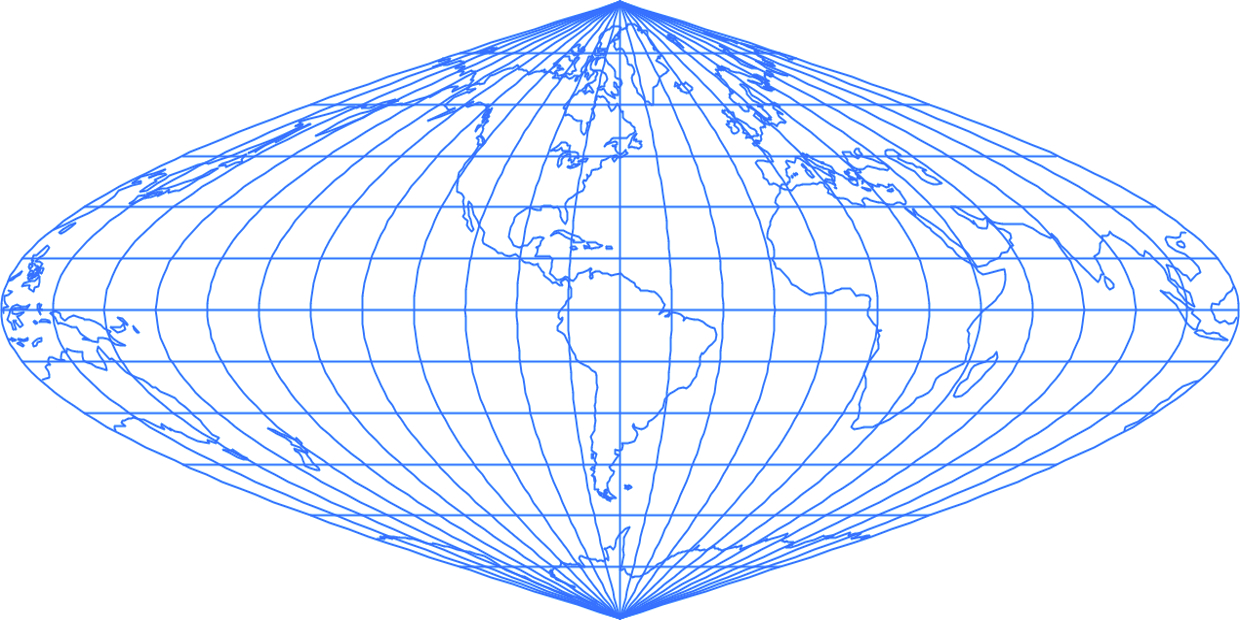
Figure 10. Scheme of the distortion distribution in sinusoidal projection / Slika 10. Shema raspodjele distorzija kutova u sinusnoj projekciji
The actual distance between two points on a meridian can be obtained on the map by the distance between the parallels going through those points.
3.4.2. Transverse Orthographic Projection
The orthographic projection is one of the azimuthal projections, derived for a sphere as a model for the Earth. Known since ancient Greece, it is an orthogonal perspective projection, where the point of view is located at infinity. Thus, all visual radii that emanate from the point of view, passing through the sphere, reach the projection plane orthogonally and are all parallel. It does not preserve angles or areas. In the normal aspect it preserves distances along the parallels. The projection geometry limits the projected area to just one hemisphere or smaller. The interest relies in the equatorial aspect, where the images of parallels are straight segments and the images of meridians, except for the central meridian, which is a straight segment, are semiellipses, up to the limit of the projection, where they form a circle.
The equations of this projection are:
x = R cosφsin(λ - λ0) (3)
y = Rsinφ (4)
where Ris the terrestrial radius, φ and λ, the latitudes and longitudes of each point, respectively, and λ0, the longitude of the central meridian.Figure 11 shows the projection with the central meridian –62°39ʹ45.975ʺ andFigure 12 the angular distortion scheme.
Figure 11. Map of a mehisphere on the transverse orthographic projection / Slika 11. Karta polusfere u poprečnoj ortografskoj projekciji
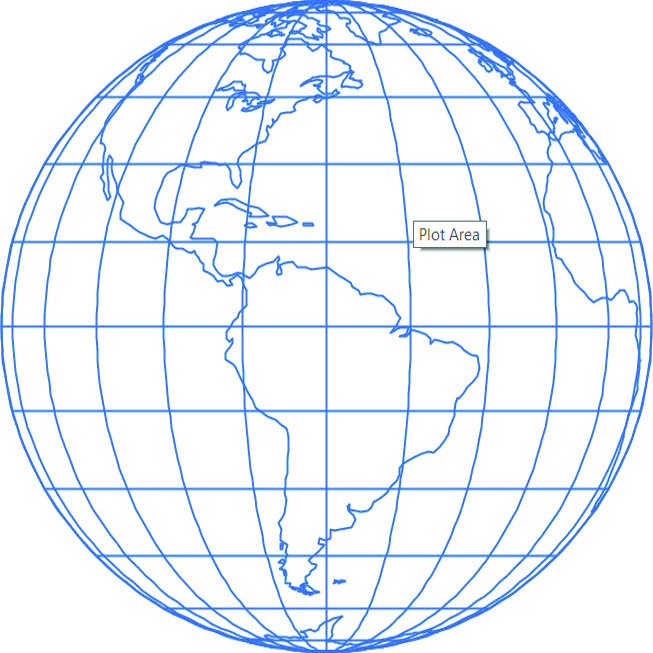
Figure 12. Scheme of the angular distortion distribution on transverse orthographic projection / Slika 12. Shema raspodjele distorzija kutova u poprečnoj ortografskoj projekciji
4. Methodological Analysis
The methodological analysis was developed according to the following topics:
Considerations about the two projections and possible application on the Nova Lusitania map.
Georeferencing of the Nova Lusitania map on the two projections, to verify their behaviour.
Calculation of the parallel and meridian arcs in the two projections, in their original size.
Measurement and calculation of the meridian and parallel arcs of the map, along the central meridian, the Equator and parallels. In this case, only the arcs to the east of the central meridian were measured.
4.1. Considerations on the Application of Map Projections
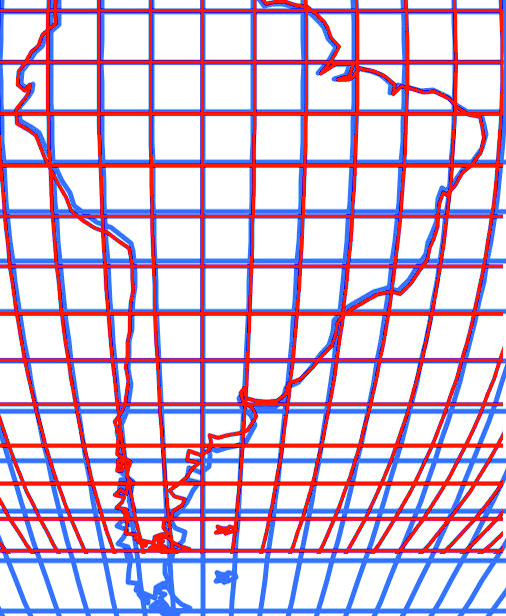
Both map projections could have been applied. In terms of linear distortions, the sinusoidal projection has advantages over the azimuth projection. However, due to the framing area of the Nova Lusitania map area, the distortion of one or another projection would not be significant. The superposition of the two projections shows the preservation of the main scale along the Equator and the central meridian. In the sinusoidal projection, the spacing of the parallels is equal. In the azimuthal projection, along these same axes, the spacing would decrease, due to the distortion characteristic of the projection, as can be seen inFigure 13.
Figure 13. Overlap of maps of the same area made in two projections with coincidence on the central meridian and the Equator. The sinusoidal projection is in blue, the transverse orthographic in red. / Slika 13. Preklop karata istog područja izrađenih u dvjema projekcijama uz podudaranje na srednjem meridijanu i ekvatoru. Plavom bojom prikazana je sinusna projekcija, a crevnom poprečna ortografska.
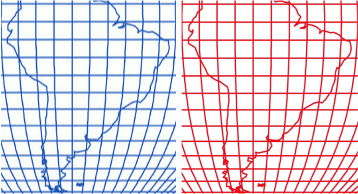
However, the appearance of both maps is remarkably similar, as can be seen inFigure 14.
Figure 14. Appearance of the Nova Lusitania map area, in the sinusoidal (blue) and transverse orthographic projections (red) / Slika 14. Izgled područja karte Nova Lusitânia u sinusnoj (plavo) i poprečnoj ortografskoj projekciji (crveno).
4.2. Georeferencing the Nova Lusitania map
Creation of a sinusoidal projection and a transverse orthographic projection, on the meridian corresponding to the –315 ° meridian of Ferro, relative to the Greenwich meridian –62°39'45,975", or 62°39'45,975" West of Greenwich
Transformation of the projection of two files: “ne_10m_admin_0_countries” and “ne_10m_populated_places_BRC”, (Natural Earth 2019), corresponding to countries and cities, for both projections.
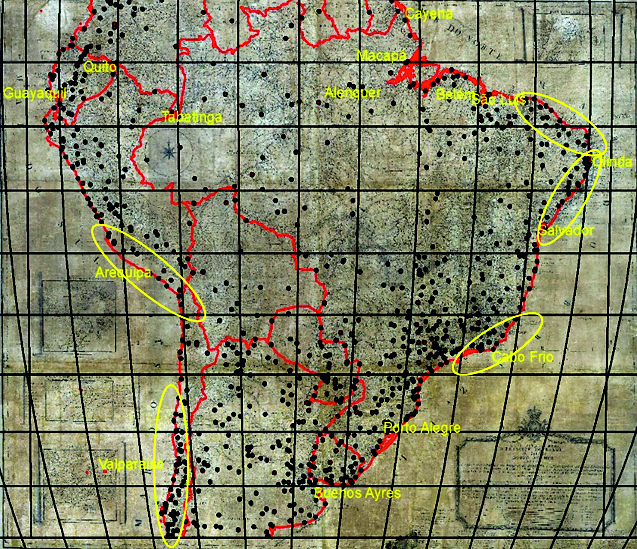
Georeferencing through the same list of cities and geographic features: Salvador, Olinda, Porto Alegre, Buenos Aires (ARG), Guayaquil (ECU), Cabo Frio, São Luis, Belém, Alenquer, Tabatinga, Quito (ECU), Arequipa (PER), Valparaiso (CHI), Cayena (GUF) and Macapá, in order to allow better adjustment.
After the analyses were carried out, it was noted that both projections presented a very similar georeferencing. There was not enough time to quantify the differences with adequate precision, but the visual analysis and with an approximate study, it was found that both projections had the same distortion characteristics in the same locations, mainly due to the longitude differences that must have occurred in the compilation for the elaboration of the map.
Figures 15 and16 show the result of georeferencing. The areas marked by yellow, represent areas that were not close to their real positions. The conclusion reached is that the similarity that exists between these two projections will characterize a similar behaviour in the process of adjusting the georeferencing.
Figure 15. Areas that presented positioning residuals in the georeferencing in the sinusoidal projection / Slika 15. Područja koja prikazuju položajna odstupanja pri georeferenciranju u sinusnoj projekciji
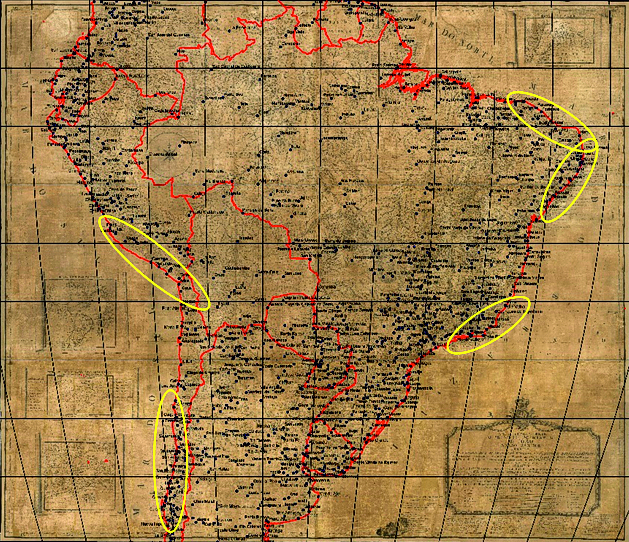
Figure 16. Areas that presented positioning differences in the georeferencing in the orthographic equatorial azimuthal projection / Slika 16. Područja koja prikazuju položajna odstupanja pri georeferenciranju u poprečnoj ortografskoj projekciji
4.3. Calculation of Meridian and Parallel Arcs
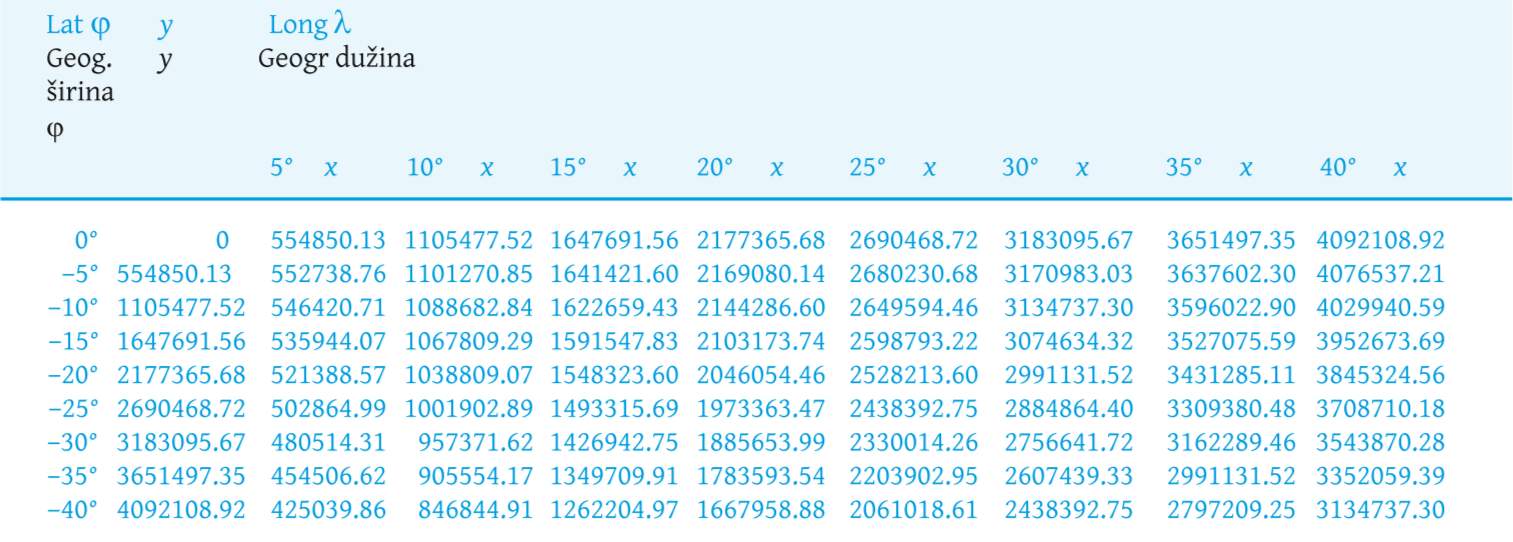
Initially, the meridian arcs along the central meridian and parallel arcs were calculated from the central meridian, with a spacing of 5° in latitude and 5° in longitude between them, for each of the projections. The result can be seen inTables 2 and3.
Table 2. Values for the meridian arcs along the central meridian and parallel arcs along the Equator and parallels, starting from the central meridian in metres, for the sinusoidal projection. / Tablica 2. Vrijednosti duljina lukova meridijana uzduž srednjeg meridijana i lukova paralela uzduž ekvatora i paralela, počevši od srednjeg meridijana u metrima, za sinusnu projekciju
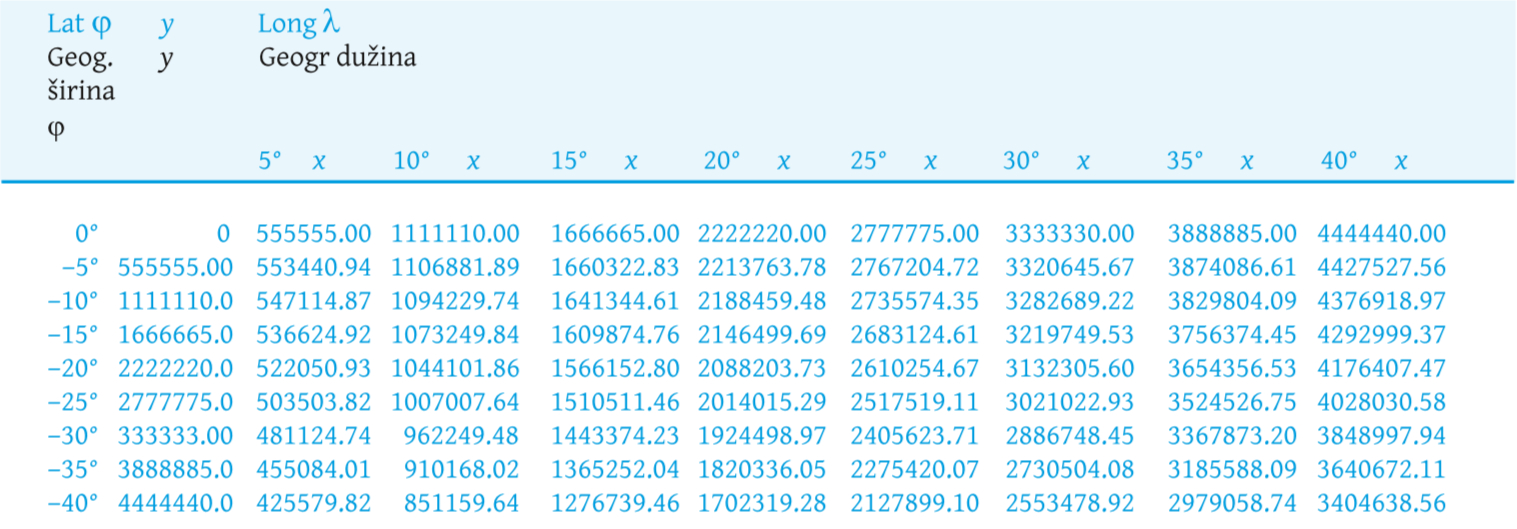
Table 3. Values for the meridian arcs along the central meridian and parallel arcs along the Equator and parallels, starting from the central meridian, in metres for the transverse orthographic projection. / Tablica 3. Vrijednosti duljina lukova meridijana uzduž srednjeg meridijana i lukova paralela uzduž ekvatora i paralela, počevši od srednjeg meridijana, u metrima za poprečnu ortografsku projekciju.
It should also be considered that the longitudinal spacing of 5 degrees corresponds to the meridians of 320°, 325°, 330°, 335°, 340°, 345°, 350° and 355°, in relation to the Ferro Island. These values will be comparative values to those extracted from the Nova Lusitania map.
5. Results
5.1. Values measured and calculated on the Nova Lusitania map, 1798 version
At this time, the dimensions of the map were also measured, according to the digital file worked on. The file was digitized with a resolution of 300 dpi and the dimensions considered were the total file, paper dimensions and the map dimensions, defined by its internal limits. The result can be seen inTable 4.
Table 4. Dimensions of the Nova Lusitania map. / Tablica 4. Dimenzije karte Nova Lusitania

The measurements and calculation of the meridian and parallel arcs were then performed. For this, the AutoCAD Map 2020 software was used, which allows a measurement up to one hundredth of a millimetre, which is entirely unnecessary precision for the work needs of this paper. However, these decimal values were left and only rounded at the end of the calculation. Each value was multiplied by the number of the scale determined for the map, that is, by the value of 3,761,995.888.
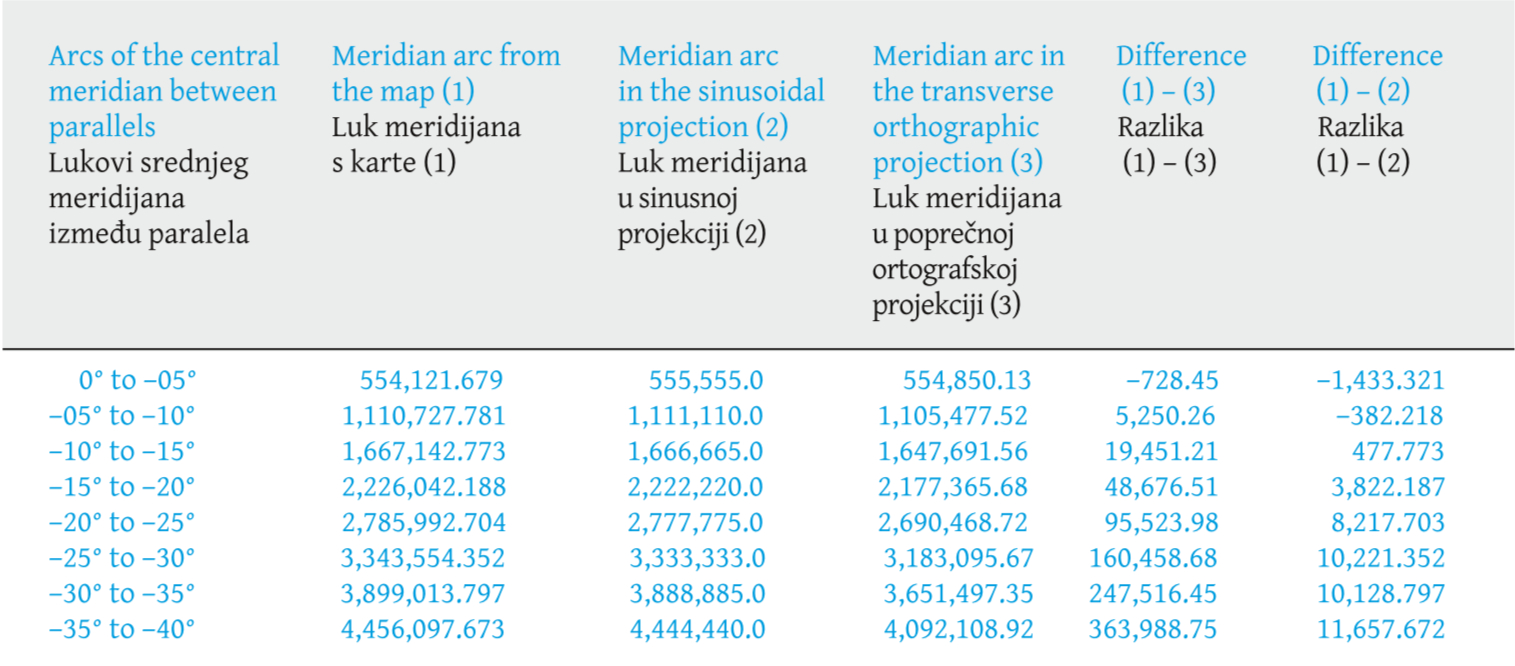
Table 5 shows the values related to the measurements taken of the meridian arcs along the central meridian. Column 2 shows the values measured in centimetres on the map. Column 3 contains the values transformed by the scale in land units and column 4, the values of each meridian arc, from the Equator at each latitude indicated to the right of the first column.
Table 5. Measurements and calculation of meridian and parallel arcs. / Tablica 5. Mjerenja lukova srednjeg meridijana između paralela
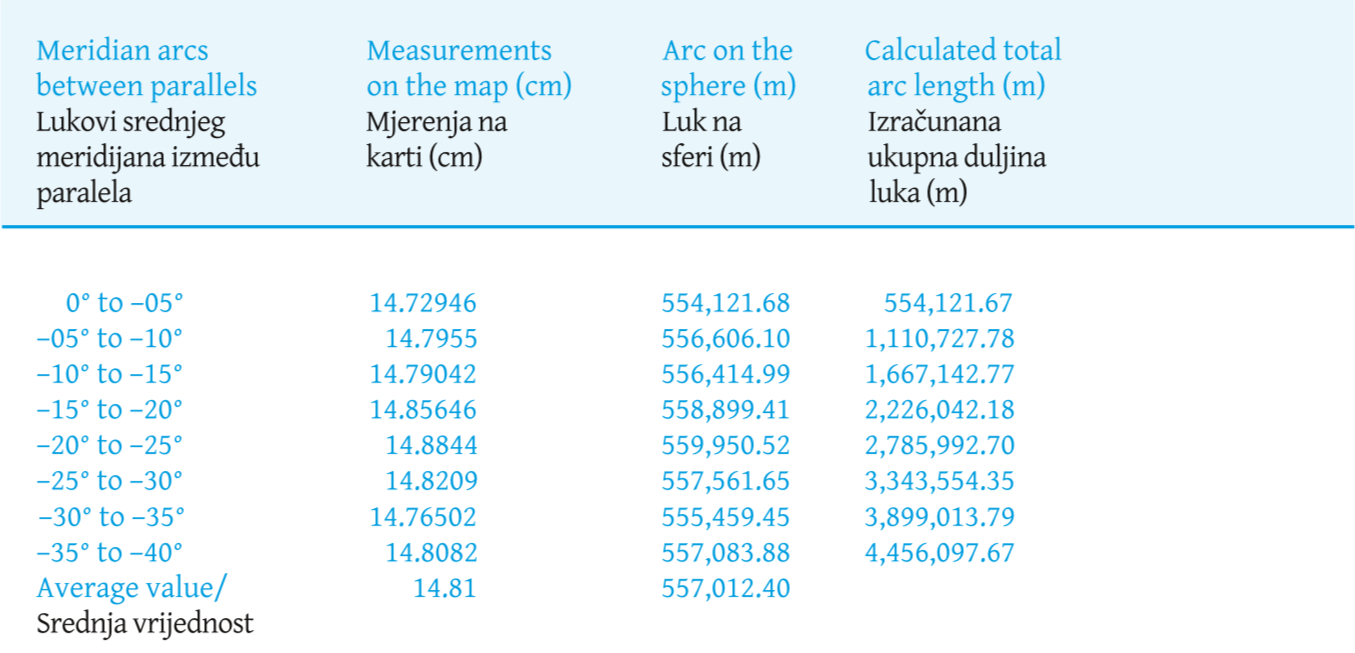
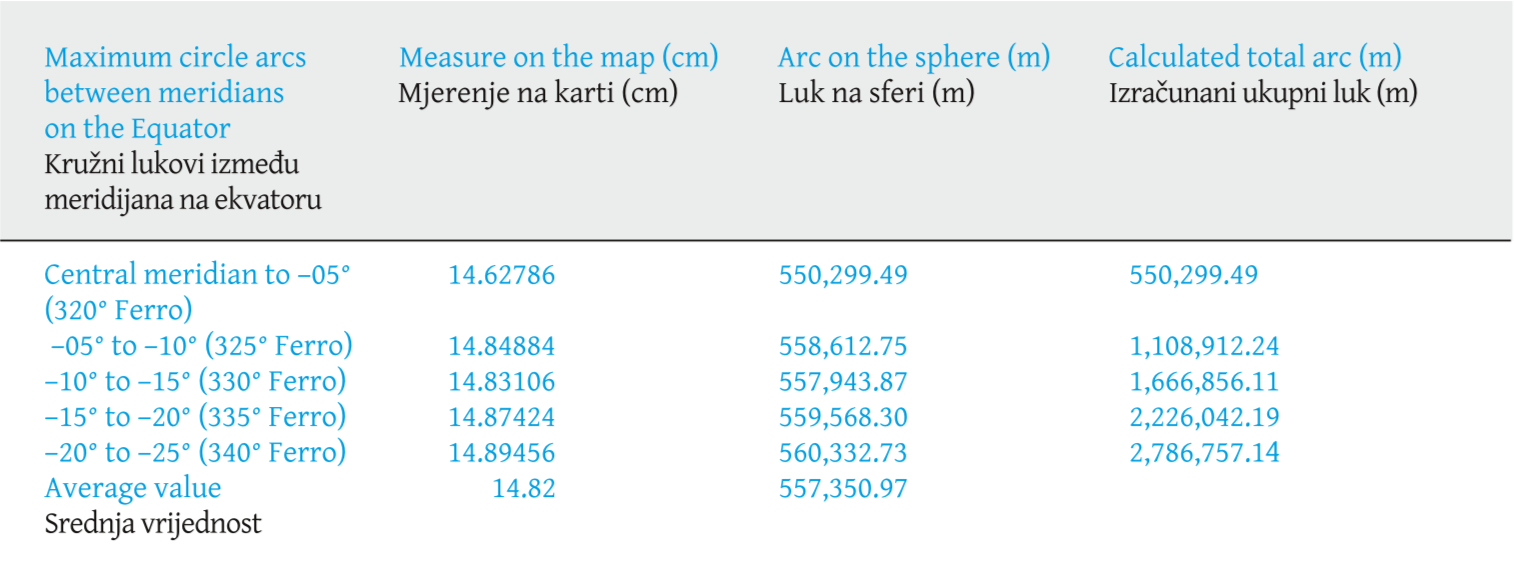
Table 6 shows the values related to the measurements taken of the parallel arcs along the Equator. Column 2 shows the values measured in centimetres on the map. Column 3 contains the values transformed by the scale in land units and column 4, the values of each meridian arc, from the Equator at each latitude indicated to the right of the first column.
Table 6. Measurements of parallel arcs across the Equator / Tablica 6. Mjerenja lukova paralela uzduž ekvatora
In the next step, the difference between the measured and calculated values for each of the projections was calculated , which can be seen inTable 7.
Table 7. Difference between the measured and calculated values for each of the projections. / Tablica 7. Razlika između izmjerenih i izračunanih vrijednosti za svaku od projekcija.
5.2. Results
What is observed, however, instead of decreasing lengths, is an increase in the differences between the arcs, characterizing an absence of the orthographic projection pattern. In a similar way, the lengths of practically all the meridian and parallel arcs were compared along the central meridian and the Equator, reaching a similar result.
The behaviour for the sinusoidal projection is a constant difference between the meridian and parallel arcs, along the Equator and the central meridian. For the other positions, it is quite close, since practically all of South America represented on the map is located in an area of minimal distortion.
The difference values between the measured and computed values for the sinusoidal projection are apparently high, especially the last ones, over 10,000 meters. However, in the considered scale, these values have a displacement of around 2mm. Taking paper deformations into account, these values are irrelevant. This way, it can be said that the measured values are consistent with the values on a sinusoidal projection. The calculations on the other parallels and meridians behaved similarly.
6. Conclusions
Of the four versions of the Nova Lusitania map, only the first two have a title. The title of the first map from 1797 is Carta Geografica de Projeção Espherica da Nova Lusitania ou America Portuguesa e Estado do Brazil, while the title of the second version from 1798 is Carta Geografica de Projeção Espherica Orthogonal da Nova Lusitania ou America Portuguesa e Estado do Brazil. The difference is only in one word Orthogonal. All the remaining text in the map cartouches is identical, except for the year 1797 and 1798, respectively.
Also note that sin x ≈ x for small values of x. Therefore, if the values of φ and λ - λ0 are small, then the equations (3) and (4) of the transverse orthographic projection pass into the equations (1) and (2) of the sinusoidal projection. In other words, the smaller the values of φ and λ - λ0, the less the transverse orthographic and sinusoidal projections differ from each other.
With this work, a solid basis is presented to affirm and prove that the map projection adopted for the Nova Lusitania map was the sinusoidal projection. This confirmation brings scientific proof of the use of this map projection by Portuguese cartographers. Furthermore, it undoubtedly shows a very deep influence of the French cartographic school of that time.
Regarding the four map versions, alt hough the applied methodology has not been verified, the appearance, in principle, shows that the same map projection was used, with only a variation in scale, due to the dimensions of each one.
1. Uvod
Krajem 18. stoljeća u arhivima u Portugalu nakupila se velika količina podataka koja potječe iz astronomskih promatranja, kartografskih dokumenata i hidrografskih istraživanja koja su korištena za potporu ugovorima o razgraničenju iz Madrida i Santo Idelfonsa (1750 i 1777). Tako je prvi put bilo moguće s odgovarajućom preciznošću dobiti pregled svih zemalja koje pripadaju portugalskoj kruni, kao i onih kruni Španjolske.
Godine 1795. izdana je naredba tadašnjeg ministra mornarice i prekomorskih područja D. Rodriga de Souze Coutinha da se pripremi opća karta Brazila koristeći najbolje informacije upotrijebljene u razgraničenjima, posebno one koje su prikazane „svojim pravim geografskim širinama i dužinama“. Odgovoran za organizaciju bio je dr. Antonio Pires da Silva Pontes Leme, a José Joaquim Freire i Manoel Tavares da Fonseca bili su „dizajneri". Astronom Miguel António Ciera, talijanski inženjer koji je sredinom osamnaestog stoljeća došao u Portugal kako bi pomogao topografskom razgraničenju granica portugalskih posjeda u Južnoj Americi, također je pomagao u konzultacijama o astronomskim opažanjima (Adonias 1945, MJRI 1944,MRE 1960).
Međutim, čini se da je portugalska zabrinutost za točnost zemaljskih položaja, kao i njihova kartografija, započela oko 1730. godine prikupljanjem i upotrebom svih podataka koji bi mogli podržati kartografske radove koji će se razvijati u čitavoj koloniji navodeći popis izvještaja koje su razvili istraživači divljine (sertanistas), bandeiras (tzv. istraživačke ekspedicije u unutrašnjost Brazila), kao i kartografija koju su razvili De Lisle, La Condamine i drugi kartografi (Cintra 2012). Istodobno, službena astronomska i kartografska misija stigla je u Brazil. Bili su to svećenici Diogo Soares i Domingos Capassi, isusovci koje je posebnom dozvolom odredio D. João V, portugalski kralj, za određivanje razgraničenja i precizno pozicioniranje na Zemlji. Godine 1748. Jean Baptiste Bourguignon d'Anville, jedan od glavnih francuskih kartografa u službi Portugala, izradio je Carte de l'Amérique Méridionale koja je bila sinteza postojećih informacija. Naslici 1 prikazane su dvije karte d'Anvillea koje se čuvaju u Bibliothèque National de France (BNF) i Fundação Biblioteca Nacional (BNRJ).
Te karte prikazuju mrežu i oznake paralela i meridijana u poprečnoj ortografskoj ili sinusnoj projekciji. Treba spomenuti da je sinusna ili Sanson-Flamsteedova projekcija bila široko upotrebljavana u francuskoj kartografiji. Dakle, došlo je do velikog napretka s obzirom na točnije poznavanje teritorija i kartografije.
Spomenimo još Map of the Courts, pripremljenu prema Diogu Soaresu i Domingosu Capassiu za južne regije, Danvilleovu povelju za španjolske zemlje bazena La Plate koja je još uvijek iscrtana na kartama španjolskih isusovaca u Paragvaju, zatim karte Gomesa Freire de Andrade za Srednji zapad i dio Amazone te Charlesa Marie de La Condaminea, francuskog znanstvenika i istraživača za dolinu Rio Negra iz 1735. godine.
U petnaestom i šesnaestom stoljeću u Europi su se koristile kartografske projekcije pokazujući mrežu paralela i meridijana karakterističnima za neke projekcije. Koristili su ih Mercator, Ortelius, Sanson, Blaue, DeLisle, La Condamine, d'Anville i drugi. Međutim, čak i prikazujući mrežu paralela i meridijana, nije bilo reference na usvojenu kartografsku projekciju. Uobičajeno je bilo upotrebljavati Mercatorovu projekciju, Orteliusovu ovalnu projekciju, stereografsku ili ortografsku azimutnu, u globalnom smislu, ali za ograničenija područja bila je prilično česta projekcija Plate Carrée ili jednostavna ekvidistantna cilindrična. U portugalskoj kartografiji prikaz mreže paralela i meridijana nije bio uobičajen, kao ni označavanje geografskih dužina, koje su, kad su bile prikazane, bile iznad ekvatora. Geografske su širine prikazivane na većini karata. Na implicitan je način moguće većini projekcija pridružiti jednostavnu ekvidistantnu cilindričnu projekciju.
Kao primjer,slika 2 prikazuje kartu Luiza Teixeire iz 1574. i kartu Cortesa iz 1749.
Za rad na inačicama karte Nova Lusitania zasigurno su korištene karte s određenim projekcijama koje je trebalo precrtati za projekciju koja se pripisuje karti.
Malo je referenci o provedenom kartografskom postupku, kao i na kartografsku projekciju inačica te karte.Coelho (1950) navodi da se prema riječima „sferna i ortogonalna“, „čini da znači ekvivalentnu projekciju koja se u ugovorima naziva Sanson-Flamsteedova“. Osim togaMartins (2017) navodi da je riječ o Sanson-Flamsteedovoj projekciji te iznoseći detaljno njezina svojstva i pozivajući se na sugestijuFurtada (1969), zaključuje da je to ekvivalentna projekcija. Međutim, riječi „sferna i ortogonalna“, također dovode do pretpostavke primjene poprečne ortografske projekcije na istražene karte.
Budući da ne postoji utemeljena tvrdnja o stvarno upotrijebljenoj projekciji, cilj je ovoga rada prikazati preciznu studiju dviju mogućih projekcija: sinusne i poprečne ortografske projekcije primijenjene u inačicama karte Nova Lusitania, na inačici iz 1798., omogućujući tako utvrditi koja se projekcija stvarno koristila. Cijeli je rad obavljen na digitalnoj slici u rezoluciji 300 dpi, a omogućio ga je pukovnik Gouveia Prado, bivši šef tadašnjeg 5. Geodetskog odjela Vojne geografske službe.
2. Inačice karte Nova Lusitania
Prva inačica, koja datira iz 1797. godine, sada je dio zbirke Astronomskog opservatorija Sveučilišta Coimbra u istoimenom gradu u Portugalu. Ta inačica ima naslov Carta Geografica de Projeção Espherica da Nova Lusitania ou America Portuguesa e Estado do Brazil (Geografska karta sferne projekcije Nove Luzitanije ili Portugalske Amerike i države Brazil,slika 4), široka je 142 cm i visoka 128 cm, a Pontes Leme upotrijebio je, prema opisu u kartuši, „sedamdeset i šest karata“ pri njezinoj izradi.
Na karti su uz osam grafičkih mjerila tri umetka (lijevo od Južne Amerike) koji u krupnijem mjerilu prikazuju tri dijela brazilske obale, današnjih država Bahia, Rio de Janeiro i Rio Grande do Sul (Corrêa Martins 2011).Slika 3 prikazuje inačicu iz 1797.
Druga inačica, koja datira iz 1798. godine, nalazi se u Biblioteci karata Povijesnog arhiva brazilske vojske (AHEx) u Rio de Janeiru u Brazilu. Naslov joj je Carta Geografica de Projeção Espherica Orthogonal da Nova Lusitania ou America Portuguesa e Estado do Brazil (Geografska karta sferne ortogonalne projekcije Nove Luzitanije ili Portugalske Amerike i države Brazil,slika 6) koji se razlikuje od prve inačice. Dodana je riječ Orthogonal. Široka je 148 cm i visoka 133 cmi za nju je Pontes Leme upotrijebio „osamdeset i šest karata“, deset više nego za inačicu iz 1797. (Corrêa Martins 2011).
Karta sadrži devet grafičkih mjerila i na umetcima detaljnije prikazuje četiri mjesta uzduž obale u sadašnjim državama Bahia, Pará, Rio Grande do Sul i Rio de Janeiro. U toj se inačici navode i imena 34 osobe među kojima su astronomi, povjerenici i inženjeri koji su astronomskim opažanjima i kartografskim radovima dali svoj doprinos izradi te karte, uz „korografske karte“ iz sedam kapetanija, čiji su guverneri također navedeni (Corrêa Martins 2011). Karta iz 1798. godine može se vidjeti naslici 5.
Dio treće inačice iz 1803. godine nalazi se u zbirci Nacionalne knjižnice Francuske. Karta je katalogizirana kao Carte de l'Amérique équinoxiale et du Brésil i pripisana Joséu Lopes Santu. Sastoji se od dvaju zalijepljenih listova dimenzija 156 cm širine i 68 cm visine. Njezina je identifikacija izvršena tek 1903. godine prema usporedbi s kartom pohranjenom u Brazilu (Brazil 1903., str. 94–98). Ta nepotpuna kopija sadrži dva umetka - jedan koji se odnosi na obalu države Pará, a drugi na državu Pernambuco gdje je prikazan grad Olinda (Corrêa Martins 2011).Slika 7 prikazuje inačicu iz 1803. godine.
Postoji i četvrta inačica koja je danas pod nadzorom Gabinete de Estudos Arqueológicos da Engenharia Militar, Direcção de Infra-Estruturas do Exército (Ured za arheološke studije vojnog inženjerstva, Uprava za infrastrukturu vojske), Lisabon, Portugal. Ta karta nema naslova, široka je 202 cm i visoka 199 cm. Ima dvije praznine - jednu u gornjem lijevom kutu, dimenzija pet stupnjeva geografske dužine i deset stupnjeva geografske širine, a drugu u južnom dijelu Južne Amerike gdje nedostaje dio trenutačnog argentinskog teritorija. Ta inačica ima pet umetaka s obalnim područjima sadašnjih država Bahia, Pernambuco, dva iz Rio de Janeira i Rio Grande do Sula (Corrêa Martins 2011).
Bez naslova, njezina je usporedba s poznatim inačicama Nove Luzitanije dovela do toga da je prepoznaju kao jednu od njezinih inačica. Međutim, otvoreno je pitanje o datumu njezine izrade, vjerojatno je to 1794. ili 1795., ali moguće je i nakon 1803. Odgovor na to pitanje zahtijeva detaljnije istraživanje.Slika 8 prikazuje četvrtu inačicu.
3. Opis karte Nova Lusitania iz 1798.
3.1. Opće karakteristike
Karta ima dimenzije 148 × 133 cm, nacrtana je na šest međusobno zalijepljenih listova papira. U ovom se primjeru navodi da je Pontes Leme za izradu te karte upotrijebio „osamdeset i šest karata“.
Početni je meridijan bio onaj koji prolazi otokom El Hierro (Ferro) u skupini Kanarskih otoka. Srednji je meridijan projekcije odabrane kao meridijan kojemu odgovara 315º od Ferra, u smjeru suprotnom od kazaljke na satu, tj. od zapada prema istoku. Uzevši u obzir da se meridijan Ferra nalazi 20° zapadno od pariškog meridijana, a potonji se nalazi 2°39'14,025" istočno od meridijana u Greenwichu, meridijan Ferra je 17°39'45,975" zapadno od Greenwicha. Na taj način meridijan 315° Ferra odgovara meridijanu 62°39ʹ45,975" zapadno od Greenwicha, ili –62°39'46" ili –62,66277°. Granice karte mogu se vidjetitablici 1.
3.2. Mjerilo karte
Na karti nije napisano brojčano mjerilo. Mjerilo koje je u početku pretpostavljeno za kartu bilo je 1:3 865 000, premaCoelhu (1950). Na temelju toga provedena su kartografska istraživanja. Nakon toga, prema mjerenjima izvedenima na karti, pokazalo se da je približno mjerilo 1:3 762 000.
Grafičko mjerilo vizualizirano je s pomoću devet različitih mjerila. Prvo je definirana skalom od 100 liga, s pet podjela po 20 liga. Ostalo su mjerila na paralelama po pet stupnjeva s pet podjela na jedan stupanj. Grafička su mjerila prikazana u kartuši naslici 6.
Uočimo li da grafička mjerila utvrđuju da je podjela stupnja jednaka 20 liga, to omogućuje definiranje lige kao 20. dijela stupnja, odnosno 5555,00 m ako se uzme da je luk od jednog stupnja najveće kružnice jednak 111,110 km (Marques 1931).
3.3. Radijus sfere
Prema razmatranjima o vrijednosti lige može se izračunati radijus sfere koja se preslikava. Dobije se vrijednost 6 366 191,36 m koja je primijenjena na računanje duljina lukova paralela i meridijana upotrijebljenih pri analizi karte.
3.4. Kartografske projekcije
3.4.1. Sinusna projekcija
Sinusna projekcija je pseudocilindrična ekvivalentna projekcija, poznata i pod imenom Sanson-Flamsteedova projekcija. Jedan od prvih kartografa koji ju je koristio bio je Jean Cossin iz Dieppea na karti svijeta iz 1570. godine.
Projekcija prikazuje polove kao točke, paralele kao ravne crte, a meridijane kao sinusne krivulje. Uzduž ekvatora i srednjeg meridijana distorzija je nula. Os y je slika srednjeg meridijana, a os x odgovara ekvatoru. Distorzija projekcije je funkcija geografske širine i dužine. Što je veća udaljenost od ekvatora i srednjeg meridijana, to je veća distorzija. Sinusna se projekcija upotrebljava za tematske karte.Slika 9 prikazuje izgled projekcije, aslika 10 raspodjelu distorzije. U bijelom području praktički nema distorzije.
Jednadžbe te projekcije glase:
x = R(λ - λ0)cosφ (1)
y = Rφ (2)
gdje je R radijus Zemljine sfere, φ geografska širina, λ geografska dužina, a λ0 geografska dužina srednjeg meridijana.
Stvarna udaljenost između dviju točaka na nekom meridijanu može se dobiti s karte kao udaljenost između paralela koje tim točkama prolaze.
3.4.2. Poprečna ortografska projekcija
Ortografska je projekcija jedna od azimutnih projekcija izvedena za kuglu kao Zemljin model. Poznata je još od antičke Grčke. To je ortogonalna perspektivna projekcija gdje se gledište nalazi u beskonačnosti. Dakle, sve zrake koje izviru iz točke gledišta, prolazeći kroz sferu, stižu do ravnine projekcije pod pravim kutom i sve su paralelne. Preslikavanje ne čuva kutove ni površine. U uspravnom su aspektu projekcije sačuvane udaljenosti uzduž paralela. Geometrija projekcije ograničava projicirano područje na samo jednu hemisferu ili manje od toga. Zanima nas poprečni aspekt ortografske projekcije pri kojemu su slike paralela ravni segmenti, a slike meridijana su, osim središnjeg meridijana koji je ravni segment, poluelipse do granice projekcije gdje čine kružnicu.
Jednadžbe te projekcije glase:
x = R cosφsin(λ - λ0) (3)
y = Rsinφ (4)
gdje je R radijus Zemlje, φ i λ su geografska širina i dužina, aλ0, geografska dužina srednjeg meridijana. Naslici 11 prikazana je poprečna ortografska projekcija, a naslici 12 shema distorzija kutova.
4. Metodološka analiza
Metodološka je analiza razvijena prema sljedećim temama:
Razmatranja o dvjema projekcijama i mogućoj primjeni na karti Nove Lusitânije.
Georeferenciranje karte Nove Luzitanije na dvjema projekcijama radi provjere njihovog ponašanja.
Računanje duljine luka paralela i meridijana u dvjema projekcijama u njihovoj izvornoj veličini.
Mjerenje i računanje duljina lukova meridijana i paralela na karti, uzduž srednjeg meridijana, ekvatora i paralela. Mjerene su samo duljine lukova istočno od srednjeg meridijana.
4.1. Razmatranja o primjeni kartografskih projekcija
Obje su kartografske projekcije mogle biti primijenjene. U pogledu distorzija duljina sinusne projekcije ima prednosti pred ortografskom projekcijom. Međutim, zbog veličine područja koje obuhvaća karta Nova Lusitania, distorzija jedne ili druge projekcije neće biti značajna. Superpozicija dviju projekcija pokazuje očuvanje glavnog mjerila uzduž ekvatora i srednjeg meridijana. Za sinusnu su projekciju razmaci između prikazanih paralela jednaki.
U poprečnoj ortografskoj projekciji uzduž istih bi se osi razmak smanjio zbog svojstva projekcije, što se može vidjeti naslici 13.
Međutim, izgled obiju karata je izuzetno sličan, što se može vidjeti naslici 14.
4.2. Georeferenciranje karte Nova Lusitania
Georeferenciranje je provedeno s pomoću softvera ArcGis 10.3 uz sljedeće korake:
stvaranje sinusne projekcije i poprečne ortografske projekcije sa srednjim meridijanom kojemu odgovara –315° prema Ferru, odnosno u odnosu na grinički meridijan –62°39'45,975", ili 62°39ʹ45,975" zapadno od Greenwicha
transformiranje dviju datoteka: “ne_10m_admin_0_countries” i “ne_10m_populated_places_BRC”, (Natural Earth 2019), tako da odgovaraju zemljama i gradovima, za obje projekcije
georeferenciranje s pomoću istog popisa gradova i geografskih objekata: Salvador, Olinda, Porto Alegre, Buenos Aires (ARG), Guayaquil (ECU), Cabo Frio, São Luis, Belém, Alenquer, Tabatinga, Quito (ECU), Arequipa (PER), Valparaiso (CHI), Cayena (GUF) i Macapá kako bi se dobilo bolje prilagođavanje.
Nakon provedenih analiza utvrđeno je da su obje projekcije imale vrlo slično georeferenciranje. Nije bilo dovoljno vremena za kvantificiranje razlika unutar odgovarajuće preciznosti, ali vizualnom analizom i približnom studijom utvrđeno je da obje projekcije imaju iste karakteristike distorzije na istim mjestima, uglavnom zbog razlika u geografskoj dužini koje su se morale dogoditi u kompilaciji za razradu karte.
Slike 15i16 prikazuju rezultat georeferenciranja, gdje su okružena žutom bojom ona područja koja nisu bila blizu njihovih stvarnih položaja. Došlo se do zaključka da će sličnost koja postoji između dviju projekcija karakterizirati slično ponašanje u procesu prilagođavanja georeferenciranja.
4.3. Računanje duljina lukova meridijana i paralela
U početku su se duljine lukova meridijana uzduž srednjeg meridijana i duljine lukova paralela izračunavali od srednjeg meridijana, s razmakom od 5° geografske širine i 5° geografske dužine za svaku od projekcija. Rezultati se mogu vidjeti iztablica 2 i3.
Također treba uzeti u obzir da razmak od pet stupnjeva odgovara meridijanima 320°, 325°, 330°, 335°, 340°, 345°, 350° i 355° u odnosu na Ferro. Te se vrijednosti mogu usporediti s onima na karti Nova Lusitania.
5. Rezultati
5.1. Vrijednosti izmjerene i izračunane na karti Nova Lusitania, inačica iz 1798.
Za mjerenje dimenzija karte koristila se digitalna datoteka. Karta je digitalizirana u rezoluciji od 300 dpi, a razmatrane dimenzije su ukupna datoteka, dimenzije papira i dimenzije karte definirane njezinim unutarnjim granicama. Rezultat se vidi utablici 4.
Zatim su izvedena mjerenja i računanja duljina luka meridijana i paralela. Za to je upotrijebljen softver AutoCad Map 2020 koji omogućuje mjerenje do stotinke milimetra, što je posve nepotrebna preciznost za našu svrhu. Međutim, te su decimalne vrijednosti ostale i zaokružene su tek na kraju računanja. Svaka je vrijednost pomnožena s nazivnikom mjerila karte, odnosno s vrijednošću 3 761 995,888.
Tablica 5 prikazuje vrijednosti koje se odnose na lukove meridijana uzduž srednjeg meridijana. U stupcu 2 nalaze se vrijednosti izmjerene u centimetrima na karti. U stupcu 3 nalaze se vrijednosti transformirane mjerilom u metrima na sferi, a u stupcu 4 vrijednosti svakog luka meridijana od ekvatora na svakoj geografskoj širini naznačenoj desno od prvog stupca.
Tablica 6 prikazuje vrijednosti povezane s mjerenjima lukova paralela i uzduž ekvatora. U stupcu 2 nalaze se vrijednosti izmjerene u centimetrima na karti. U stupcu 3 nalaze se vrijednosti transformirane prema mjerilu u metrima na sferi, a u stupcu 4 vrijednosti svakog luka meridijana od ekvatora na svakoj geografskoj širini naznačenoj desno od prvog stupca.
U sljedećem je koraku izračunana razlika između izmjerenih i izračunanih vrijednosti za svaku od projekcija, što se može vidjeti utablici 7.
5.2. Rezultati
Opaža se da je umjesto smanjenja duljina prisutno povećanje razlika između duljina lukova, što karakterizira odsutnost ortografskog uzorka projekcije. Na sličan su način uspoređene duljine gotovo svih lukova meridijana i paralela uzduž srednjeg meridijana i ekvatora i dobiven je sličan rezultat.
Ponašanje sinusne projekcije stalna je razlika između duljina lukova meridijana i paralela uzduž ekvatora i srednjeg meridijana. Za ostale su položaje razlike vrlo male jer se praktički cijela Južna Amerika prikazana na karti nalazi u području minimalnih distorzija.
Vrijednosti razlike između izmjerenih i izračunanih vrijednosti za sinusnu su projekciju velike, posebno ona posljednja koja je veća od 10 000 metara. Međutim, u razmatranom su mjerilu te vrijednosti oko 2 mm. Uzevši u obzir deformacije papira, te vrijednosti nisu značajne. Dakle, može se zaključiti da su izmjerene vrijednosti u skladu s vrijednostima za sinusnu projekciju. Računanja na ostalim paralelama i meridijanima dala su slične rezultate.
6. Zaključak
Od četiriju inačica karte Nova Lusitania samo prve dvije imaju naslov. Naslov prve karte iz 1797. glasi Carta Geografica de Projeção Espherica da Nova Lusitania ou America Portuguesa e Estado do Brazil, a naslov druge inačice iz 1798. je Carta Geografica de Projeção Espherica Orthogonal da Nova Lusitania ou America Portuguesa e Estado do Brazil. Razlika je samo u jednoj riječi Orthogonal. Sav je preostali tekst u obje kartuše identičan, osim godina 1797., odnosno 1798.
Uočimo još da je sin x ≈ x za male vrijednosti od x. Prema tome, ako su vrijednosti od φ i λ - λ0 male, onda jednadžbe poprečne ortografske projekcije (3) i (4) prelaze u jednadžbe sinusne projekcije (1) i (2). Drugim riječima, što su vrijednosti od φ i λ - λ0 manje, to se poprečna ortografska i sinusna projekcija međusobno manje razlikuju.
Ovim je radom prikazana čvrsta osnova koja potvrđuje i dokazuje da je kartografska projekcija karte Nova Lusitania sinusna projekcija. To također povrđuje da su portugalski kartografi bili pod jakim utjecajem francuske kartografske škole toga doba.
Što se tiče četiriju inačica karte, iako primijenjena metodologija nije provjerena, čini se da je korištena ista kartografska projekcija, samo s varijacijom u mjerilu zbog dimenzija svake od njih.


