
INTRODUCTION
A Feed-in Tariff (FIT) Scheme for renewable energy use has been in effect since July 2012 in Japan. This FIT scheme has stabilized the return from investment expected for Japanese renewable energy projects, since the scheme guarantees that the electricity generated from renewable energy sources will be purchased at a fixed price over a long-term period. As a result, the Japanese renewable energy market has rapidly expanded following the entry of companies which were previously not linked to electricity generation (NEDO 2014). The tax exclusive tariffs for electricity generated from woody biomass – that is, biomass from thinning and final cutting in areas covered by 'forest management plans' - are 32 yen·kWh-1 (0.256 €·kWh-1; currency exchange rate: yen/€, January 2020) for facilities with a generation capacity over 2,000 kw and 40 yen·kWh-1 (0.32 €·kWh-1) for facilities with a generation capacity under 2,000 kw. These tariffs are higher than what is provided for other feedstocks, such as sewage residues and building material waste. For this reason, many power stations which use woody biomass as a feedstock have been constructed after the induction of the FIT Scheme, which has considerably burdened the supply of woody biomass (Ando 2013). Thus, a stable, long-term supply of woody biomass from plantation forests is necessary for the construction and operation of woody biomass-powered generation facilities.
In the northern part of Niigata Prefecture, Japan, the bucking strategy for felled trees with butts that have been bent by snow cover has changed after one biomass-powered generation facility started to purchase fuel wood chips. In the case of regular roundwood, the top part of felled trees used to become residue after bucking, while bent trees were cut to avoid the bent part of the tree. More specifically, the butt log used to be cut about 1 m above ground level to obtain the best possible log. In the current situation, which includes a buyer of fuel wood chips, small-diameter logs are cut from the top part of the felled tree. When bucking bent trees, a 2-meter-long butt log is cut from the regular stump height (this includes the bent part, which can be used to produce fuel wood chips). The logs that will be used to produce wood chips are harvested from roundwood because the profitability of plantation forest management in Japan is generally low and, as such, it makes sense from an economic perspective to utilize as much of a felled tree for value-added products as possible.
Researchers have previously attempted to estimate the potential supply of woody biomass by using geographic information system (GIS) data and forest growth models.Nord-Larsen and Talbot (2004) estimated economically feasible annual fuel wood resources in Denmark by applying a model that optimized allocation and transportation costs.Ranta (2005) applied a similar approach by creating a model that used availability comparisons between power generation facilities and resource allocation to estimate the technically and economically viable supplies of biomass from final cuttings in Finland.Yamaguchi et al. (2014) estimated the annual supply of timber and logging residues at a regional scale in Japan based on known cutting and extraction rates. In another Japanese study,Aruga et al. (2014) calculated the potential annual economic supply of forest biomass resources at a regional level under a rotation age of 60 years. Moreover, the potential supply of woody biomass was estimated by incorporating the long-term harvesting schedules of plantation forests.Aruga et al. (2006) investigated the potential of timber and logging residue volumes in a specific Japanese county by applying a random search technique to a model that included a harvesting cost constraint. In a Norwegian study,Rørstad et al. (2010) used linear programming that maximized profitability under non-declining harvest constraints to estimate the supply of harvest residues’ supply at a regional scale. However, the sustainable supply of woody biomass, i.e. the supply that will remain stable over a long-term period, in Japan has not yet been clarified.
The presented research aimed to estimate the potential supply of woody biomass in a specific district under the condition of maximum sustainable harvest of timber from plantation forests, as well as to determine how changes in the rotation age would influence this supply. An additional objective was to clarify how resistant the supply is to changes by the ten-year planning period, since the district under study is located in a snowy mountainous region of Japan. Bucking was simulated based on the current strategy in the district under study. The focal district includes plantation forests with unimodal age class distributions. However, it is important to note that some of the plantation forests are not suitable for profitable timber production. Furthermore, sustainable harvest levels cannot be easily predicted based on the growing stock, and its growth, in the district. In this research, sustainable harvest was defined as the stable production and profits over a planning horizon. The geographical attributes of stands were used to calculate the revenues and costs that are relevant to decisions regarding final cutting age. The supply of biomass resources was then predicted for several scenarios based on maximum sustainable harvest levels.
MATERIALS AND METHODS
Study Area
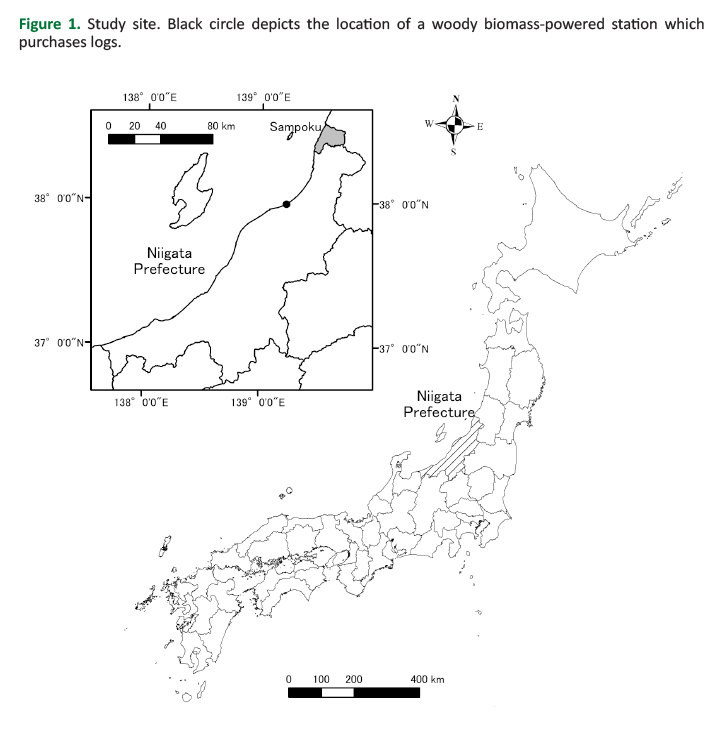
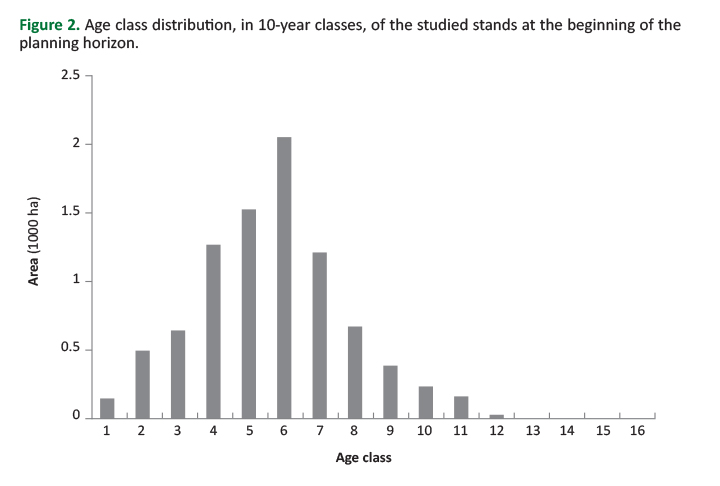
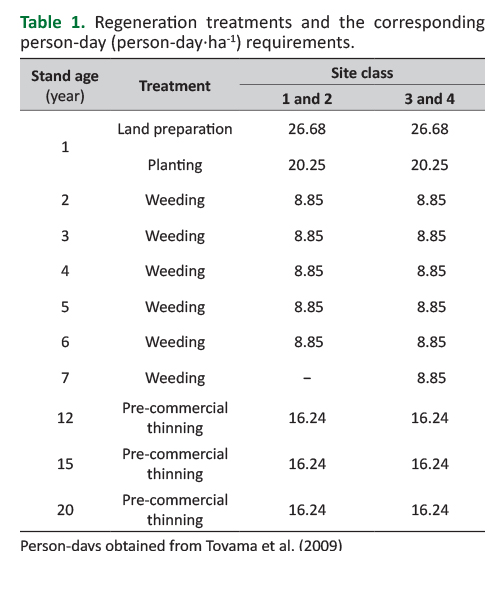
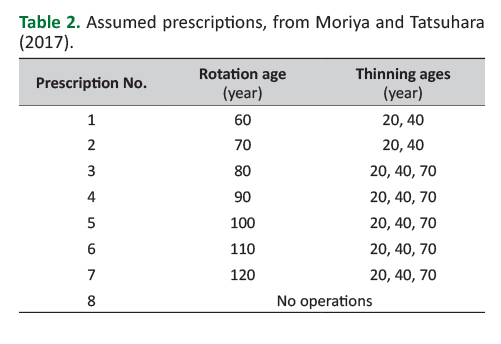
The study focused on numerous small-scale, privately-owned forests in the Sampoku district of Murakami City in the northernmost part of Niigata Prefecture, Japan (Figure 1). The district is one of the prefecture’s most active forestry regions. The studied forests included 13,792 sugi (Cryptomeria japonica D. Don) stands covering at least 0.1 ha, representing an area of 8,701.5 ha. A clear majority (86%) of these sugi plantations are covered by the ‘forest management plans’ from 2015. The stands currently show a unimodal age class distribution, which is a common characteristic of Japanese plantation forests (Figure 2). Timber production in Sampoku district amounts to 15,000–20,000 m3·year-1. The Northern Niigata Wood Processing Cooperative produces sawn and laminated wood from domestic medium-diameter logs, and has a log processing capacity of 24,000 m3·year-1. Niigata Prefecture Forest Owners’ Co-operative Association mediates arranged transactions of logs - with agreed volumes at fixed prices - between log producers and customers such as the Northern Niigata Wood Processing Cooperative, sawmills, plywood manufacturers, and suppliers of fuel wood chips to a woody biomass-powered facility in Niigata City with a generation capacity of 5,700 kW. The regeneration treatments and prescribed silvicultural regimes (hereinafter prescriptions) applied in the sugi plantations are summarized in Tables1 and2, respectively.
Data
The presented research used forest GIS data provided by the Niigata prefectural government, while contour and elevation point data were provided by the Geospatial Information Authority of Japan (2012), and road data were digitized from 1:5,000 scale forest maps (Tatsuhara and Dobashi 2006). The research is also based on information from interviews with representatives of the forest owners’ cooperative in Murakami City about the current status of forests and silvicultural operations in the study site. Information about the current subsidies provided in the prefecture was obtained from the Niigata prefectural government, while the relevant quality standards and prices for logs were obtained from the Niigata timber market and interviews with customers of sugi logs.
Predicting Yield and Calculating Profit
Yields and profits were calculated for stands under each prescription according to the methodology presented by Moriya and Tatsuhara (2014,2017), as summarized below. ArcGIS 10.3 (Esri, Redlands, CA, USA) was used as the GIS software to obtain spatial information.
The average heights of dominant and codominant trees in each stand were calculated from stand age and site class entries in the forest inventory data according to height/age curves published bythe Niigata Prefectural Government (1980). The yield from each stand, which took into consideration the applied prescription, was predicted using the stand density control diagram for sugi plantations along the Sea of Japan in the Tohoku and Hokuriku regions published bythe Forestry Agency of Japan (1981). The height of trees in each diameter class was estimated using a previously presented height-diameter curve (Nagumo et al. 1981). The stem form of trees in each diameter class was estimated using the following formula, with the values of certain parameters based on the stand density control diagram:

where p and r are parameters describing size and form, respectively (Prodan 1965). The simulations included a specific bucking strategy to predict the number and volume of logs that would be obtained from stands under each prescription. More specifically, the 2-meter-long butt log was cut from regular stump height. Then, as many four-meter large-diameter logs with a minimum top-end diameter of 30 cm as possible were cut from each harvested tree at 10 cm intervals. When no more large-diameter logs could be cut, the process was next repeated for four-meter medium-diameter logs (minimum top-end diameter of 16 cm), and then for two-meter small-diameter logs (minimum top-end diameter of 6 cm). A third of the large- and medium-diameter logs were assumed to be of A-grade (with the remaining two-thirds of B-grade), while all of the small-diameter logs were treated as C-grade.
Eight prescriptions were applied in the simulations, more specifically, seven of the prescriptions were variants of clearcutting systems with rotation ages between 60 and 120 years, while one prescription represented a non-clearcutting system without any operations (Table 2). All of the thinning prescriptions were assumed to be low thinning in which the thinning ratio was 40% in terms of stem numbers. The number and volume of logs of each length and top diameter class for stands under each prescription were predicted for both final cutting and thinning harvests.
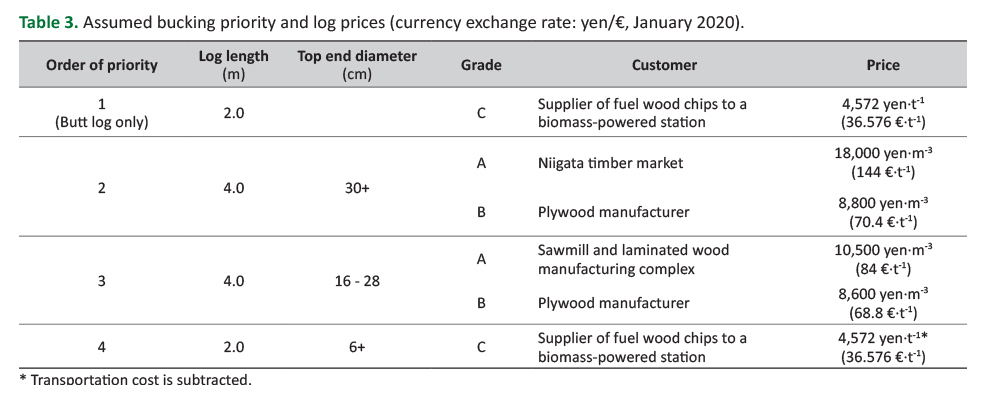
The revenue from the sale of logs was estimated based on the predicted log production and log prices. Log prices were set at the median of the daily middle prices on the timber market and purchase prices of main customers (Table 3). Logs for fuel wood chips are traded at landings as well as at the power station. These prices were averaged and weighted for the current trading amounts, after considering transportation cost to the power station. The green wood density of sugi was set as 0.81 t·m-3, while the moisture content was 130%. Subsidies for regeneration treatments from Niigata prefectural government were considered when calculating profits.
The cost of managing the stands was estimated by summing the regeneration and logging (thinning and final cutting) costs. The estimations assumed that the logging system for both final cutting and commercial thinning includes felling and limbing with a chain saw, full tree cable yarding, and bucking with a chainsaw at landings on forest roads. In each simulation, the thinning operation was specified as either commercial or thinning-to-waste based on the potential profitability of commercial thinning, i.e. sales revenue minus the cost of commercial thinning plus the subsidy provided by the prefectural government for commercial thinning. The area, initial age, and site class of stands were obtained from the inventory data, while slope and distance to a road were calculated using GIS. Maximum and average yarding distances were also calculated in GIS by measuring the distance from each 10 m × 10 m cell to the road, and then obtaining the maximum and average distances for cells in each stand. The regeneration cost was based on the person-days required for the treatment, which are listed inToyama et al. (2009) according to stand slope and distance to road (Takahashi et al. 1996). The logging cost was estimated by summing the felling, bucking, yarding, and log transportation costs (Suzuki and Tatsuhara 2016).
The profit over a rotation period for stands under each prescription was calculated based on the corresponding revenue, subsidy and cost estimates. Only prescriptions with a rotation age that did not exceed the initial age and that yielded positive annual profit per ha were considered as possible prescriptions for individual stands. These prescriptions were treated as candidate prescriptions in which they could be assigned to the stand in harvest scheduling.
Predicting Production of Woody Biomass Resources
Harvesting over the planning horizon was simulated according to four scenarios presented by Moriya and Tatsuhara (2014), namely:
Scenario 1a, maximizing sustainable level of total harvest volume with a rotation age range of 6–10 age class or 60–100 years;
Scenario 1b, maximizing sustainable level of total harvest volume with a rotation age range of 6–12 age class or 60–120 years;
Scenario 2a, maximizing sustainable level of medium-diameter log harvest volume with a rotation age range of 6–10 age class or 60–100 years;
Scenario 2b, maximizing sustainable level of medium-diameter log harvest volume with a rotation age range of 6–12 age class or 60–120 years.
The 'sustainable levels' indicate the middle of the maximum and minimum of periodic harvest volumes over a planning horizon. Scenarios 1a and 1b aimed for sustainable general timber production, whereas Scenarios 2a and 2b aimed for sustainable timber production based on the type of wood sold to the Northern Niigata Wood Processing Cooperative (medium-diameter logs). Scenarios 1a and 2a reflected the current rotation age range, while Scenarios 1b and 2b expanded the current rotation age range by 20 years.
The following harvest scheduling model was formulated using mixed integer programming (Greenberg 1971). Both the length of a planning period and width of an age class were set at 10 years, and the length of the planning horizon was set at 150 years (15 planning periods). The predicted volumes, revenues and profits could only fluctuate by up to ±10% over the 150-year planning horizon, which reflects the threshold for deviation applied byNelson et al. (1991) andSuzuki et al. (2018) in previous simulations of harvesting and net revenue.

subject to
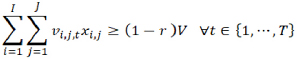
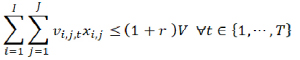
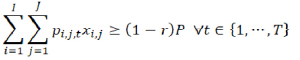
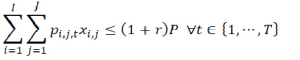
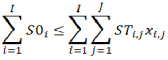


where z is the objective function, V is the sustainable harvest volume level during the planning horizon, P is the profit level during the planning horizon, I is the number of stands (1,372), J is the number of alternative prescriptions (8), T is the number of planning periods (15), xi,j is 1 when stand i is assigned to prescription j, and otherwise 0, vi,j,t is the harvest volume in the t-th planning period when stand i is assigned to prescription j, pi,j,t is the profit in the t-th planning period when stand i is assigned to prescription j, S0i is the stand volume of stand i at the beginning of the planning horizon, STi,j is the stand volume of stand i at the end of the planning horizon when stand i is assigned to prescription j, r is the threshold for deviation in the periodic harvest volume and periodic profit (0.1), yi,j is 1 when prescription j is a candidate for stand i, and otherwise 0.
Equations (3)–(4) and (5)–(6) include even-flow constraints for harvesting and profit, respectively, while Equation (7) includes a non-declining constraint for growing stock. Equations (8), (9), and (10) include constraints for the assignment of a single prescription, possible prescriptions, and binary integers, respectively. The model was solved using IBM ILOG CPLEX Optimization Studio V12.5.1 (IBM, Armonk, NY, USA) on a personal computer. Approximate solutions were obtained by applying the branch-and-cut method with a relative gap tolerance of 0.5%.
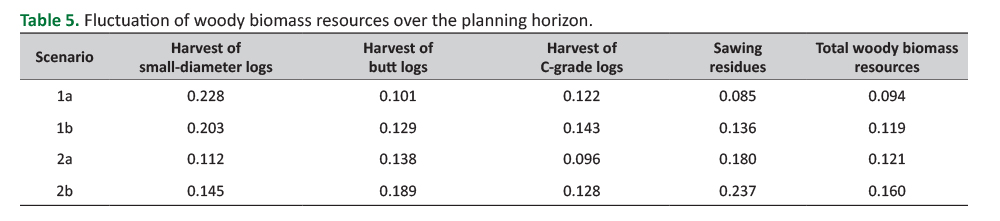
The estimations found that 40% of the A-grade log volume comprised sawing residues. Total woody biomass resources encompassed sawing residues along with the harvested small-diameter logs and butt logs. The sustainability of woody biomass supply was tested by calculating fluctuations in small-diameter log volumes, butt log volumes, sawing residues, and total woody biomass resources as follows:
f = (max − (max + min) /2) / ((max + min) /2) = (max − min) / (max + min) (11)
where f is fluctuation, max is the maximum value over the planning horizon, and min is the minimum value over the planning horizon.
RESULTS
Harvest Levels
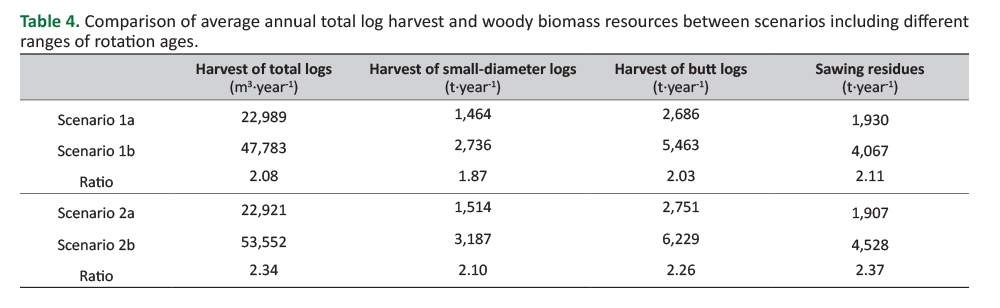
Scenarios 1a and 1b produced total harvest levels of 245.8 thousand m3·decade-1 and 467.4 thousand m3·decade-1, respectively, whereas Scenarios 2a and 2b yielded medium-diameter log harvest levels of 32.3 thousand m3·decade-1 and 71.2 thousand m3·decade-1, respectively. Both the levels of total harvest (Scenarios 1a and 1b) and the levels of medium-diameter log harvest (Scenarios 2a and 2b) volume increased approximately two-fold when the maximum rotation age grew by 20 years. The predicted harvest volumes of total logs and woody biomass resources also increased about two-fold when the maximum rotation age grew by 20 years. However, the growth in volume differed among the various classes of logs. For example, the volume of C-grade logs, especially small-diameter logs, increased less than the volume of total logs when the rotation age was extended by 20 years (Table 4).
Proportions of Stands Assigned to the Prescriptions
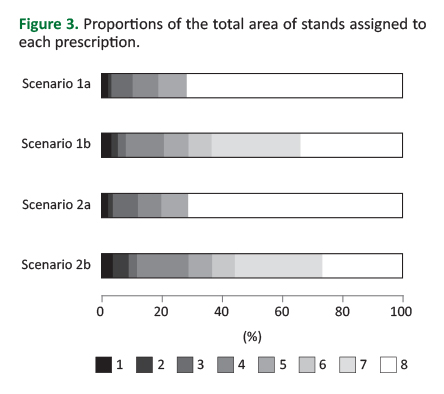
The two scenarios that included the current range of rotation ages (Scenarios 1a and 2a) showed clear similarities in the proportions of stands that were assigned to various prescriptions (Figure 3). In these scenarios, 70% of the total stands were assigned to Prescription 8 (no operations), while less than 4% of the total stands were assigned to Prescriptions 1 and 2 (rotation ages of 60 and 70, respectively). The other two scenarios – both of which included a 20-year extension of the range of rotation ages (Scenarios 1b and 2b) - also showed similarities in terms of the proportion of stands that were assigned to specific prescriptions. In these scenarios, 37% of the total stands were assigned to prescriptions with extended rotation ages (i.e., Prescriptions 6 and 7), while far less stands (less than half the proportion observed in the first two scenarios) were assigned to Prescription 8.
Periodic Harvest and Production of Woody Biomass Resources
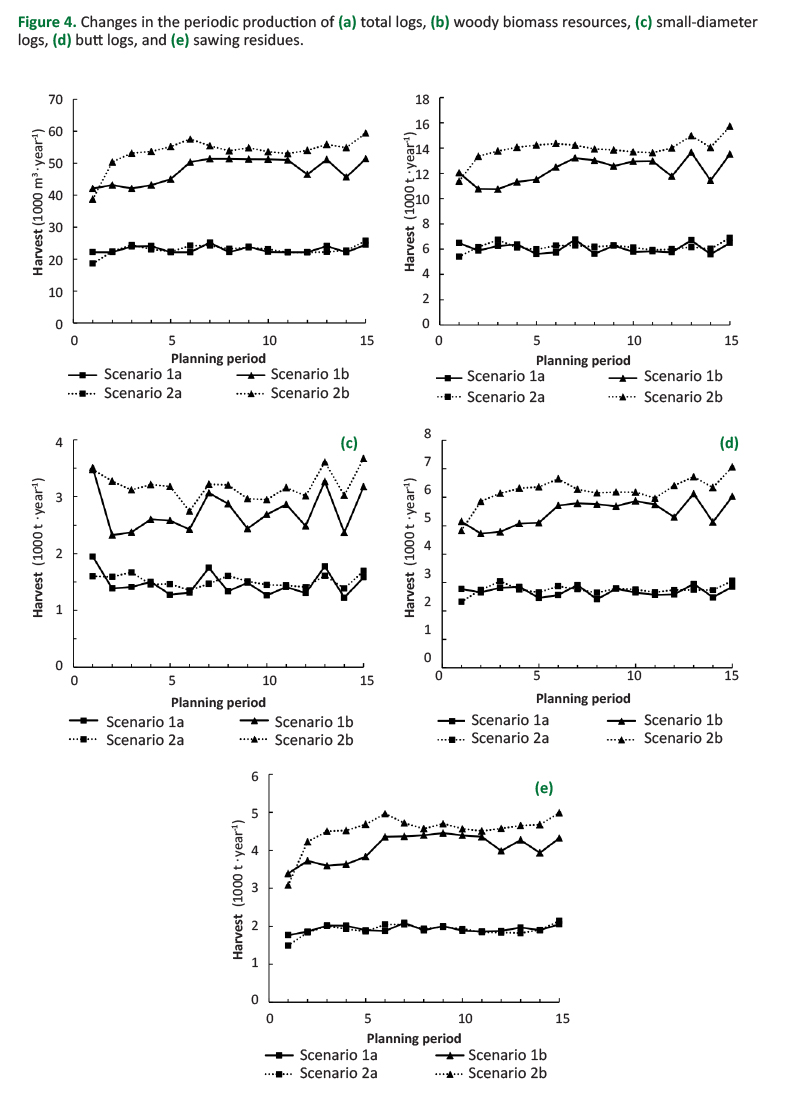
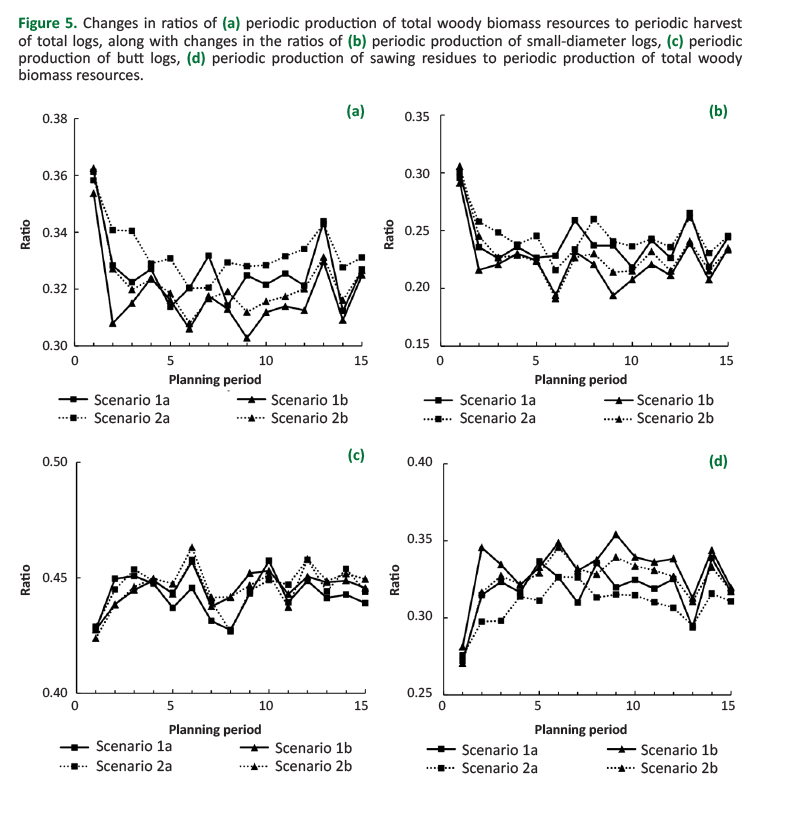
There were little difference in the various studied harvest volumes (total volume, butt logs, and small-diameter logs) between the tested scenarios that applied the current range of rotation ages (Scenarios 1a and 2a) (Figure 4). In contrast, large differences arose when the tested scenarios included an extended range of rotation lengths (Scenarios 1b and 2b). Scenario 2b showed greater periodic harvested volumes (total volume, butt logs, and small-diameter logs) than Scenario 2a in all the time periods except planning period 1 (Figure 5). The proportion of woody biomass resources in the total harvest volume was at its maximum during planning period 1 (35%–36%), after which it decreased to 30%–34%. The proportion of small-diameter logs in woody biomass resources varied between 19%–26% in the periods other than planning period 1, which showed a maximum proportion of 29%–30%. The proportion of butt logs in woody biomass resources varied between 42%–46%. The proportion of sawing residues in woody biomass resources was lowest in planning period 1 (27%–28%), while this proportion ranged from 29%–36% during the other periods.
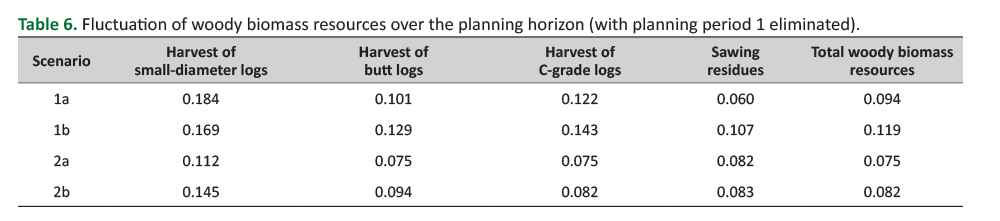
Fluctuations in total woody biomass resources were mostly less than 20%, with the exception of the harvested volume of small-diameter logs in Scenarios 1a and 1b (Table 5). However, if planning period 1 – which showed large fluctuation – is eliminated, all of the other observed fluctuations remained under 20%, with most under 15% (Table 6). Scenarios 1a and 2a showed less fluctuation than Scenarios 1b and 2b.
DISCUSSION
This paper showed the harvest of woody biomass resources over 150 years in a snowy mountainous region in Japan under the constraint of sustainable timber production. The developed model, which included a deviation threshold of 10%, demonstrated that the harvested timber volumes fluctuated by 15% over the simulation period, which can be considered to represent a sustainable supply.Sacchelli et al. (2013) described forest energy supply chains using a model that included several parameters, and classified the biomass potential of the studied supply chains as either ecological, technical, economic, or sustainable. In this study, the maximal supply potential of woody biomass was estimated in the context of sustainability.
Aruga et al. (2014) only considered a rotation age of 60 years, which was used to calculate revenues and costs and then describe profitable stands.Kinoshita et al. (2010) earlier highlighted that extending the rotation age from 40 to 80 years could increase the biomass chip supply in Japan because it increases the profitability of plantation management. This study included a wide range of rotation ages, and certain scenarios extended the current maximal rotation age by a further 20 years. Expanding the range of rotation ages by 20 years dramatically increased the harvested volumes of various woody biomass resources, as well as the proportion of stands that would be harvested, and reduced the proportion of stands classified as Prescription 8. Stands were assigned to Prescription 8 when the profit over a rotation period was negative, or when the stand could not be harvested during the rotation period because of a constraint to stable harvests. The changes from a 20-year expansion can be explained by two reasons (Moriya and Tatsuhara 2014). First, a longer rotation age would lead to an increase in the harvested volume of large logs, which have an advantage in price when compared to smaller-diameter logs. Hence, an expansion of the rotation age would improve the profitability of plantations. The second reason – which is based on the unimodal age class distribution of trees (Figure 1) – is that some stands could not be harvested in order to stay within the 10% threshold for deviation between periods. An expansion in rotation age would decrease the proportion of such stands. The two reasons showed that revenues from harvest increased by expanding the range of rotation ages and ecological potential of woody biomass resources in the study site were much larger that the estimates in this study. The second reason showed that economical potential of woody biomass resources in the study site were also larger that the estimates in this study.
Extending the range of rotation ages also increased fluctuation in all of the tested types of woody biomass resources. The total harvested volume during each planning period was constrained to a 10% threshold for deviation by the harvest scheduling model. The variation observed for the harvested volumes of each grade and size of logs was higher than what was observed for the total harvested volume. Furthermore, changes in the objective functions did not noticeably affect the fluctuation of woody biomass resources. However, Scenario 2b produced more woody biomass resources than Scenario 1b, with the exception of planning period 1, because of the increased harvesting of wood. This difference could be explained by an increase in the area of profitable stands in the current age class 6 (which represents the peak of the current age class distribution) after planning period 2. This dramatically increased the area of harvestable stands, and also explained the instability in production of woody biomass resources noticed in planning period 1.
The generation of electricity by woody biomass-powered stations in the snowy regions of Japan has led to changes in the bucking strategy and increased the merchantable volume ratio. In terms of volume, butt logs comprise two-thirds of C-grade logs. These logs were previously not utilized whenever the butt log was bent due to a tree being bent by snowfall, but can now be used to produce fuel wood chips. Even though the price of woody biomass fuel chips is low compared to the price of regular roundwood, and only provides small additional income, this fraction nevertheless plays an important role in making sugi plantation management profitable (Takahashi et al. 1996). Butt logs and small-diameter logs are cut to produce fuel chips, while sawing residues can either be used to produce fuel chips for woody biomass-powered generation facilities and boilers that dry lumber inside large sawmills, or material for mushroom cultivation beds. The estimated potential sustainable supply of biomass indicated that the C-grade logs and part of the sawing residues would be used to generate electricity at biomass-powered stations.
Trømborg and Solberg (2010) showed that an increase in energy price will reduce the production of particleboard and pulp in Norway. The change in the bucking strategy at the study site (i.e., bent butt logs are cut to produce fuel chips) could be expected to reduce the supply of logs for sawn wood, laminated wood, and plywood. Regarding sawing residues, fuel chips for woody biomass-powered stations compete with material for mushroom cultivation beds. Thus, this competition should be modelled based on real-world prices, or, as an alternative, future predictions of potential biomass supply should establish which proportion of sawing residues will be used to produce fuel chips for woody biomass-powered generation facilities.
CONCLUSIONS
The presented model estimated the potential supply of woody biomass from plantation forests in a snowy district in Japan under a constraint of maximum sustainable harvest. The simulation showed that even though the age class distribution of trees was unimodal, the sustainable harvest of timber led to a sustainable supply of woody biomass over various rotation ages. Furthermore, extending the range of rotation ages by 20 years dramatically increased the potential supply of woody biomass resources. The methodology presented in this paper could be useful to individuals or organizations that are planning new woody biomass-powered facilities for energy generation and/or purchase biomass fuel chips. The presented research is also relevant to regional forest resource managers who mediate arranged transactions of logs between log producers and biomass purchasers. The potential supply estimated in this paper can be considered to represent the actual maximum supply for the study site because the value is based on maximum sustainable harvesting and assumes that all of the sawing residues will be used to produce fuel chips, which may not hold in the actual market for sawing residues. Most of the plantation forests in the study site were covered by 'forest management plans'. Other estimates of the potential supply of fuel chips for biomass-powered generation facilities should take into account which stands are included in 'forest management plans', as this is a prerequisite for obtaining higher tariffs from the current FIT scheme.