
INTRODUCTION
Scientists and experts from many countries across the world are engaged in the research of wood density of different species of growing trees and timber (Heräjärvi 2004,Repola 2006,Missanjo and Matsumura 2016,Beets et al. 2018,Lachowicz et al. 2019,Farias et al. 2020). Recently, this indicator has particularly gained fundamental importance in tackling global environmental problems, namely, in biomass inventory and carbon balance monitoring in various terrestrial ecosystems (Beets et al. 2018,Farias et al. 2020).
Up to the 1970s in Russia, no particular importance has been given to the research of the technical properties of wood, when wood raw material was in excess, and its cost was negligible. Industry needs regarding high-quality raw material were met mainly at the expense of pioneer development of new plantations. In subsequent years, the situation changed dramatically, as an acute shortage of high-quality wood raw material was felt in the European part of the country. This initiated the execution of research work (Poluboyarinov 1976, Denisov 1999,Golyakov 2003,Kozlov et al. 2009,Danilov 2016,Platonov et al. 2018).
One of the priority studies of wood density variability inside the trunk of a tree was the fundamental work ofPoluboyarinov (1976). Although the results were obtained in the plantations of the North-Western part of Russia, they have been of great scientific and practical interest for other regions.
In the forests of Russia birch is mostly widespread among the hardwood species. Two species, silver birch (Betula pendula Roth) and white birch (Betula pubescens Ehrh), predominate in growth area size and stock of standing wood among 70 species growing in these forests. Birch wood, especially of these species, has good physical and mechanical properties and is of great industrial importance. It is widely used for the production of sliced veneer and plywood, parquet, chipboard and fiberboard, pellets, as well as for manufacturing rifle stocks, skis, and construction elements. Birch is a valuable raw material for wood chemical and papermaking industries in obtaining charcoal, methyl alcohol, acetone, furfural, cellulose and many other products.
In this regard, wood density is extremely important for its industrial use. This is related to its impact on both the technology of wood raw material processing and the quality of the final product. For example, in terms of the problems of wood cutting, density significantly affects lumber manufacturing technology, as well as wear and tear of saws and other cutting tools (Pesotsky 1970,Chernov et al. 2019).
Nowadays, laminated structures made of wood are widespread, where the density also largely determines their characteristics. For example, a 60% increase in strength and a 45% increase in stiffness of the finished laminated product can be achieved only by the rational arrangement of bonded parts in beams taking into account wood density (Poluboyarinov 1976).
Many physical and mechanical operational characteristics of wood correlate with density: compressive and flexural strength, hardness, rigidity, durability, ability to hold metal fasteners, etc. (Volynsky 1991). In Russian (Interstate) standards the density of birch wood is normalized for lumber and aircraft work pieces according toGOST 968-68 (1968) andGOST 2996-79 (1979), as well as for blanks for sporting and hunting shooting gun stocks according toGOST 16424-83 (1983). In the pulp-and-paper and wood chemical industries the density is the main indicator of the quality of wood raw material, since it determines the relative yield per the unit of its volume.
The maximum density of raw material is of great practical importance for the production of all of the above-mentioned and many other products. It is the density that determines many physical and mechanical properties and specific yield of products from a unit of its volume. One promising way to achieve this goal is the implementation of a non-destructive diagnosis method of standing wood quality and the selection of the most promising trees with maximum density for further cultivation.
The situation is aggravated by the fact that even within the same species of wood density inside the stick along its height and diameter varies depending on the direct or indirect effect of the complex of factors - genetics, soil and climatic conditions of the habitat, forest indices of the stands themselves and, most importantly, geographic region of growth of the specific stands (Poluboyarinov 1976,Lachowicz et al. 2019).
Despite the significant prevalence of birch stands in the forests of Middle Volga Region (occupying about 32% of the forested area), the studies of wood density have been rare hitherto (Denisov 1999) and there are no works directed at identifying the patterns of its variability (densitograms) inside the growing trees. Meanwhile, in recent years there has been an intensive use of birch stands as a source of raw material for wood processing enterprises in this region of Russia, denser wood with high technical characteristics being in special demand.
The purpose of the present work was to develop a non-destructive method for predicting standing wood density for rational use of available inventory of birch stands and, most importantly, their cultivation with specific intended purpose in the conditions of the Middle Volga Region in Russia.
MATERIALS AND METHODS
Birch stands of natural (seed) origin served as the object of the research on the territory of the Scientific-Experimental Forest District of the Volga State University of Technology (VSUT). Experimental plots are presented by birch and lime stands of 11 capacity classes characteristic for the Middle Volga Region. The type of site conditions is C2; the soil is sod-cryptopodzolic, loamy, and fresh. Silver birch (Betula pendula Roth) dominates in the stand composition, while European aspen (Populus tremula Link) and Norway spruce (Picea excels Link) are sporadically found as well. The average age of birch trees is 70 years; their diameter at breast height (DBH) is approximately 30 cm and the height is 28.5 m.
Two test areas were established in these stands according to GOST 16483.0-80. Seven sample trees based on the 'average model' were selected on each plot for characterizing the plot trees according to the main valuation factors, such as average diameter, height, crown shape, etc.
Before felling each model tree DBH was measured in two mutually perpendicular directions within the accuracy of 0.5 cm, and blazing was made on the north side. The total length, the distance from the butt end to the first open dead branch to the live crown, as well as the stick diameter at relative heights of 0.25H, 0.5H and 0.75H were measured for each felled model tree. At each of these heights and at a height of 1.3 m a disc of about 50 mm was cut out from the stick (Figure 1).
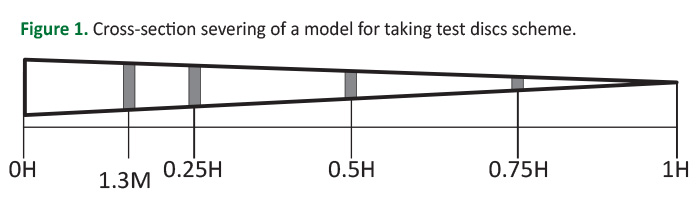
The relative height sampling method has several advantages over the method of fixed height sampling typically used in taxational studies when wood samples are taken in 1, 2 or 3 m. This former method simplifies the data processing on a computer and, more importantly, it allows to directly compare the density of different trees irrespective of their actual height by applying appropriate indicators on the graphs in the form of a densitorgam (Poluboyarinov 1976).
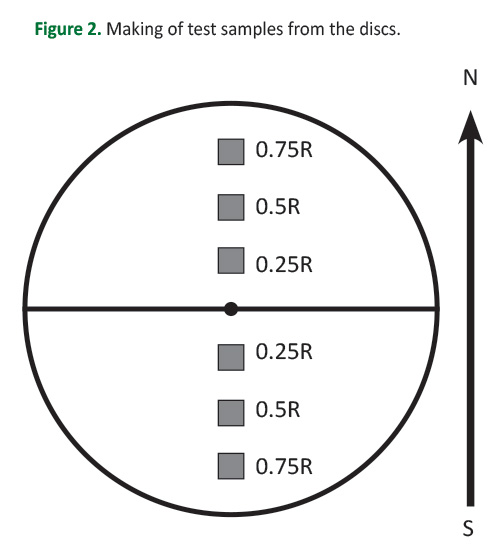
The discs were divided into halves as 'north' and 'south' parts. From each of them test samples were made in the form of rectangular prisms 20×20×30 mm at a distance of 0.25R, 0.5R and 0.75R from the pith (Figure 2).
In the study of physical properties of birch wood its density was determined by its basic density (ρbas, kg∙m-3) which is expressed by the ratio of the weight of an oven-dry sample (m0) to its maximum volume (Vmax) at humidity equal to or above the saturation limit of the cell walls:

The physical meaning of the basic density of wood is in the fact that it shows the amount of absolutely dry wood substance contained in a unit of its wet volume; this rate is independent of the humidity of the sample, which simplifies the process of laboratory determination compared with the conventional density ρw.
There are several ways of determining basic density, but the method in which the volume is calculated by measuring the buoyancy force of the samples immersed in liquid is the most convenient (a sample can have different geometrical shape) (Poluboyarinov 1976). A detailed description of this method is presented in our previously published work (Fedyukov et al. 2019).
The average density of the cross-section of a stick (ρcs) was determined by the method ofPoluboyarinov (1976) as a weighted average of densities ρ0.25R, ρ0.5R, ρ0.75R. If we take the cross-sectional area of the stick as 100%, the average density of the cross-section will equal to:
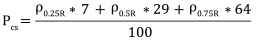
where ρ1.3m, ρ0.25R, ρ0.5R, ρ0.75R are wood densities at distances of 0.25R, 0.5R and 0.75R from the pith; , , , are the areas (in per cent) occupied by wood ring area.
The average basal stick density was determined as the weighted average of the densities of the individual parts (discs) along its height:
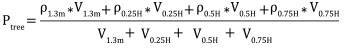
where ρ1.3m, ρ0.25Н, ρ0.5Н, ρ0.75Н are stick cross-section (disc) density at 1.3 m, 0.25Н, 0.5Н and 0.75Н height; , , , are the volumes of separate sections (discs) along the stick height.
To determine the basic density by Equation 1 the method based on measuring the buoyancy force of the samples immersed in liquid was used. A detailed description of this method is presented below (Figure 3).
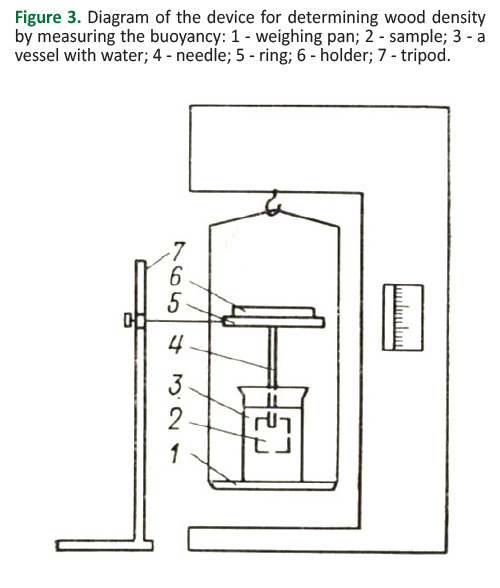
A vessel with water (3) is placed on the weighing pan (1). The ring (5) fixed to the tripod (7) is placed above the vessel. The ring serves as a support for the holder (6) which has a needle (4) with its end doused into water. In this position, the vessel with water is weighed. After that, the holder is removed and the sample (2), previously held in water, is placed onto the needle to determine its volume. After immersing the sample, a second report is taken. An additional load on the weighing pan is created by overcoming the buoyant force acting on the sample (Archimedes’ principle) and numerically equal (if we take the density of water equal to 1) to the sample volume. Consequently, the difference in readings on the scale gives the desired volume in cubic centimeters.
The sample mass in dry conditions will be determined by weighing on an electronic scale after drying at 103° C for about 10 hours.
RESULTS AND DISCUSSION
Changing of Wood Density along the Trunk Radius
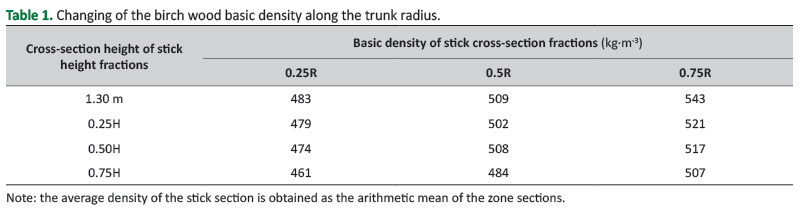
According toTable 1, the general character of wood density distribution along the trunk diameter coincides approximately with the results of modern research in other countries (Repola 2006,Missanjo and Matsumura 2016). However, the densitogram received byPoluboyarinov (1976) for this species in the conditions of the North-West region of Russia (Leningrad and Novgorod regions) (Poluboyarinov 1976) is the closest to it.
Meanwhile, there are some differences in wood density variation in the transverse direction, which is observed in the apical part where density gradually increases from the center towards the periphery, while for the birch in the above-mentioned region this occurs only up to 0.4 part of the radius, and there is a further slight decline.
Changing of Wood Density along the Trunk Height
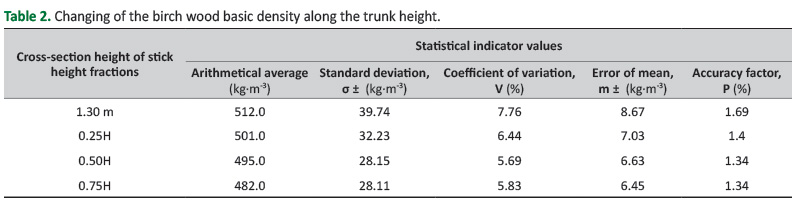
In absolute terms the average wood DBH is close to the results previously obtained in the region of research (Denisov 1999), i.e. about 500.0 kg∙m-3 for silver birch, which is higher than that of white birch (476.0 kg∙m-3).Table 2 shows that birch wood density decreases in a smooth manner along the trunk height.
This densitogram is consistent with the results obtained by other researchers in the past (Ugolev 2001,Danilov 2016) and nowadays (Heräjärvi 2004,Repola 2006,Kozlov et al. 2009,Platonov et al. 2018). For example, inRepola (2006) data are given on lower vertical dependence of birch density compared with spruce and pine. This is explained by the crown structure’s specific nature and the way of natural pruning of the stick from the knots. The birch as a light-demanding species undergoes a relatively fast natural pruning of the stick from the knots, and, consequently, the stick with a high raised crown is formed. The annual layers formed at a considerable distance from the live crown have a high percentage of late wood and, accordingly, high density.
As for the wood decrease in density along the birch stick, it appears due to the increase of the vessel area and percentage of parenchyma when approaching the top of a tree (Platonov et al. 2018).
A more detailed analysis presented inTable 1 andTable 2 shows that the reduction in density from the peripheral zone to the core wood is approximately 9.5%, and from the butt end to the top of the tree it is 5.9%. From a technical point of view, e.g. when severing entire tree length into timber assortments, wood density changes along the tree height within 6% are not significant. Density dynamics in horizontal planes of a stick cross-section are of greater practical importance, because they determine the significant difference of specific yield of high-level assortments, as well as the dry matter of the core and peripheral areas of the stick.
Consequently, there are less sharp dynamics of decline in density along the height of the tree than the increase in density from the center to the peripheral area in the horizontal plane in all sections of the tree trunk.
The results obtained confirm that the general nature of the change (decrease) in wood density along the trunk height is also consistent with the densitogram of the birch growing in the North-Eastern part of Russia (Poluboyarinov 1976), as well as elsewhere in the world (Repola 2006,Lachowicz et al. 2019).
Mathematical Models for Predicting Wood Density Inside the Tree Trunk
Previous studies also found out that there is a close correlation between the average density of the whole stick and individual density of its levels. Thus, for ripe even-aged stand of wood sorrel spruce forest in Leningrad region the dependence is obtained (Poluboyarinov 1976):
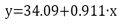
where y is stick average density in kg∙m-3; х is density at breast height in kg∙m-3.
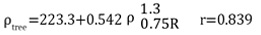
In birch and lime forest we also established a close relationship between wood density (ρtree) and average density of a cross-section at a height of 1.3 m (ρ1.3):
The average density of the stick was calculated by the above Equation (4); the average cross-sectional density was determined according to Equation (5). Differences in the cross-sectional density according to zones and the areas of these zones were taken into account.
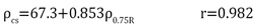
For birch the relationship was established between the average density of the stick cross-section (ρcs) and wood density in the peripheral zone (ρ0.75R) of this cross-section:
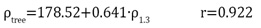
Based on the findings of the existence of a specific pattern of wood density change according to the zones, we obtained the relationship between tree density and wood density of the peripheral zone at a height of 1.3 meters:
It is important to note that in this case it is not required to take cores from the whole radius of a stick, which greatly simplifies the process and, more importantly, is less traumatic for the tree.
To study the pattern of wood density changing inside the stick let us consider basic density of the peripheral cross-section of the stick (0.75R) at the height of 1.3 m to be 100% (). Let us determine the basic density for each stick zone under study () with coordinates ( ; ) as a percentage with respect to . . showed the following values: 0.06 (1.3m); 0.25; 0.5 and 0.75; ratio showed 0.25; 0.5 and 0.75, respectively.
Then the definiendum of the experiment, i.e. the relative basic density of ith zone of the stick, y, is
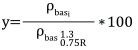
The following regression equation is obtained with the aid of a computer:
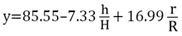
After verifying the equation (Fcalc =1.6 < Ftab = 2.1 for q =0.05) and substituting y by the value in Equation (8) we obtain:

CONCLUSIONS
The average density of the stick wood can be determined non-destructively by taking a radial cross-section core with the diameter of about 4.0 mm from a growing tree using Bressler’s increment borer. The procedure can be limited by the depth of drilling no more than 0.25 DBH. Once the basic density of the sample has been determined by buoyancy force method, the average density of the whole stick can be predicted on the basis of the laws governing the distribution of wood density within a particular wood species tree in respective stands.
This opens the practical possibility to predict wood quality of growing trees, which is the basis of cultivating the target forest with specified technical properties (density) of raw material for strictly special purposes.