
Introduction
The survey method is one of the most commonly used research methods in social sciences. It is an unavoidable tool with which social scientists and experts gain new insights into the world we live in. But the validity and reliability of the results collected by survey questionnaires depend on a number of factors that scientists designing and conducting such research need to consider while interpreting their results. Different types of bias, i.e., systematic errors that occur when measuring objects of interest, can be the function of the research method used. Therefore, a better understanding of the impact that method effects may have on research results is of great importance for successful preparation and implementation of social research using the survey method. One of the key goals of social research is to produce valid results, which can be reproduced using a different, independent sample. To accomplish this, some basic criteria are usually followed: using a representative sample, unbiased results based on some predefined criteria and their clear presentation, etc. As it is often difficult and expensive to obtain a representative sample, samples used in scientific research are often not representative. This is seen as the main reason why generalisation to the population from which the sample was obtained is not possible: due to sample unrepresentativeness, there is an (unknown) possibility that the results show a distorted picture of the population. In other words, nonprobability sampling cannot guarantee that the sample we observed is representative of the whole population, while probability samples are generally more representative than other types of samples, although never perfectly so (Babbie, 2013). But some of the phenomena that have the power to influence research results are not always so obvious and are hard to detect using traditional methods in social research.
One group of such effects is called method effects. Method effects are often thought to represent an undesirable variance in collected data which is unrelated to the variance of the instrument used and consequently affects the results (Maul, 2013). For example, the results on a scale that measures aggression are generally viewed as a result of the respondents’ level of aggression and some amount of measurement error. Furthermore, the variance of the scale is viewed in the same way. This approach can be viewed as somewhat outdated, as numerous recent research papers have looked into the impact of method effects on scale results and their variance, finding a statistically significant impact that method effects exert on survey results. This means that the understanding of the final scores is now more detailed and more complex (e.g.,Arias, Garrido, Jenaro, Martínez-Molina and Arias, 2020;Kam and Meyer, 2015). In general, the term “method effect” refers to any phenomenon that influences the measurement results, so that the measurement result is a combination of the scale, error, and method effect. Within the domain of survey questionnaires, some method effects that may affect the results and on which the present paper focuses are: a) item wording, b) confirmatory bias, c) careless responding, and d) acquiescence bias.
A growing number of researchers have been looking into the possible negative effects of item wording (e.g.,Weijters and Baumgarter, 2012;Suárez-Alvarez et al., 2018). Despite the known influence of combining both regular and reversed items in measuring scales, both types of items are present in most scales used in different areas of sociology and psychology. Reversed items are items that need to be recoded so that all of the items included in the scale have the same directional relationship with the underlying construct being measured. For example, if the measured construct is that of extraversion, items such as “I am the life of the party” and “I start conversations” should be viewed as regular items, while items such as “I keep in the background” and “I don’t talk a lot” should be viewed as reversed items. This means that, even if the item contains negations, it can still be viewed as a regularly keyed one, and items that contain no negations can still be viewed as reversed. For instance, the item “I don’t mind being the centre of attention” starts with a negation, but it is still considered a regular item as it does not have to be recoded when measuring extraversion.
The use of measuring scales consisting of an equal number of regular and reversed items, called balances scales, was first introduced to reduce response style bias (Nunnally, 1978;Paulhus, 1991). Response style bias is often referred to as any individual tendency which leads participants to respond to an item independently of its content, somewhat distorting the results in the process (Cronbach, 1946). Balanced scales were thought to handle response style bias much better than scales consisting of only regular or only reversed items. Despite this possible advantage, research has shown that balanced scales tend to have less discriminant power, provide a worse model fit to the data, and can often lead to problems in analysis, such as rejection of unidimensional models in favour of a multidimensional solution, because of the appearance of an artificial factor caused by item wording (Suárez-Alvarez et al., 2018;Marsh, 1986). For example, a scale that measures job satisfaction consisting of only regular or only reversed items could yield a one-dimensional solution, while a balanced scale measuring the same construct could yield a two-dimensional one, as they would distinguish job satisfaction as a construct separate from job dissatisfaction. If not familiar with the effects of item wording, this could lead to a disagreement over the dimensionality of a theoretical construct. Whilst recent researchers have identified a growing list of disadvantages regarding the use of reversed items, their use is still recommended when measuring scales, as they are thought to reduce response bias and improve construct validity by broadening the belief sample on which the participants’ answers are based (Weijters and Baumgartner, 2012). Item wording is only one of many elements that affect and distort research results, which are often overlooked in traditional research.
Confirmatory bias is another phenomenon that influences survey results, whose effects we investigated in this study. When participants answer a question, beliefs that are in line with the way the item is stated tend to activate. These beliefs can influence the results of subsequent items (Kunda, Fong, Santioso and Reber, 1993). For example, if we ask a participant if he or she is happy, they are likely to activate a belief system linked with happiness, which could alter responses to subsequent items. Likewise, if we ask a participant if he or she is sad, a belief system linked with sadness is more likely to activate. Given this, the direction of the first item presented in a scale could influence the results of all subsequent scale items. Past surveys, in which participants were randomly assigned to one of two versions of an item that were polar opposites of each other, i.e., extraversion versus introversion, showed that responses are likely to be biased in the direction of the first item (Andrews, Logan and Sinkley, 2015;Kunda et al., 1993;Johnson and Miles, 2011). These findings show the power of confirmatory bias, and ways of controlling for this effect should be addressed in survey research, especially if it uses Likert-type scales. The issue with Likert-type scales regarding confirmatory bias is that the first item has to be directed and is either regular or reversed. Given the definition of confirmatory bias, the effect is somewhat unavoidable in various scale-type questions.
Careless responding is a term that has been predominantly used to describe a type of responding pattern in which participants do not pay enough attention to item content (Schmitt and Stults, 1985;Woods, 2006). Some researchers attribute it to a lack of attention or motivation, or the participants’ tendency to form expectations about subsequent items based on the previous ones (Weijters, Baumgartner and Schillewaert, 2013). Regardless of the cause, it can lead to self-contradictory responses (throughout or in parts of the survey) and careless responding, both of which can consequently skew results. In fact, some simulation studies have shown that if as little as 10% of the participants respond carelessly, an additional, artifact factor appears, with one factor containing regular items, and the other reversed ones (Schmitt and Stults, 1985;Woods, 2006). This can cause misleading rejections of one-factor solutions for some constructs, as careless responding is hard to detect using more traditional factor retention criteria used in methods like exploratory factor analysis. There is a noticeable variability in the way careless responding has been operationalised, which undeniably affects reported evaluations of its presence in research (Kam and Meyer, 2015).
One of the most commonly used methods of evaluating careless responding is the Instructional manipulation check (or simply IMC), which represents a specific type of item that contains a direct instruction set by the researcher, that can be used to determine if a participant was careless while filling out a survey (e.gArias et al., 2020;Beck, Albano and Smith, 2018). For example, the item used could be formulated as either “Skip this item” or, in terms of a Likert-type response scale, “Select the ‘completely agree’ option for this item”. Also, the IMC item could be formulated as “Tick the empty square on the upper right corner of this page”. Participants who do not follow these instructions are considered careless. It is important to mention that the IMC item should be placed prior to a scale of interest so to enable the distinction between careful and careless respondents.
Acquiescence bias refers to the participants’ preference for the positive side of the scale. It can be described as a tendency to agree with items regardless of their content (Bentler, Jackson and Messick, 1971;Weijters et al., 2013). It can occur when participants carelessly agree with the scale items, never engaging in a more effortful reconsideration phase regarding its content (Knowles and Condon, 1999). Acquiescence is thought to distort correlations among construct measures (Bentler et al., 1971). Specifically, it can inflate positive correlations between similarly keyed items and deflate negative correlations between opposite-keyed items (Kam and Meyer, 2015). One fact that should be of particular interest to social scientists is that Likert-type scales, the most commonly used scale type in social science research, can be particularly susceptible to acquiescence bias (McClendon, 1991). Generally, acquiescence is viewed as an individual trait, separate from and mostly unaffected by the underlying construct being measured (Weijters, Geuens and Schillewaert, 2010). One method of measuring acquiescence is based on the degree to which participants agree with a group of heterogeneous items on a scale, with the assumption that items contained in the scale share no common content. This method, also known as Net acquiescence response style (or simply NARS), fits acquiescence bias into a single index, represented by the participants’ mean results across all items in the heterogeneous scale (e.g.,Weijters et al., 2013).
This study aims to explore the possible effects of all four described method effects. To our best knowledge, no such study has yet been conducted with a questionnaire in Croatian and including all four method effects on the same data. Comparing the results of different method effects on the same sample, as well as testing certain method effect influences (e.g., item wording) in Croatian presents a contribution to the validation process of any future scale dimensionality studies. If researchers are not wary of their possible implications, their results could be grossly biased. Using samples suitable to the survey needs, as well as being aware of the potential influences of method effects, could help social sciences fight the ongoing replication crisis.
Method
Survey and Sample
Data were collected through two versions of an online survey questionnaire (split-ballot survey design). The invitation for study participation with the link to access the questionnaire was distributed through various social networks, which makes the sample in this study non-probabilistic and convenient. The survey was primarily shared through Facebook and we assume that the bulk of the sample was recruited through this platform, although others were also used: WhatsApp, Instagram and email. The survey questionnaire was written in Croatian and the data were collected during March 2020. The study was approved by an institutional research ethics board.
The first question in the questionnaire was a filter variable used to simulate random assignment of participants into one of the questionnaire versions. This question asked if the participants’ birth month is an even or odd number. Participants born in an even month were assigned one version of the questionnaire and those born in an odd month another.
The sample containing odd birth month participants included N = 391 participants and the sample that contained even birth month participants included N = 400 participants. Of the 791 total participants that completed the survey, 97% had at most 3.4% of missing data, and none of the rest had more than 10% of the data missing. No statistical differences were found between the two samples regarding the variables sex, age, and education. Therefore, the average age of all respondents was 30 years (Min = 15; Max = 83; SD = 12.9). Seventy-one point five per cent of participants were male, 45.3% of participants (including students) had a higher education, that is, education beyond the secondary level.
Analytical Approach
We chose to test the effect of the four previously discussed method effects using the Mini-IPIP scales (Donnellan, Oswald, Baird and Lucas, 2006), mainly because of the domain of personality being widely empirically tested, but also because of the practicality of the scales’ length. We also used two scales concerning gender inequality (Inglehart and Norris, 2003;Tougas, Brown, Beaton and Jolly, 1995). The scales were adapted to the needs of this study (specific adaptations of individual scales are explained in subsequent paragraphs). All items in the survey were ranked on 5-point Likert-type response scales in order to ensure comparable variances. Each personality facet scale was located on a separate screen in an attempt to minimise potential “spillover” effects of the survey design. Besides, all other question groups were shown on separate screens that appeared in the same order regardless of the survey version.
1. Item Wording
To test the effects of item wording, and specifically the effect of changing a reversed item to a regular one (or vice versa), we selected two factors from the Mini-IPIP, conscientiousness and agreeableness, which were then used for data comparison. In our opinion, reversing items in those scales resulted in the most natural wordings, compared to the other three possible factors. Regarding this, we decided that in order to test the effects of item wording effectively, one version of the scale should consist of only regular items and the second one of only reversed items. We tested the difference in item means after recoding all the items in the same direction, as we predicted that item wording would have a significant effect on it. Using a confirmatory factor analysis (CFA), we tested if a unidimensional model regarding one facet of the MINI-IPIP (e.g., agreeableness) fit the data well. Besides, a test of measurement invariance between the two versions of a single construct included in both samples was conducted to gain further insight into the effects of item wording.
In addition to personality scales, we included two scales on gender inequality, including one identical item between them (Inglehart and Norris, 2003;Tougas et al., 1995). One scale was placed prior to all acquiescence and personality scales, and the other one after. We chose one item that was identical in both scales and reversed it in one so that we could have an indicator that directly tests the effects of item wording on the same sample. The chosen item was “A woman has to have a child to be fulfilled” in one version, and “A woman doesn’t need to have a child to be fulfilled” in the reversed version. If both versions are clear polar opposites of each other, and if the participants interpret them as such, we should see a correlation close to -1. In order to ensure further validity regarding this reversal, returning to a previous page was not allowed in the survey. The scale measuring intellect was identical in both samples and was used as a sort of a control construct to which other results would be compared.
2. Confirmatory Bias
We decided to test the effects of confirmatory bias in the same manner we tested the effects of item wording. For instance, we separated two other factors, emotional stability and extraversion, because they consisted of two regular and two reversed items in their original format. In one version, the scale started with regular items (p1, p2, n3, n4), and in the other, it started with reversed ones (n3, n4, p1, p2). In the latter case, n3-n4 represents reverse items and p1-p2 regular items. For the purpose of the analysis, the items were recoded to have the same directional relationship with the construct being measured. This means that in one version, a scale measuring extraversion started with items measuring extraversion. Conversely, in the other version, the scale started with items measuring its opposite, introversion. This strategy allows a direct comparison between the results in both samples, which should indicate the effects of confirmatory bias. To further ensure this, all of the personality scales were shown on separate screens. Additionally, means were tested between the same items in the two versions (e.g., a mean comparison between p1 in both versions), a test of a unidimensional model fit to the data was conducted (e.g., extraversion separately for each sample data), as well as measurement invariance tests between the same construct in the two samples.
3. Careless Responding
In order to measure careless responding, we included one IMC item which was placed prior to all relevant scales. Given the relatively short length of the survey, we chose not to include more IMC items, as they could become too apparent or could possibly irritate participants. The item “Select the ‘completely disagree’ option for this item” instructed participants to choose a specific option on a Likert-type response scale. All of those who did not follow this instruction were considered careless responders. We tested the effects of careless responding by comparing correlation results between careful and careless respondents on one item that was present in a regular and reversed version, personality scales, and acquiescence indicators.
4. Acquiescence Bias
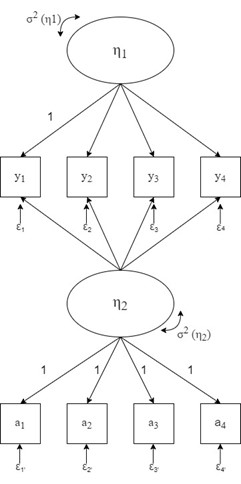
In order to effectively model acquiescence, an explicit net acquiescence index (NARS) was specified. The index result is the mean of all responses on a scale of 17 heterogeneous items used in the survey, for which we assume to have no common content. The scale is a slightly modified version of the one Greenleaf (1992) used to measure extreme response style, as it consists of heterogeneous items. To implement acquiescence into our design, we constructed a model that contains a method factor. It resembles the one used by Kam and Meyer (2015), with the exception that ours contains only one content factor. Additionally, we used four item parcels as indicators of acquiescence to avoid the estimation of a large number of additional parameters (e.g.,Kam and Meyer, 2015;Weijters et al., 2010). We created parcels by averaging the scores on acquiescence indicators. The acquiescence latent factor included was set to be uncorrelated with the personality content factor, and one factor loading of the content factor was set to 1 to set its variance. All item factor loadings of the acquiescence (method) factor were set to 1, and because of that, it can be considered a random intercept factor model (Maydeu-Olivares and Coffman, 2006). We recoded all items to have the same directional relationship with the underlying construct being measured. The proposed model is presented inFigure 1.
Statistical analysis
The analyses were performed using the R system for statistical calculation 3.6.2. (R Development Core Team, 2019). All univariate tests were conducted using the additional statistical package psych, developed by Revelle (2019). All structural models and all metric invariance tests were conducted using the additional statistical package lavaan, developed by Rosseel (2012).
In the CFA stages, we used a set of common fit indices to determine the fit of the constructed models. Generally, when using comparative fit indices (CFI;Bentler, 1990; TLI;Tucker and Lewis, 1973) the values of TLI and CFI in the range of .90–.95 may be indicative of an acceptable model fit (Bentler, 1990). The root mean square error of approximation (RMSEA;Steiger and Lind, 1980) is one of the most used parsimony correction indices. Hu and Bentler (1999) suggest that an adequate model fit has an RMSEA value less than .06, or that at least its 90% confidence interval (90% CI) value has to be less than .06, although some authors suggest that these parameters are too strict (Marsh, Hau and Wen, 2004).
Results
Effects of Item Wording and Confirmatory Bias
We tested the effects of both item wording and confirmatory bias using the same methods. First, we compared the means of item pairs that were either polar opposites of each other or were placed in different positions in the underlying construct being measured. For example, a regular item in the even month sample became a reversed item in the odd month sample when measuring for the effects of item wording and a regular item placed first in the even month sample scale became a regular item placed third in the odd month sample scale when measuring for confirmatory bias. Given that all the personality scales were shown in the same order for both samples and were on separate screens, we believe that we controlled for any spillover effects of the survey design. The results were mostly as expected and are presented inTable 1. The only scale that has not been changed in any sample, intellect, showed mean invariance in both samples for every item, which supports the validity of the following results.
Seven out of the eight item pairs that were mutually reversed show a statistical difference in the value of their means. This is a clear indicator that reversing items affects item means. The reversed items mostly showed higher item means. When we took a closer look at the data distribution for these items, we found that in six out of the eight items used to test the effects of item wording, a higher percentage of respondents selected the “completely agree” option for the reversed items, when compared to the regular items. The “completely agree” option for the reversed items was selected by 27.2% of respondents, as opposed to 15.6% of respondents that selected the same option for the regular items. This could be attributed to some form of careless responding and/or acquiescence bias because of the following reasons: the cognitive process used by respondents to respond to regular items is not necessarily the same as the one used to respond to reversed items, as the latter require better linguistic skills and more effort (Suárez-Alvarez et al., 2018). Because of this, respondents with lower linguistic skills and fewer skills could become susceptible to careless responding and contradictory results. We urge researchers to be wary of the effect of item wording when considering reversing some scale items, as it could affect scale results. The effects of positional changes in which the direction of the first item is changed can lead to differences in results, due to the presence of confirmatory bias in the survey (Kunda et al., 1993). Our results showed that, in six out of the eight item pairs, making positional changes resulted in a statistical difference in item means, confirming the presence of confirmatory bias.
The changes in means always followed the confirmatory bias principle: if the scale started with an item measuring emotional stability, all subsequent emotional stability item means increased, while all subsequent emotional instability item means decreased. Some form of confirmatory bias is unavoidable when using Likert-type scales since it is an inevitable source of error in human judgment (Erard, 2016). Besides, this is hard to detect using more traditional methods if there are no polar opposite items to which the results can be compared. Even more sophisticated methods that include confirmatory bias in SEM models use some form of a split ballot survey (e.g.,Weijters et al., 2013).
To gain further insight into the effects of item wording and confirmatory bias on research results, we decided to test for measurement invariance without modelling for acquiescence. It could be argued that this is somewhat problematic, as some of the models from the two samples did not fit the data well, but we still thought that it would provide additional instructive insight. To do this, we merged the data from the even and odd month sample while containing the birth month variable (1 = even, 2 = odd). First, we specified the models on which the invariance tests would be carried out. The specified models were identical to the ones used to measure acquiescence bias prior to the inclusion of the method factor, which means every model had four indicators. While specifying the model for agreeableness, the add-on package lavaan reported negative variances. As a negative variance is indicative of a misspecification of the model (Browne, 2015), we can assume that reversing items could have possibly resulted in skewing the data to such a degree that the model was deemed misspecified, although this cannot be confirmed.
Because of the gross misspecification of this model that reported negative variances, we chose not to test it for measurement invariance. Three out of the four remaining merged models resulted in a bad fit, which is not too surprising considering that those models consisted of scales used to measure the effects of item wording or confirmatory bias, for which we expected to skew the results. In regards to testing measurement invariance, most researchers have shifted from χ2 results to alternative fit indices, such as ΔCFI, because χ2 is overly sensitive to small, unimportant differences (Chen, 2007;Putnick and Bornstein, 2016). We have chosen to follow Cheung and Rensvold’s (1998) criterion of a -.01 change in CFI for nested models. If a change greater than .01 occurs between two invariance steps, a higher measurement invariance level is not achieved. The merged extraversion configural model did not show adequate fit parameters [χ2 = 45.82, df = 4, RMSEA = .194, CFI = .672], and neither did the emotional stability configural model [χ2 = 117.09, df = 4, RMSEA = .268, CFI = .856], nor the conscientiousness configural model [χ2 = 19.08, df = 4, RMSEA = .098, CFI = .760]. This means that the effects of item wording and confirmatory bias skewed the data in such a way that configural invariance could not be achieved. On the other hand, the merged intellect configural model showed adequate fit parameters [χ2 = 5.14, df = 4, RMSEA = .027, CFI = .998], and the intellect model achieved maximum invariance, which is evident in the results presented inTable 2. This furthers the validity of our findings. Although we did not use any independent personality scales, the adapted scales did not achieve even the lowest type of invariance, configural, while the intellect model, whose scales were not adapted, achieved the maximum type of invariance, latent mean invariance.
Effects of Careless Responding
In both samples, 74.5% of all respondents successfully followed the IMC item check instruction. We hypothesised that those who respond carelessly to a survey item affect item correlations, somewhat skewing the results in the process. To test that, we first compared the correlations between the two polar opposite items: “A woman has to have a child to be fulfilled” and “A woman doesn’t need to have a child to be fulfilled” between careful and careless respondents. After conducting Wiliams’ test, the results showed that the between-item correlations were not statistically different in the two separate samples and nor in a merged one [Odd: rcareless = -.644; rcareful = -.616; Even: rcareless = -.569; rcareful = -.641; Merged: rcareless = -,599; rcareful = -.632;]. More concerningly, the correlations were nowhere near -1, which seriously challenged the validity of the IMC item used in this particular survey. Had the IMC item proven to be valid, the between-item correlations of the careful respondent group should have approached -1 or were at least supposed to be statistically different from the between-item correlations of the careless respondent group. Furthermore, we tested the mean difference in NARS between careful and careless respondents, as a difference was also expected to occur there. Instead of only testing the mean difference of NARS, we decided to test mean differences for the 17 acquiescence indicators in both samples to understand better if there is a difference between careless and careful respondents. Out of the 34 total acquiescence indicators (17 indicators per sample), t-tests showed a statistically significant difference in only two indicators, with NARS being invariant, which further challenged the validity of the IMC item. Then we decided to test if careless responding led to expected differences in correlations between personality scales. We did this separately for both samples instead of merging them because in the case of sample merging item wording and confirmatory bias would also play an effect.
Out of the twenty total correlations between personality scales, only three have proven to be significantly different using Williams’s test. The results are presented inTable 3. Based on these results, we conclude that that the IMC item used in this survey did not distinguish careless from careful respondents effectively. The relatively low regular-reversed item correlations [-.599 to -.644] lead us to believe that careless responding is present in the survey assuming that the reversed item is a clear opposite of the regular one used in this research. We believe that wording an IMC item in a way that instructs respondents to select an option on a Likert-type scale (e.g., “Select the ‘completely agree’ option on this item”) may lead them to believe that the item measures some type of obedience or conformity, and could cause trouble understanding what is expected of them. For these reasons, we recommend using IMC items such as “Tick the empty square on the upper right corner of this page” over the type we used in this survey.
Effects of Acquiescence Bias
To test if modelling for acquiescence had improved the overall model fit, we chose to conduct a separate CFA for each construct in the two samples. One model was a simple unidimensional model with just a content factor, while the other one had an additional method factor of acquiescence. Then, we decided to specify nested models which could be directly compared. One model had specified paths between η2 and indicators y1-y4 constrained to zero, and in the other model, they were left free to vary, so a comparison could be made (seeFigure 1). All models tested if the unidimensional personality scale had a good fit for the data. The results of multivariate normality tests show that variables used in both models are not normally distributed but are highly asymmetric. Due to the asymmetric nature of the variables and the presence of some amount of missing data, we used MLR = the maximum likelihood estimator with robust standard errors (White, 1980) and a scaled statistic that is asymptotically equal to the Yuan-Bentler (2007) test statistic.
Before presenting the results of modelling acquiescence into personality scales, we want to remind readers that the scales measuring conscientiousness and agreeableness were modified for the needs of this study so that one version of the scale consisted of only regular items and the other one of only reversed items. Due to this, we did not necessarily expect a good fit regarding these constructs, as we cannot precisely estimate the effect item wording had on model fit. All results are presented in Tables4 and5. InTable 4, we have presented the fit indices of a model with and without the acquiescence factor, where any direct comparison is not possible because the models are not nested within one another. Although direct testing between these models is impossible, the results we get from fitting them are informative prior to the nested model tests. In most cases, the results show that the model fit was better when modelling for acquiescence. The intellect and conscientiousness scales had a good fit in both samples prior to modelling, and the same argument could be made for extraversion in both samples although this is up for some debate.
When a method factor was introduced to models, including the mentioned scales, comparative fit indices (CFI;Bentler, 1990; TLI;Tucker and Lewis, 1973) mostly took a minor hit but were still in the range that indicated an adequate fit [CFI: .966–.988; CFIacq= .890–.976] [TLI: .898-.963; TLIacq= .838–.965]. Generally, the values of TLI and CFI in the range of .90–.95 may be indicative of an acceptable model fit (Bentler, 1990). The root mean square error of approximation (RMSEA;Steiger and Lind, 1980) is one of the most used parsimony correction indices. Hu and Bentler (1999) suggest that an adequate model fit has an RMSEA value less than .06, or that at least its 90% confidence interval (90% CI) lower bound value has to be less than .06, although some authors suggest that these parameters are too strict (Marsh, Hau and Wen, 2004). RMSEA values for the intellect, conscientiousness and extraversion models without a method factor show that they do not necessarily fit the data well, although their 90% CI lower bound value always meets the criteria value of less than .06. However, after modelling for acquiescence, all RMSEA values and its 90% CI values improve, and after all combining all indicators it becomes clear that the intellect, conscientiousness and extraversion models with a method factor adequately fit the data. Models with a method factor of acquiescence also reveal better results regarding modification indices when compared to models without a method factor.
The scales measuring emotional stability and agreeableness showed a different pattern than other personality scales used in this survey. As we already mentioned, the items measuring agreeableness were adapted to suit the needs of measuring the effects of item wording, which could have potentially affected the models’ initial fit without a method factor. The effect of the scale adaptation in both samples resulted in models that grossly departed from the required values of an adequate fit. Even though modelling for acquiescence resulted in a “better” fit, it was still far from adequate and the models had to be rejected. The rejection could be due to the items making up the agreeableness scale not being adequate candidates for polar reversing in Croatian. However, the other scale that received the same adaptation, the one measuring conscientiousness, resulted in an adequate fit in both samples after modelling for acquiescence, which could mean that its items were better suited for polar reversals. The scale measuring emotional stability provided a poor fit in both samples and would result in the rejection of the model. But, after the inclusion of a method factor, the fit improved in both samples and it could be argued that the fit is now adequate, although most of the values fall just short of the needed criteria. But, as Marsh et al. (2004 argued that the provided criteria are too strict for most standard research, we think that a legitimate argument could be made for retaining the models.
After the initial screening of the models with and without the acquiescence factors, we decided to specify nested models which could be mutually compared. One model had specified paths between η2 and indicators y1-y4 constrained to zero, and in the other model, they were left free to vary, so a comparison could be made (seeFigure 1). After conducting tests between nested models, things became clearer. The implementation of the acquiescence factor resulted in a statistically better fit in only half of the tests. We expected the acquiescence model to be an improvement for models that used the scales adapted for testing the effects of item wording, which was the case three out of four times. Specifically, the conscientiousness model with an acquiescence factor resulted in a better fit in just one sample, although the addition of an acquiescence factor resulted in a better fit for the agreeableness models in both samples. Generally, because the models with an acquiescence factor resulted in a statistically better fit in only half of the tests, we are forced to conclude that the acquiescence factor we specified does not result in an improvement in the models’ fit indices, which means it should be rejected for a simpler specification. There is a limitation regarding this way of comparing models. The initial model does not contain an acquiescence factor, and although the specification of paths between the acquiescence factor and the content factors indicators to zero does follow this logic, it results in a worse fit than the model that contains only four indicators. Nevertheless, we were forced to conclude that adding an acquiescence factor resulted in no improvement of the models.
Discussion and Conclusions
The results of this study aspire to make a methodological contribution in the field of social research methodology in two ways. First, they contribute to a body of empirical evidence regarding the method effects that can have a statistically significant effect on the results of survey research and, accordingly, provide a distorted picture of the results in the population of interest. Second, based on these findings, we are providing some recommendations for controlling the analysed method effects, which would enable greater transparency and validity of future survey results.
The survey design itself has a flaw that needs to be addressed. Any differences found between the samples on the personality scales could just be a result of actual differences between them and not the adaptations that we used. Because the length of the questionnaire was an issue, we did not use any independent personality scale, which could have helped in better understanding the differences. We did, however, use a facet of the Mini-IPIP scales, which was not adapted and was identical in both samples, as this should enhance the validity of the results. To further ensure validity, each personality facet scale was located on a separate screen, in an attempt to minimise the potential “spillover” effects of the flawed survey design. Besides, all other question groups were shown on separate screens that appeared in the same order regardless of the survey version or the sample. Although the survey design has limitations, we believe that the collected results will be useful for any future researchers who plan to test multiple method effects simultaneously.
The findings of this study confirmed the majority of the initial hypotheses. First, both item wording and confirmatory bias affected the results in some form on a univariate level. Most item pairs reported a statistical difference in their means, showing that the effect does exist. Additionally, after merging the data from the two samples, a specified model of the scale measuring agreeableness converged with negative variances, which are mostly indicative of model misspecification (Brown, 2015). From that, we concluded that the effects of reversing items could be detrimental to the results. To test just how far these effects go, tests of measurement invariance were conducted. The only scale that achieved any form of invariance was the intellect scale, which was not adapted in any way. All other scales, which were adapted to test for the effects of confirmatory bias and item wording, did not achieve configural invariance, which showed the influence of those method effects. One limitation of this approach is that adjusting the scales for measuring item wording or acquiescence bias can cause the unidimensional model to be rejected, which could affect the validity of the measurement invariance tests. Confirmatory bias can be a random research error, as there are some survey software applications available that enable randomising the order of items for each participant. This means that the effects of placing regular or reversed items at the beginning of the scale should negate each other, making confirmatory bias a random error. This is by far the easiest way of battling confirmatory bias, and we highly encourage all researchers to implement this in their survey designs.
Second, the IMC item used in this survey to test for careless responding has a low discriminant validity, as it did not perform well enough distinguishing careful from careless respondents. The polar item pair correlations did not show a statistical difference between careful and careless responders in either sample. Construct correlations and NARS were also indicative of problems with the IMC items’ validity. We hypothesise that this could be due to the item formulation, which instructs the participants to select an option on a 5-point Likert-type response scale. We believe that this could lead participants to believe that the item measured obedience or conformity, which would cause them to select an option other than the one instructed. Therefore, to distinguish careful from careless respondents we suggest using different IMC items, for example: “Tick the empty square on the upper right corner of this page”. We believe that future methodological studies need to further investigate the relationship between the tendency towards conformism and the style of responding to statements that serve to identify careless responding. Based on the results of these studies it would be possible to determine which version of statements is most acceptable for measuring careless responding.
Third, we speculated that acquiescence bias is a phenomenon that, in some amount, is present in most surveys. It can affect and skew results, as it is hard to detect using more traditional methods. When a method factor of acquiescence was introduced to the model, the fit to the data improved in only half of the tests conducted, forcing us to conclude that this type of measuring acquiescence was not effective. An additional limitation of our approach is the sheer length of the scale measuring acquiescence, as it contained 17 items. We recommend attempts to implement shorter scales because reducing the instruments could increase the frequency of their use, and thus improve the control of acquiescence bias in social research.
The purpose of this study was to make researchers aware of the effects of the tested phenomena while conducting survey research. The instruments used to test these effects were from the domain of personality and gender inequality. Item wording and confirmatory bias affected the mean values, model fit, and measurement invariance, while the control for acquiescence bias did not improve the model fit, which points to a need for further research of controlling for acquiescence.
If researchers are unwary of the possible effects of either of them, research results could be biased, skewed and misleading. When constructing survey research, it is advisable to consider these effects or at least some of them. For example, an IMC check could only consist of one item, and it would bring additional insight considering the type of survey participants regarding their carelessness in answering survey questions. Being warier about the possible influences of method effects in the process of constructing the survey and interpreting the results could help social sciences fight the ongoing replication crisis.