
1 INTRODUCTION
Spain has undertaken a reform of its personal income tax (PIT), which became applicable in 2016. The reform consists of a set of measures that affect the different components of the tax to a greater or lesser extent. Among these is a decrease of the tax rates in the tax schedule, which especially benefited lower income tax-payers. In addition, the threshold of taxation was raised, the limit to the exemption of severance pay was extended, and the reduction for labour income was substituted for by a fixed amount for deduction of expenses. Tax rates on income from savings are also raised while other measures were introduced to promote saving in the long term. There is an increase in personal and family minimums and new deductions are introduced. The new deductions – like those already existing for working mothers with children under three years old can operate as negative taxes for families with ascendants and descendants with disabilities, as well as for large families.
In this work, we analyze the effects of the 2015 reform of the Spanish personal income tax on tax revenue, liquidity, redistributive and progressive effects and poverty, using microdata. The tax reform increases the redistributive effect. The applicable legislation in 2016 is almost 6.3% more redistributive than that of 2011, as measured by the Reynolds-Smolensky index. This is a remarkable achievement since the greater redistribution effect has been attained by significantly lower tax revenue. The 2016 legislation has resulted in 4.4% lower tax revenue, but progressivity, as measured by the Kakwani index, has increased by 12.2% in comparison to the 2011 legislation. The redistributive and progressivity analysis has been conducted with the use of microsimulation tools developed in the IEF. The poverty analysis was conducted with the use of EUROMOD –version G2.1 (Sutherland and Figari, 2013).
The paper is structured as follows. Section 2 describes the changes introduced by the reform, which are explained in detail in the appendix. Section 3 describes the amount and distribution of the increase in liquidity. Section 4 shows the effects on revenue, redistribution and progressivity generated by the reform, while section 5 is devoted to revealing their effects on poverty. Section 6 concludes.
2 MAIN ELEMENTS OF THE 2015 REFORM
To understand what the effects of the reform have been, it is necessary to know what the main changes that have occurred in the regulation of Spanish PIT are. The changes that have been put in place following the 2015 reform could be summarizedas follows:
New tax schedule: both the number of brackets and the marginal rates applicable thereto are reduced.
Reduction in withholding tax rates.
Labour income can be reduced by 2,000€ for other expenses, and there are changes in the reduction for obtaining this kind of income.
A reduction of 30% instead of 40% will be applied for yields generated over a period of more than 2 years, or obtained irregularly.
Family taxation: the personal minimum amount is raised as is that relating to descendants or ascendants that live with the taxpayer.
New tax credits for taxpayers with higher family burdens, such as those who work outside, large families or with people with disabilities under their charge may deduct fees for care up to of 1,200€ per year. Possibility of early collection.
To improve investment and stimulate savings, a new tax schedule applicable to the base of savings in which the marginal rates of each tranche are reduced; Creation of Long Term Savings Plan.
Reductions in the limits of annual contributions to pension plans and those made in favour of a spouse.
Incentive to patronage.
The reform has been implemented via a transitional period, so we present information about the tax rules for 2015 (transitional) and 2016 (definitive). The main changes in the regulations in the PIT reform of 2015 are described in more detail in the appendix.
3 EFFECTS OF THE REFORM ON LIQUIDITY
The reform we analyzed had a positive effect of liquidity in favour of taxpayers. By “liquidity”, we understand a greater availability of resources in the hands of the taxpayers. This means there is more money available, which is generated in two ways: on the one hand, through the types of retention, on the other, by the socalled negative deductions, which can be requested in advance payment. Our objective is to determine the extent to which liquidity has increased to the benefit of the taxpayers, using quantification for this purpose from:
microdata (global magnitude of increase in liquidity, which may be subaggregated by sources of income), and
the analysis of certain types of case (which family groups are those that perceive higher increases in liquidity, classified by family circumstances [number of children and level of dependency] and by the level of complete income that they obtain).
We used the most recently available data at the moment of calculation, corresponding to the 2011 Survey of Living Conditions. From the income distribution of 2011, we can obtain, by applying the basic regulations on withholdings of 2014, a theoretical reference framework. This scenario is compared with the application of the regulations of year 2015 and 2016 to the same data base. This means that the distributive structure of income is the same – marked by what happened in 2011 – and this distribution is applied before and after the reform. Thus, all the changes are due to the fact that a differentiated regulation is applied, without considering any change in the distribution of data (therefore, it does not include answers on the part of the taxpayer to the fiscal changes).
The microdata used affect the group of respondents because the information derived from the exploitation of retention models is not available. This leaves out an analysis of a large group of taxpayers who will also benefit from the reduction of withholdings, especially those whose labour income does not exceed 12,000€ per year, since, after the reform, they will not be subject to withholding.
According to the Ministry of Finance and Public Administration, it is estimated that as of January 2015, 750,000 employees are fully paid their wages because no type of withholding is applied.
The results derived from the application of the reformed withholding rates are showed intable 1.
Source: Authors’ calculation using Spanish Tax Agency data.
Liquidity has increased in all cases, for all sources of income and for all tranches. The percentage increase in liquidity (reduction of retentions in relation to the amount withheld prior to the reform) occurs in inverse proportion to the level of labour income obtained. The largest increase in the volume of liquidity is concentrated in the labour income, since this represents the greatest weight in the set of income declared in PIT.
The absolute increase in liquidity is calculated as the difference between the amounts retained in 2014 and in the years 2015 and 2016.
| Source of income withholdings: | 2015 vs 2014 | 2016 vs 2014 |
| Labour income | 4,062 | 6,819 |
| Income from capital | 233 | 466 |
| Leases of urban real estate | 73 | 147 |
| Economic activities | 171 | 342 |
| Capital gains | 15 | 31 |
| Total | 4,555 | 7,805 |
Source: Authors’ calculation using Spanish Tax Agency data.
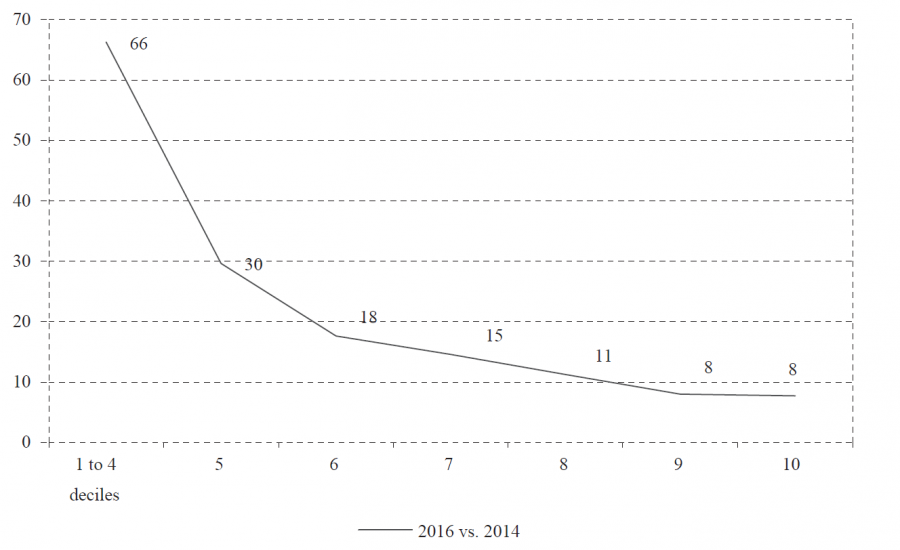
If we compare the liquidity increase per decile, the result is always a decreasing effect as the level of income increases. In the first four deciles, the accumulated liquidity increase in 2016 is 66.28%, in the 5th decile it is 29.64%, reducing to almost 8% in the last two deciles in which the differences between the two deciles is only slightly appreciable.
The effects of increased liquidity depend on the amount of income, the source from which it comes, family circumstances, and the option for individual or joint declaration (in the case of an individual declaration, half the related benefits to the descendants). The percentage increase in liquidity is calculated by comparing the amounts retained in 2016 with those in 2014, and dividing between the amounts retained in 2014. The increases in liquidity were calculated applying the transitional regulations of 2015, and the conclusions are the same as those obtained for 2016. For that reason, we present the increases of liquidity according to income level and family circumstances exclusively for the year 2016.
Differences in family needs have been considered by including families without children and up to three children, as well as two children in which one of them suffers from a disability of more than 33% or 65%. Thus, moving to the right in the tables shows greater need, just as moving from bottom to top, shows a lower income level. The comparison between 2014 and 2016 yields these results for individual taxation.
Note: The last two columns (6 and 7) refer to families with two children, one of them with a level of disability greater than 33% or 65%, respectively. Source: Authors’ calculation using Spanish Tax Agency data.
An increase in liquidity is equivalent to a reduction in retained amounts. If the percentage of increase of liquidity is of 100%, it means that the retention is half of that in 2014. When the percentages are well above 100%, the effect of the anticipated collection of the negative deductions appears.
The liquidity increases in any case, for all levels of income, regardless of family circumstances, and for the options of both individual and joint declaration. The results on liquidity increase show the highest values in the top and right positions of tables3 and4, which indicates that the treatment of lower withholdings is more beneficial to the families that have the greatest need, either by income level or by family circumstances. This result occurs in the transitional year and in the definitive year, and whichever tax option is chosen, individual or joint. Comparing the results of tables3 and4 it can be seen that the joint declaration option shows increases of greater significance than the individual declaration option. The inclusion of differences not due to income but to family circumstances is introduced by privileging families who, for the same level of income, have a higher level of need because they have more children or if they have to support a greater disability.
Note: The last two columns (6 and 7) refer to families with two children, one of them with a level of disability greater than 33% or 65%, respectively. Source: Authors’ calculation using Spanish Tax Agency data.
4 EFFECTS OF THE REFORM ON REVENUE, PROGRESSIVITY AND REDISTRIBUTION
In this section, we conduct an analysis of the effects of normative changes of the Spanish Personal Income Tax between 2011 and 2016. As mentioned in the introduction, the effects on revenue, distribution and progressivity generated by the reform have been calculated using the personal income tax microsimulation tool developed by the Spanish Institute for Fiscal Studies (in Spanish: IEF, Instituto de Estudios Fiscales). Poverty measurement is carried out using EUROMOD.
The explanation for the use of these two different tools is based on the better fit of the data used for each purpose: whereas the redistributive analysis is based on the panel of tax filers provided by the State Tax Administration Agency with very rich information in terms of PIT, the poverty analysis comes from data provided by the Living Conditions Survey, which represents the left side of the distribution of income better.
The reference is the income declared in 2011. The regulations used for comparison are those in force in 2011 and those approved for 2016. The reason for using the legislation approved for 2016, is that it constitutes the final, and not a transitional, tax reform. On the other hand, the 2011 regulations have been prioritized with respect to 2014 in order to avoid distortions in the results derived from the temporary application of the complementary tax schedule.
We calculate the effects on the redistribution and progressivity achieved by the reform by comparing the distribution of income before and after taxes. However, we are interested not only in the total effect, but also in the achievements of different elements, so it will be useful to define the different income concepts relevant to the interpretation and the results. As relevant variables, we highlight the following:
Pre-tax income is the most accurate approximation to the taxpayer’s true income (i.e. in the absence of taxes) that can be obtained from the administrative data.
The income net of taxes refers to the amount left to the taxpayers after they have submitted the taxable base to tax of tariff and all the deductions except those that can turn the quota into negative have been considered. In other words, the deduction for maternity leave and the new negative taxes are left out. The result of this income net of taxes, in addition to the changes in the configuration of taxable base, will make it possible to show the changes in the tax collection capacity.
The final net income adds to the previous concept all those deductions that operate as negative taxes. This variable will be higher in value to the income net of taxes as a consequence of the application of the new negative taxes. This differentiation of income is advisable because it allows us to analyze in an isolated way the effects on redistribution of new negative taxes.
| Tax revenue | Final net income | |
| 2011 | 65,485 | 411,191 |
| 2016 | 62,606 | 414,070 |
| Absolute difference | -2,878 | -2,878 |
| Percentage difference | -4.4 | 0.7 |
Source: Authors’ calculation using PIT microsimulation tool developed at the IEF.
As shown intable 5, the reform produced a revenue loss of nearly 2,878€ million, which means a 4.4% decrease for the Tax Authorities from the tax collected in 2011, and an increase of 0.7% on taxpayers’ net income. Before redistribution analysis is conducted, it is convenient to remember (Lambert, 1996) that the Reynolds-Smolensky index of redistribution can be obtained as the difference between the Gini coefficients of pre-tax and post-tax income, or alternatively, from the consideration of the Kakwani index, weighted by the effect of the effective average rate effective and discounting the reranking effect.
Thus, the Reynolds-Smolensky index (RS) is obtained as follows:
Where G refers to the Gini index of income inequality. RS is decomposed as follows:
Where t is the average tax rate, K is the Kakwani measure of progressivity and R is the reranking effect (Kakwani, 1984).
The effects on redistribution are summarized in tables6 and7, for the income net of tax and final net income, which differ in the fact that the second concept includes negative tax deductions.
Note: The values that have been used to obtain the Reynolds-Smolensky index have been given in bold. Source: Authors’ calculation using PIT microsimulation tool developed at the IEF.
As can be seen, the pre-reform income tax was progressive (Kakwani index is 0.27374) and achieved the redistribution of income (Reynolds-Smolensky indeks 0.04345), with an average rate of 13.7%. The effects are more pronounced when the negative deduction is taken into account (total net income instead of net of tax income) with a Reynolds-Smolensky index value of 0.04390 and Kakwani indeks value of 0.28101.
It can be concluded that the 2015 reform results in greater progressivity and redistribution than pre-reform legislation. Moreover, the effect is intensified when the negative deductions are considered, since these are more generous since the reform. The Kawani index is greater than before (0.295876 or 0.3152 including negative tax deductions), and the Reynolds-Smolensky index being higher (0.04566 or 0.04669 if we include negative tax deductions) indicates a greater redistributive effect after the reform. These effects are achieved despite the tax revenue being smaller (as showed by a smaller average tax rate after the reform, 13.1%) because the revenue effect decreases less than the progressivity effect increases, while the re-ranking effect is of very small magnitude.
It can then be concluded that the reform of 2015, although it implies less revenue, achieves more redistribution and progressiveness than were achieved before the reform.
Note: The values that have been used to obtain the Reynolds-Smolensky index have been given in bold. Source: Authors’ calculation using PIT microsimulation tool developed at the IEF.
Although the results are not included here because they are very extensive, the contribution to progressivity and the redistributive effect of the different modifications undertaken in the reform were also calculated in an individualized way. The changes in the tax schedule, in the personal and family minimum amounts, in the tax credits, and in the negative deductions, were separated. Each group of changes was considered as if each of them was the only modification of the reform, and the base and the tax amounts were compared before and after the modifications were introduced.
When the parts of the reform are analysed individually, all of them can be seen to contribute positively to redistribution and progressivity, although in different ways. For example, negative tax credits are the most progressive measure of all those analyzed separately, but their low impact on tax collection makes the final effect on redistribution the lowest of all the measures considered. For this reason it is interesting to analyze progressivity and the redistribution separately, taking into account that a very progressive measure (but not applied extensively, and therefore with little collection impact), can generate a small effect on the final redistribution. As an inverse example there is the effect of the tax schedule, which, with a Kakwani index of half that obtained by negative tax credits, has finally almost twice the redistribution effect, due to the impact on the collection.
Turning to the global results, we calculate the absolute and percentage change of the reform on redistribution (measured by Reynolds-Smolensky index), revenue capacity (measured by the average tax rate) and progressivity (measured by Kakwani index) intable 8. Results are separated depending on whether negative tax credits are included or not.
Source: Authors’ calculation using PIT microsimulation tool developed at the IEF.
5 EFFECTS OF THE REFORM ON POVERTY
The last of the analyzed effects of the reform of 2015 is a change of monetary poverty. It should be taken into account that the part of the income distribution that we focus on for poverty analysis is the left tail, which includes the lowest incomes. Many of the households here are not required to file for income tax, so it is more convenient to use the Survey of Living Conditions instead of the sample of income tax payers (the administrative data used in the analysis performed in section 4).
The poverty measurement has been obtained using EUROMOD (version G3.0) (Sutherland and Figari, 2013), a tax-benefit microsimulation model for the European Union, which is already pre-programmed and includes a more suitable dana base for this purpose (EU_SILC 2012). It should be pointed out that not all the changes operated by the reform of the PIT can be included. We include all those for which information is available both separating the changes and also considering all the modifications together. We will refer to the changes analyzed by the following nomenclature:
C1 = Modification of labour income reduction
C2 = Changes in tax schedule
C3 = Modification of personal and familiar minima
C4 = Tax credits for large and single-parent families
C5 = Negative taxes for disabled descendants
RT = Total reform = Combination of C1, C2, C3, C4 and C5.
The calculated poverty indices are the Foster-Greer-Thorbecke (FGT) using parameter 0 for measuring the incidence, parameter 1 for including the intensity, and parameter 2 in order to introduce the inequality consideration. The FGT indices are obtained for a poverty line of 60% of median income.
| Without reform | Withreform | C1 | C2 | C3 | C4 | C5 | |
| FGT(0) | 21.31 | 20.94 | 21.27 | 21.21 | 21.25 | 21.12 | 21.24 |
| FGT(1) | 7.96 | 7.82 | 7.96 | 7.95 | 7.96 | 7.84 | 7.95 |
| FGT(2) | 4.85 | 4.77 | 4.85 | 4.85 | 4.85 | 4.78 | 4.84 |
Source: Authors’ calculation using EUROMOD.
The results must be interpreted in the following way: before the reform, there was 21.31% incidence of poverty, which decreases to 20.94% if all changes from C1 to C5 (RT) are considered. Every change individually evaluated makes the percentage of poverty reduce, and the most effective measure in reducing the incidence is C4 (tax credits for large and single-parent families) which would on its own drive the incidence of poverty down to 21.12%). The overall effect does not derive from the addition of the effects individually considered. Intensity is also reduced for every measure, but as we use higher parameters for calculation of FGT indices, the changes are smaller and not visible at the hundredth level.
All measures analyzed are poverty reducers. When the analyses are done individually the effect may be very small (the effect may not appear to be in the second decimal place), but poverty is reduced in any case, and in all its dimensions.
It is convenient to assure the robustness of this result by checking if it is maintained for different poverty lines, as presented intable 10. The poverty lines (first column) are expressed in monthly amounts in euros.
For any of the poverty lines considered, it can be concluded that the reform reduces poverty in all its dimensions. Raising the poverty line involves the measurement of more poor people and a greater intensity. But whatever the situation of reference, the reform can reduce poverty.
Source: Authors’ calculation using EUROMOD.
6 CONCLUDING REMARKS
The Spanish Personal Income Tax reform seems to have generated good results in terms of liquidity, redistribution, progressivity and poverty reduction.
The liquidity increases in any case, for all levels of income, regardless of family circumstances, and for both the individual and the joint declaration options. Besides, the percentage increase in disposable income is always greater the lower the level of income, with a progressive effect on the distribution of liquidity.
The redistributive and progressivity analysis has been conducted by using microsimulation tools developed in the IEF. From the results achieved in terms of distribution, a clear conclusion is obtained: the tax reform has brought about a positive redistributive effect among taxpayers since it reduces the inequality that, in terms of income, exists before and after payment of the tax. In particular, the analysis points out that the applicable legislation in 2016 is almost 6.3% more redistributive than the applicable legislation in 2011, measured by the Reynolds-Smolensky index. This is a remarkable circumstance since this redistribution has been achieved through the lowering of this progressive tax, specifically 2.87€ million less than the tax revenue if the 2011 legislation was applied. The legislation in 2016 results, in terms of progressivity and measured by Kakwani index, a 12.2% higher than that from the application of 2011 legislation.
The poverty analysis carried out using EUROMOD lets us conclude that regardless of the poverty line considered, the tax reform cuts poverty in all its key dimensions, although the cut is relatively modest.