
1. UVOD
Intensive agriculture tends to have negative impacts on weed biodiversity. Arable weeds have been classified among the most threatened groups of vascular plants in Europe and many agrestals have become extinct locally and/or regionally (Storkey et al., 2012) . Significant changes in weed communites have been detected in many countries ( Hilbig, Bachthaler, 1992 , Storkey et al., 2010, Kolarova et al., 2013) . Many studies reported reduction in species diversity and the emergence of weed species with wide ecological amplitudes and difficulty to control (Lososová, Simonová, 2008) . Albrecht (1995) , for example, described changes in different German regions where average declines in species richness during the last five decades ranged between 10% and 70%. Also, a meta-analysis of changes in the number of weed species across Europe showed on average 20% reduction of species per field between 1939 and 2012 (Richner et al., 2014).
Many of weed species have become rare and are red-listed in various European countries. The situation in Switzerland is particularly dramatic, since 137 out of 176 arable flora are red-listed. Moreover, a study in UK (Oxfordshire) showed that weed species that had already been rare 40 years earlier were mostly absent from arable fields at the time the study was conducted (Sutclife, Kay, 2000) .
The main reasons for the decline in arable flora lays in rapid changes in agricultural practice since the 1950s when the selection pressure on weed communities was significantly increased. The increase in inputs of industrial fertilisers, pesticides and other chemicals, effective seed cleaning and shifting the timing of sowing from spring to autumn for many crops dramatically altered the arable flora of Europe (Andreasen, Streibig, 2010) . Also, the transition from conventional cropping systems to alternative ones (e.g. organic farming, and integrated pest management) affected weed communities at the field and landscape scale (Gaba et al., 2017) . Moreover, this temporal changes in weed flora shifts are not visible only in the aboveground vegetation, but also in size and composition of weed seedbank (Barberi et al., 1998, Barberi & Lo Cascio, 2001) .
The effects of agricultural intensification at field and landscape levels on the species richness of weed communities in the Republic of Croatia is still not well documented. The lists of threatened weeds for the continental part of Croatia were given by Hulina (1998, 2005) .
Therefore, the objective of this study has been to explore if there is a visible temporal change in weed species number and composition in main agricultural habitats of the agricultural region of the Istrian Peninsula with a particular attention on orchards/vineyards, row crops, cereals, alfalfa, and surrounding ruderal habitats.
2. MATERIAL AND METHODS
2. 1 Study area
A phytocoenological survey was initiated in 2005 and repeated in 2017 in Istria, the largest peninsula located in the northernmost part of the Adriatic sea. The peninsula covers the surface of 3.476 square kilometers, and the largest part (3.130 square kilometers) belongs to the Republic of Croatia. Agriculture has a long tradition in this region, although only 39,72% of the territory is under cultivation. In the last couple of years, a great attention has been paid to the revitalisation of agriculture, since the majority of arable land (84,86%) belongs to small family farms and it represents a combination of agricultural land and natural vegetation. The rest of the area belongs to non-irrigated fields (8,28%), permanetnt crops, mainly vineyards, orchards and olive growes (5,78%) and pastures (1,08%).
The investigated area covers the so called “gray” – fertile inner land mainly with a flish soil (sedimentary rock with grey clay rich in limestone) and “red” – coastline part of the peninsula named for its terracotta coloured soil (terra rossa or red clay soil) rich in iron (Racz, 2003) . The continental plains and valleys, are primarily utilized for crop production, while closer to the sea, red lands are used for cultivation of vineyards and orchards (mainly olives).
Coastal area experiences very pleasant Mediterranean climate with the highest average temeperatures averaging 24 0C in August, and lowest averaging 5 0C in January. Average yearly amount of precipitation in this area is from 800 mm to 1200 mm. Mediterranean climate gradually changes towards the continent and it passes into continental, due to cold air circulating from the mountains and the vicinity of the Alps.
2. 2 Vegetation sampling
This paper analyses a datasets of weed flora collected on arable lands and ruderal areas across the Istria peninsula in 2005 and in 2017. A total of 50 fields were surveyed for each of the sampling time. The inventored sites were classified into following agricultural categories: a) orchards/vineyards, b) alfalfa fields, c) row crops, d) cereals and e) ruderal habitats. Relevés in each five agricultural categories were uniformly arranged. The fields from the recent surveys (2017) were chosen as close as possible to the fields surveyed in 2005.
Fully developed vegetation was monitored as follows: cereals and alfalfa in June and July, and wide row-crops, orchards, vineyards and ruderal areas in August and September. At each location, one phytocoenological relevé of a standard size 100 m2 was recorded. The weed surveys were restricted to field edges in order to maximize the detection of characteristic arable weeds (Marshall, Moonen, 2002) . The species coverage was estimated using seven-degree Braun-Blanquet cover-abundance scale (Braun-Blanquet, 1964) . Braun-Blanquet indices of species cover (r, +, 1, 2, 3, 4 and 5) were transformed to percentage cover with the following intervals: 0-1, 1-5, 5-10, 10-25, 25-50, 50-75 and 75-100%). The mean of each interval was used as the absolute species cover (Van Der Maarel, 1979) .
2. 3 Data analysis
A relative abundance value for weed populations was calculated according to Derksen et al., (1993) . This is a synthetic importance value where relative cover was calculated as cover of individuals for a given species for each relevé divided by the total cover of individuals within the relevé. Relative frequency was calculated as proportion of relevés in which the species was present divided by the total frequency of all species. Then, relative abundance values were calculated for each weed species as follows: (relative cover + relative frequency)/2.
Species diversity from the past and the recent surveys was assessed by calculating different indices. Species richness was expressed as the mean number of species per plot (S-mean) and as total number of species recorded (S–tot). Shannon-Wiener Index of Diversity (H’) was calculated as:
H’= - Σ[piln(pi)];
where pi is relative importance value of each species (Whittaker, 1975).
Rank-abundance plots were used to provide a description of the community diversity between the past and the recent surveys (Whittaker,1967) . This is a very sensitive measure of environmental effect, since it simultaneously shows both components of species diversity, species number and evenness of species abundances (Magurran, 1988) .
The variation of the species composition between surveys and habitat types (orchards/vineyards, alfalfa fields, row crops, cereals and ruderal habitats) were analyzed with Canonical Correspondence Analysis (CCA) using CANOCO 5 (ter Braak, Smilauer, 2012) . Statistical significance of fitting CCA axes to the relationship between the species and external variables (i.e. habitats types) was tested using a global permutation test (Monte-Carlo test) of the species data at 1000 iterations.
3. RESULTS AND DISCUSSION
During the investigations (in 2005 and in 2017) a total of 175 species were identified, belonging to 131 genera and 36 families, which is a similar number of species compared to other surveys done in the Mediterranean region (Cirujeda et al., 2011, Damanakis, 1983) .
When comparing different habitats (orchards, alfalfa, row crops, cereals and ruderal areas), a general decline of the species relative abundance from the earlier to the recent survey was evident (Table 1). The most abundant species in 2005 and distributed in all crops and ruderal sites were Avena fatua L., and Setaria verticilata (L.) P. Beauv. Lolium multiflorum Lam. was very frequent in alfalfa crop and ruderal habitats, while Veronica persica Poir. was highly associated with orchards and vineyards. In the recent survey these species became very rare or were even not detected in some habitats (Table 1). However, in Spanish cereal fields (Cirujeda et al., 2011) these species are still considered frequent weeds, although for A. fatua some research had confirmed a long term decline of its population due to different cultivation (Wilson, 1978) .
One of the frequent species Ambrosia artemisiifolia L. distributed in 2005 in the Eastern and Southeastern part of the Istrian Peninsula (Kovačević et al., 2008) , mainly in ruderal habitats, is nowadays rare and was observed with a very low relative abundance only in row crops. Successful eradication campaigns in the region removed this plant from invaded sites (V. Kovačević, personal communications) .
Besides these, other weeds like Dactylis glomerata L., Polygonum persicaria L., Stellaria media (L.) Vill., Panicum milliaceum L., Veronica arvensis L., Equisetum arvense L. were relatively frequent in 2005, but they diminished considerably over time.
*Bayer Code for weeds: AVEFA (Avena fatua), LOLMU (Lolium multiflorum), VERPE (Veronica persica), SETVE (Setria verticilata), AMBEL (Ambrosia artemisiifolia), CYNDA (Cynodon dactylon), DACGL (Dactylis glomerata), POROL (Portulaca oleracea), POLPE (Polygonum persicaria), STEME (Stellaria media), AMARE (Amaranthus retroflexus), PANMI (Panicum miliaceum), VERAR (Veronica arvensis), EQUAR (Equisetum arvense), CONAR (Convolvulus arvensis), CLVVT (Clematis vitalba), AGRRE (Agropyron repens), MERAN (Mercurialis annua), KNAAR (Knautia arvensis), ERXCA (Eryngium campestre), XANST (Xanthium strumarium), RUSPP (Rubus spp.), PLALA (Plantago lanceolata), SORHA (Sorghum halepense), CAGSE (Calystegia sepium), CIRAR (Cirsium arvense), SETVI (Setaria viridis), ECHCG (Echinochloa crus-galli), CHENAL (Chenopodium album), DAUCA (Daucus carota), ERICA (Conyza canadensis), POLAV (Polygonum aviculare), MENLO (Mentha longifolia), PAVSA (Pastinaca sativa), PICEC (Picris echioides), HEOEU (Heliotropium europaeum)
Note: weed species are sorted according to their highest mean relative abundance values
In contrast, some species with a very low relative abundance or those not recorded in the earlier survey were found abundant in 2017 (Table 1). These are: Pastinaca sativa L., Conyza canadensis (L.) Cronquist., Picris echioides L. and Polygonum aviculare L. in orchards and vineyards and Heliotropium europaeum L. in cereals.
However, rhizomatous perennials Cynodon dactylon (L.) Pers. and Convolvulus arvensis L. which were dominant in row crops in 2005, became the most abundant species in the recent survey on regional scale as well as significantly dominant in orchards and vineyards (Table 1). Such increase in the dominance, particularly in permanent crops (orchards and vineyards) could also be explained with cropping conditions, e.g. cultivation, because they propagate mainly vegetatively, through stolon and rhizome fragmentation (Fernandez, 2003) .
Weed communities characteristics are shown in Table 2. The comparison of the weed communities in investigated area in 2005 and the present reflects the reduction of weed flora at the regional and at the field scale. The total species richness was significantly higher in 2005 when eighty-two percent of the total number of weed species (143 species in 110 genera) were sampled. In the recent survey fifty-five percent of the total number of weed species (97 species in 82 genera) were found. Sixty four species were common in both surveys, and these were considered frequent weeds.
These losses are consistent with the results of many studies, for example in Germany (Meyer et al., 2013) , in the Czech Republic (Tyser et al., 2009) , or Spain (Cirujeda et al., 2011) . On the whole, all the drivers that have been leading to decline of arable weeds could be interpreted in the context of the balance between seed return and seed bank declines due to the increased use of herbicides and inorganic fertilizers (Gerowitt et al., 2018) .
S-tot = total number of species recorded S-mean = mean species number per relevé H’= species diversity (Shannon-Wiener index H’)
Exceptions in this research were orchards and vineyards where a significant increase in the total number of species (47%) was detected (Table 2). Although mean species per relevé and H’ were similar, only 25 weeds were common to both surveys (data not shown). Weed control practice in grapevine, olive orchards and other permanent crops in Istria are mainly oriented to mechanical (inter-row) cultivation. Such non-chemical weed control practice influence weed communities on vineyards and orchard floor allowing many weed species with low abundance and/or inconsistent occurrence to develop (Baumgartner et al., 2007) .
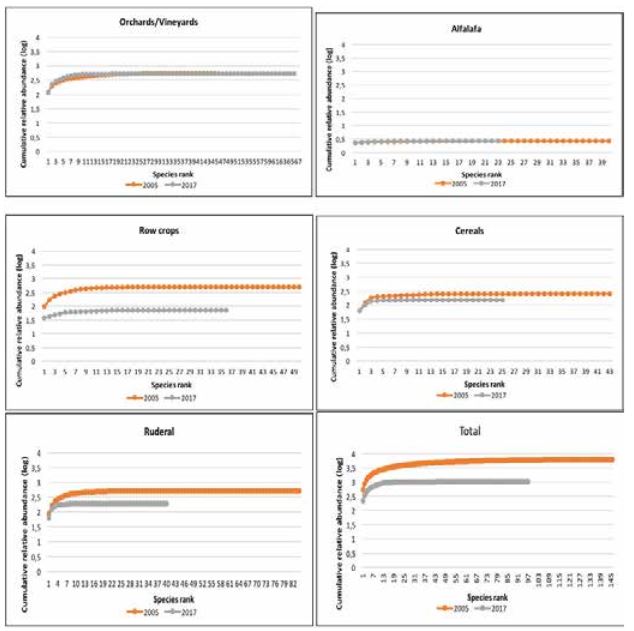
The mean values of Shannon-Wiener diversity index (H’) was also higher in 2005 and it decreased over time (Table 2). Particularly significant decrease in diversity was observed in row crops, cereals and ruderal habitats. This decrease of Shannon-Wiener’s diversity index (H’) is related to the decline of species richness, and to the increase in inequality in the relative abundance of species (Graph 1). This result was consistent with Roschewitz et al., (2005) who reported that species diversity decreased where the intensification of agriculture was higher and more complex. Thus, less intensive weed management in orchards and vineyards is beneficial for the higher weed diversity.
Source: authors
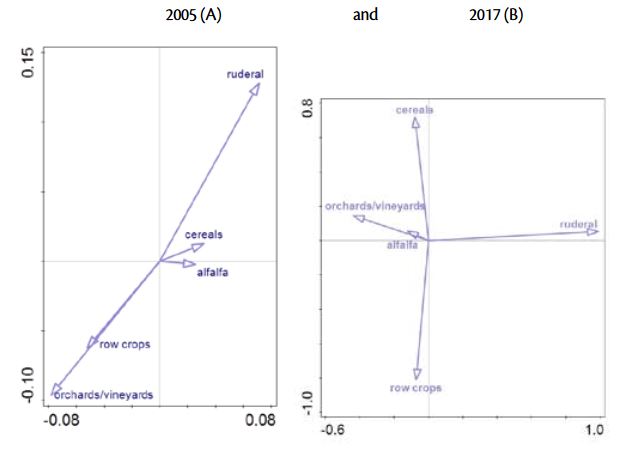
The results of this research also reveal changes in the relationships between weed communities and crops. The output of Cannonical Correspondence Analysis was presented in Graph 2. and Table 2. showing the shifts between weed community association and main crop types in Istria.
The first two axis in 2005 explained 40 % of the variance (axis 1 explained 24,2 and axis 2 15,8% of variance, respectively, Table 2). The length and the position of the arrows suggest a highly positively correlated weed community in row crops and in permanent crops and negatively correlated with ruderal habitats.
The decrease of the species richness and diversity over the period of 12 years is reflected on the weed community composition in 2017. On the basis of CCA analysis, 32,4% of the total variation in the species data was explained by the first two axes (Table 3). Axis 1 explained 19,7% of the variation and clearly separated weed community in ruderal habitats from those in orchards/ vineyards, alafalfa, cereals and row crops. Based on the second axis, which explained further 12,7% of variations, distinguished weed community in row crops from other agricultural habitats.
Cropping characteristics, particularly row spacing, clearly showed significant association of weed communities in 2005. but not in 2017. Although Gunton et al. (2011) found crop characteristics superior predictor of weed community composition than crop types, this research did not detect the same pattern in the previous and recent surveys.
4. CONCLUSION
The comparison of weed communities in 2005 and in 2017 surveys implies the reduction of the weed flora in 50 investigated agricultural plots in Istria. In 2005 Avena fatua L. and Setaria verticilata (L.) P. Beauv were the most abundant species distributed in all crops and ruderal sites. Very frequent in alfalfa crop and ruderal habitats was Lolium multiflorum Lam., while Veronica persica Poir. was highly associated with orchards and vineyards. In the recent survey these species became very rare or were even not detected in some habitats. In contrast, some species with very low relative abundance or not recorded in the earlier survey were found abundant in 2017. These are: Pastinaca sativa L., Conyza canadensis (L.) Cronquist., Picris echioides L. and Polygonum aviculare L. in orchards and vineyards and Heliotropium europaeum L. in cereals. Rhizomatous perennials Cynodon dactylon (L.) Pers. and Convolvulus arvensis L. which were dominant in row crops in 2005, became the most abundant species in the recent survey on regional scale as well as significantly dominant in orchards and vineyards.
The decrease of species richness (total and per relevé) was confirmed in all habitats types, except orchards and vineyards. The dramatic loss of biodiversity was evident in row crops, cereals and ruderal habitats. Besides the decline of species richness and diversity over the period of 12 years, significant changes happened inside the floristic composition. As expected, ruderal weed community floristically differs from other investigated habitats in 2005 and in 2017. Row spacing clearly showed significant association of weed communities in 2005 but not in 2017 indicating fluctuational rather than structural changes in weed communities.