INTRODUCTION
Albania and North Macedonia, as many countries in South-Eastern Europe, struggle with youth unemployment, which is persistent, acute, and unresponsive to the education of young people in both countries. Educational attainment is considered a strong predictor in long-term employment and active economic activity, especially among the youth[1]. As such continuing higher education is perceived as a guarantee for a future better and higher-paying job. While an indication of academic achievement is considered the GPA, generally believed as an index of mental ability[2], as well one’s motivation to learn[3]. It is demonstrated that recruiters are encouraged to evaluate applicants more favorably due to the presence of a high GPA on their resume[4]. There are other viewpoints on the GPA metric, except that it generally might predict the success of the worker job outcome. It helps predict the employee’s predisposition to freely and voluntarily offer helpful behavior in the work environment and to co-workers. If GPA helps predict both job success or performance, and one’s freely tendency to engage in helpful behavior in the organization, then the GPA metric has increased value[5]. Studies have revealed that unemployed students were more likely to have lower GPAs, while employed students were more likely to have higher GPAs[6]. Other things being equal, in particular in high-paying foreign firms, graduates with better college GPAs were more likely to be employed. Furthermore, female graduates advantage in GPA favor females in employment, helping to produce also a gender employment gap[7].
The number of higher education institutions has been growing in the last decades. In 2003 Albania and North Macedonia joined the Bologna process going through all the related reforms in higher education as changes in funding arrangements, changes in curricula, and changes in higher education legislation. In 2015, there were 240 registered higher education institutions (HEI) in Western Balkans with 586 faculties. In this classification Kosovo and Montenegro are in better positions, respectively with 2,2 and 2.1 higher education institutions per 100,000 population, followed by Albania with 1,3 of higher education institutions, Serbia and Bosnia Herzegovina each by 1,2 higher education institutions, and last North Macedonia with 0,8 higher education institutions[8]. The biggest challenge of higher education is insufficient investment in education by the state. Higher salaries for professors, greater funding for research, and investment in labs and information technology would increase the quality of education[8]. The rising of digitalization in the economy has led to a demand for highly skilled graduates with different knowledge and skills, aimed to support the complexity of modern business[9]. Transfer of knowledge from academia to business is considered an essential factor for creating innovation, and this transfer would significantly be improved through the creation of university spin-offs[10].
Between 2010 and 2019, an average of 49,5 % of young people in North Macedonia was unemployed and the gap in unemployment of adults and young people has widened since 2010, while for the same period in Albania an average of 31,5 % of young people was unemployed[11]. Youth are more likely to be unemployed and underemployed because of lack of experience in job searching, less power in wage bargaining, and as a result, they are more likely to accept underpaid jobs that do not match their skills[12]. Analyses of youth transition from school to work in Albania have shown the phenomena of skills mismatch with the labour market positions. There is a mismatch between labour market features of supply of qualifications and diplomas, and demand skills perceived by the employers[13]. Studies in the North Macedonia labour market suggest that due to the very low level of demand for labour, there is an abundance of highly educated unemployed young people, and employers select workers with the highest level of education besides the complexity of the workplace[14]. However, it is not clear to what extent various characteristics impact the likelihood of employment among young graduates. To shed some light on this area, this research focuses on the determinants of youth employment based on survey research conducted on a sample of graduated students in economics programs at two universities in Albania and North Macedonia.
The rest of the paper is organized as follows. The following section explores the impact of education on youth employment. The third section analysis labour market indicators in Western Balkans, whilst the data and methodology adopted in the empirical investigation of the determinants of the probability of being in employment is explained in the fourth section. The results are presented in the fifth section and the final section summarises the key findings and considers their policy implications.
EDUCATION AND YOUTH EMPLOYMENT
Tertiary education is considered a crucial pathway for a better job or higher-paid salary perspective. During the past decade, most of the countries experienced unprecedented growth in tertiary education indicators[15]. The high rate of student enrolments, as well as the graduation rates of tertiary education, demonstrate the increasing phenomenon. The employment of young tertiary-educated adults has advantages over young upper secondary education adults[16]. Prevoius research indicate that the success of the hiring process is more attributed to the undergraduate GPA compared to other advanced degree GPAs. The validity of college GPA is significantly larger in the hiring process of skilled jobs compare to other degrees of GPAs, followed by the master studies and the doctoral GPAs[17]. Hence, GPA persists in being a relevant selection tool[18]. It is considered a determining factor ensuring better skills and better performance in the workplace.
Studies have shown that the category of graduated workers is more affected by the unemployment during the country’s economic recessions. In EU, during the economic recession of 2008-2009, unemployment rates among those with tertiary education qualifications were higher than those with primary or secondary qualifications[19]. Therefore, youth education focus has been the agenda of many global institutions in many developing countries[20,21], as well as a popular reasearch topic among researchers in many Euroepean countries[22, 23]. According to the Institute of Labour Organization in the developing economies, the labour market has been characterizing by the vulnerability of young people in terms of (i) longer and more insecure school-to-work transitions, (ii) increased impassiveness from the labour market, (iii) higher unemployment, (iv) lower-quality jobs for those who find work[24]. The study examines the relationship between education and employment outcomes among youth in developing countries through the identification of qualifications mismatch and gives a contribution to the debate on how to address discrepancies more effectively between the youth labour market demand and supply.
The review of the literature revealed that political, economic, and social factors can affect the high unemployment rate among young people and that the impact depends on a country or region analyzed. Key aspects of active government labour market policies were analyzed in Albania, North Macedonia, and Bosnia and Herzegovina. The level of public expenditure on active labour market policies is very low for these countries and far from the EU average of 0,5 % of GDP[25]. Skilled people who cannot find a job in the formal sector accept jobs that are below to their qualifications or they work in the informal sector[26]. There is a relationship between youth unemployment and the determinants of the labour market flexibility for Balkan countries[27]. Where according to the “Economic Freedom” database of the Fraser Institute, the indicators of the labour market flexibility include the variables of employment barriers as the minimum wage, hiring regulations, collective bargaining, employment taxes costs and dismissals costs.
In Albania, higher education seems not to have effects on youth employment and it is not a guarantee for finding a job. This raises the question to what extent tertiary education is effectively geared to the labour market needs and the issue is further highlighted by the high level of skill mismatch. The mismatch implies that graduated workers with high education were over-qualified for their job. The graduated youth are particularly at risk in the labour market because they are neither improving their future employability through investment in skills nor gaining experience through employment. According to Institute of Statistics in Albania, people with secondary education have higher unemployment rates (14,4 %) followed by people with high education (12,3 %)[11]. A new law no 586, date 30.08.2019, was decreed by government of Albania, in order to stimulate meritocracy in new employments in public administration. The law on “Employment of excellence students in public administration institutions’ gives advantages of graduated students with 9 to 10 GPA at their bachelor or master studies, compared to their peers, to be employed in public institutions.
Although unemployment affects all segments of population in Bosnia and Herzegovina, youth aged group between 15 and 29 years are more affected by unemployment. This group of population accounts for about 1/4 of the total country population and a significant share of youth is working in the informal sector, under unfavorable conditions of low paying jobs, or being unemployed. During the years, structured policies approach that contribute to the long term youth employment, are neglected[28]. Kosovo is facing high youth unemployment mainly for two reasons. First, Kosovo’s labour market does not offer many job opportunities, hence, many youths remain unemployed for a long-term period. Second, due to the education system in Kosovo, youth is not well prepared to enter the labour market. Inappropriate or nonexistent skills make them less employable over a long-term period[29]. Youth unemployment rates in Montenegro remain relatively high and the job mismatch indicators point out the difficult ‘journey’ for young graduates into their first work experience and jobs. High educational levels have the lowest unemployment-to-employment ratio of all education levels, and there is a larger degree of over-qualification among the higher educated than among the intermediate levels. The highest share of unemployment is among young people aged 15–29 (25,8 % in 2017), making difficult the transition from school into employment. Quite positive in comparison to peer countries, the unemployment of young people is decreasing, which means that there is less ‘underutilization’ of youth potential[30]. In Serbia, young people are attracted to be enrolled in a tertiary education due to higher wages attained by university graduates, and to the limited job opportunities available in the labour market. Even though having a university degree provides some protection against unemployment, often jobs fail to match their degree qualifications. The unemployment rate of recent graduates is high[31]. In North Macedonia according to World Bank, the five priorities areas against the high youth unemployment are the lack of experience among young workers, the skills gap among the employees, the underemployment in jobs below their level of education, detached and not adequate labour market information between the firms and the educational systems, and labour market regulations regarding short-term contracts that disproportionally affect youth[32].
DEMOGRAPHIC AND LABOUR MARKET OVERVIEW
Albania and North Macedonia are two small countries located in the Western Balkan geographical area. The countries are characterized by similar economic and demographic factors. Both countries have experienced the long centralized economic system for almost half a century. The free market economic system was established only after the 1990-s. The following years have been associated with high rates of population emigration and low employment rates, especially during the first decade. Countries have experienced relatively high economic growth rates and are characterized by low GDP per capita as shown in Table 1 compared to other European countries 35,623 Us dollars[28].
| Indicators | Albania | North Macedonia |
| Population (in mln) | 2,86 | 2,08 |
| Real GDP growth (in %) | 3,81(3-rd Q) | 3,5 |
| GDP per capita (euro) | 4,68 | 5,462 |
| Employment (in %) | 60,7(3-rd Q) | 47,4 (3-rd Q) |
*Ministry of Finance and Economy, Albania. Ministry of Finance, North Macedonia and State Statistical Office, North Macedonia.
Both countries are characterized by a small population number and young median age population. The median age is 36,4 years in Albania and 39.1 years in North Macedonia[33]. While the median age of the entire EU population stands at 42,6 years[34]. Although economic and labour market performance differs between selected countries, they have in common many challenges as all the western Balkan countries. Labour market of the western Balkan countries is characterized by low participation and employment rates. Croatia has the highest employment rate followed by Albania, Serbia, North Macedonia, and Montenegro. The situation is worse in Kosovo with only 24,8 % of the labour force employed. They share the problem of high unemployment rates compared to the EU-28 average of 7,4 %. Kosovo followed by North Macedonia, Bosnia and Herzegovina and Montenegro have the highest unemployment rates (Table 2).
| EU (European Union 28) | 7,40% | 73,10% |
| Albania | 12,30% | 61,40% |
| Bosnia and Herzegovina | 18,40% | 35,20% |
| Croatia | 6,60% | 62,20% |
| Kosovo | 25,70% | 30,70% |
| North Macedonia | 21,60% | 48,10% |
| Montenegro | 16,10% | 47,50% |
| Serbia | 13,50% | 49,70% |
*CEIC, Eurostat; Statista; Countries Employment/Unemployment Rates; ILOSTAT; SDG indicators; OECD.stat.
All countries, except Croatia, experienced high unemployment rates, especially in the youth population category. The phenomenon of the youth age category unemployment is also high and persistent in Western Balkan countries. Comparing youth unemployment rates of the EU-28 average of 14,9 %, it may be concluded that youth in the EU countries are more likely to get the job than their peers from the Western Balkans. Though declining, unemployment among young people remained high in several countries of the region, ranging from countries with very severe youth unemployment rates as Kosovo, followed by Bosnia and Herzegovina and North Macedonia. North Macedonia is characterized by the lowest decrease range of unemployment rate with only 2,6 % during the last 5 years compared to other countries. Although the rate fell to 35 % in 2018, it was twice as high as the EU average[35]. Comparing youth unemployment rates with the EU-28 average, it may be concluded that youth in the EU countries are more likely to get a job than their peers from the Western Balkans (Table 3).
| 2015 | 2019 | |
| European Union 28 | 20,3 | 14,9 |
| Albania | 39,8 | 28,63 |
| Bosnia and Herzegovina | 62,3 | 46,12 |
| Croatia | 42,3 | 17,82 |
| Kosovo | 57,7 | 48,92 |
| North Macedonia | 47,3 | 44,74 |
| Montenegro | 37,6 | 29,11 |
| Serbia | 43,2 | 32,23 |
*Statista; Trading-Economics; Countries statistics; ILOSTAT; SDG indicators; OECD.
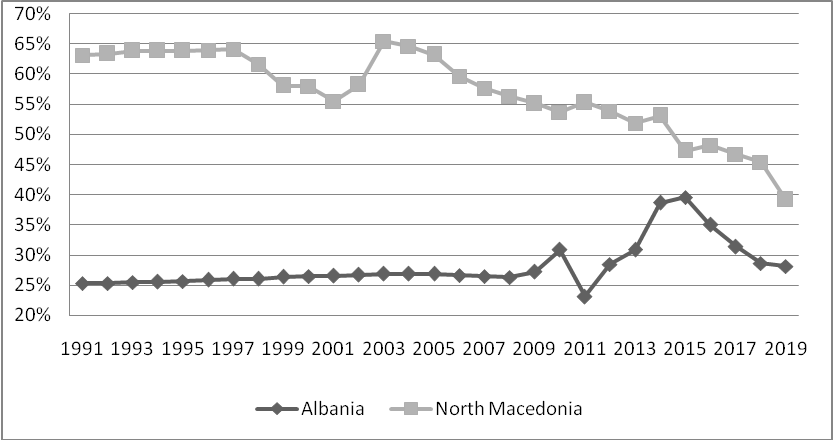
Youth unemployment rates of North Macedonia have been in the highest levels after the 1990-s (Figure 1). In 1991 the youth unemployment rate in Albania was 25 % and in North Macedonia 63 %. However, during the last two decades, there have been continuous decreases but still not satisfying compare to other west Balkan countries. Both countries have continued experiencing high youth unemployment rates during the last decades. Despite the very low decreases in unemployment rates, Albania is slightly in better condition compared to its neighbor country North Macedonia. In 2019 youth unemployment ranged from 28 % in Albania to 32 % in North Macedonia.
*Macrotrends.net. Youth Unemployment Rate 1991-2020 of Albania and North Macedonia.
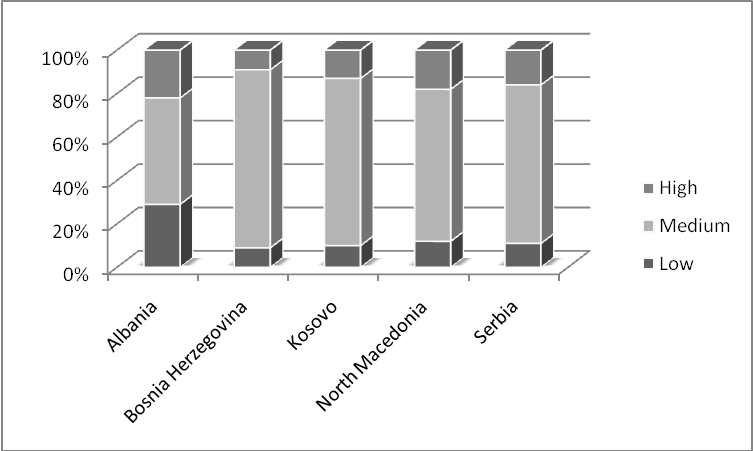
In terms of education, the largest share of unemployed young people in all the western Balkan countries were those with a medium level of education ranging from 50 % in Albania to 83 % in Bosnia and Herzegovina[36]. Unemployed youth with tertiary education seems to be more likely in high rates in Albania, North Macedonia, Serbia, Kosovo, and lastly in Bosnia Herzegovina.
*World Bank Group and The Vienna Institute for International Studies, 2019. SEE Jobs Gateway Database, based on data provided by national statistical offices and Eurostat. Note: Missing data information for Montenegro
METHODOLOGY
Online questionnaires are delivered to students of university Luigj Gurakuqi in Albania and South East European university in North Macedonia. LG university located in Shkodra city with a population of 77,000 inhabitants, is positioned in the northwest of Albania. SEE university located in Tetovo city with a population of 52,000 inhabitants, is positioned in the statistical region of Polog in the northwest of North Macedonia. Polog borders Kosovo and Albania. The quantitative analyses of the youth unemployment have taken into consideration the geographical vicinity of the Shkodra city and Tetovo city, and similarity in their small population size. Furthermore, the same graduation economics program offered by both universities is taken into account. The questionnaire is organized into three sections: the first section includes respondents characteristics such as age, gender, labour status, etc.; the second section includes questions to the employed graduates, while the third section to the unemployed graduates. The samples are the cohort of students who graduated in the last decade during the academic years 2009 until 2019, in both universities, responded to the questionnaires. There have been 175 answers from graduated students of the faculty of Economics of LG University and 92 answers from SEE University. Both universities ‘students pertain to the age category 21-30 years old. Descriptive statistics of the questionnaire’s results are presented. A multivariate logistic analysis is performed for evaluation of the relationship between predictor variables and graduate employability.
Logistic regression is also known as the logit regression or logit model is a statistical technique used with sigmoid function. The logit regression it’s an S-shaped curve that can take any real-valued number and map it into a value between 0 and 1, but never exactly at those limits. It is named so because it uses a Sigmoid curve or function which is of “S” shape and is a special case of the logistic function.
In logistic regression, the dependent variable is a binary variable that contains data coded as 1 (e.g. yes, success, etc.) or 0 (e.g. no, failure, etc.)[37, 38]. Often referred to as a binary classifier, it is used when the dependent variable has two possible outcomes and is categorical. It works with binary data and is used in our model to estimate the probability of the employability of the graduate students and answers 1-employed and 2 not-employed. The “log-odds” of the dependent variable’s probability is modeled by a linear combination of independent variables:
The logit function is defined as the logged odds of probability p:
The exploratory variables in our model are gender, age, civil status graduation year of the students, education level, and GPA of graduates. The model is validated for accuracy and precision. The confusion matrix[39] and receiver operating characteristic (ROC) curve are used for testing the model performance. These are standard techniques for summarizing classifier performance over a range of trade-offs between true positives, false positives, and error rates[40]. Statistical software R is used for econometric analyses.
RESULTS
DESCRIPTIVE ANALYSIS
LG UNIVERSITY GRADUATE STUDENTS
The questionnaire was responded to by 62,8 % of graduate female students of which 44,5 % were employed. Results indicate a higher percentage of male employment compare to female graduate students. The employment status of the graduated students shows that 47,4 % of them are employed, while 52,6 % are unemployed. The dominant age category of unemployed graduate students is the age category 21-25 years with 62,8 % (Table 4).
*Author’s calculation. There is a significant association between age categories and employment status.
*Author’s calculation. There is a significant association between level of education and employment status.
The employment status as per the level of education (Table 6) demonstrates higher employed students with master education followed by students frequenting master and bachelor studies. While most of the unemployed students pertain to the category of the bachelor education level, followed by frequenting the master program and lastly with master education.
The employment status of graduate students is related significantly with time (Table 6). It takes time for graduates after completing their studies to find a job. The number of unemployed students is high, a short time after graduation, while it is reduced with the passing of the years.
*Author’s calculation. There is a significant association between graduation year and employment status.
The employment status of graduates’ students depends on the GPA of the bachelor studies. Table 7 shows that the excellent graduates with above 9 GPA are mostly employed, while the graduate students with 5-6 passing GPA are mostly unemployed.
*Author’s calculation. We can reject the null hypothesis and conclude there is a relationship between bachelor GPA and employment status.
SEE UNIVERSITY GRADUATE STUDENTS
Analyzing the employment status of SEEU graduates, the data show that 52 % of repondents are male and they are more likely to be employed compared to female graduate students. While 80,4 % of the graduates are employed, most of them (83,5 %) are within the age category 25-30 years old (Table 8).
| Age | Employed | Unemployed | Total | |||
| # of students | % | # of students | % | # of students | % | |
| 21-25 years | 8 | 61,5 | 5 | 38,5 | 13 | 14,1 |
| 25-30 years | 66 | 83,5 | 13 | 16,5 | 79 | 85,9 |
| Total | 74 | 80,4 | 18 | 19,6 | 92 | 100,0 |
| chi2(1) = 3,4, p = 0,06, Fisher’s exact = 0,123 | ||||||
*Author’s calculation. There is not a significant association between age categories and employment status.
The employment status based on the level of education demonstrates low differences between the different programs as presented in Table 9. The share of employed students with master education is higher compared to students frequenting master and bachelor studies.
*Author’s calculation. There is not a significant association between level of education and employment status.
*Author’s calculation. There is not a significant association between graduation year and employment status.
The employment status of the graduate students is related to time, however not significantly. As can be shown in Table 10 there are higher unemployment rates of the graduated students in the last years, however, the employment rates are higher compared to LG University.
The GPA of bachelor studies has an impact on the employment status of graduates. Graduates with 8 GPA and above are mostly employed, while the graduate students with 6-7 passing GPA are mostly unemployed (Table 11). South East University is conducting employability survey of their graduates each year and the last report indicate that economics graduates have an employment rate of 76,5 %, employability increases with GPA and they are mostly employed in the trade sector (48,9 %)[41].
*Author’s calculation. There is no relationship between bachelor GPA and employment status.
REASONS FOR NOT FINDING A JOB
The main reasons for not finding a job are given in Table 12. Low labour market demand for graduates of both universities is indicated as the main reason for not finding a job; followed by no information for vacancies and no efficiency of government labour offices; demand of work experience from the employer; personal life interests as child growth or elderly care; high supply of graduates in the labour market and interest in a personal start-up business.
Education efficiency in finding a proper job is perceived differently from the graduates of two universities (Table 13). At LG University, 25 % of the graduates consider education, not a factor in finding a proper job, while of the same opinion are 17 % of their counterparts at SEE University. While education is considered a ‘very much’ efficient factor in finding the proper job from both countries universities’ graduates with approximately 27 to 28 % of employed students.
One of the main causes of not finding a proper job that matches with the finished education is perceived the passive government education reforms, which create surpluses and shortages of graduates at the labour market. This is followed by the lack of work experience of graduate students required from the employers, the economic crises, etc (Table 14).
| LG university | SEE university | |
| Not at all | 25% | 17% |
| A little | 7% | 22% |
| Enough | 20% | 33% |
| Much | 21% | 0% |
| Very much | 27% | 28% |
LOGISTIC REGRESSIONRESULTS
LG UNIVERSITY
The logistic model results indicate that the explanatory gender and age variables are both significant at a 99 % significance level (Table 15). These variables contribute to the accuracy of the employment model. The variable of graduated master students is significant at a 95 % level of confidence; while the variable frequenting the master studies is not significant. The GPA of the bachelor program indicates an important role in the employment of graduates with a significance level of 95 %, with emphasis on the GPA of 7-8, and above 9. The civil status of single or married graduate students is not significant in the model.
*Statistically significant at ** 1 % ; and at * 5 %
With 99 % of significance, the below variables are interpreted. The impact size of the logistic regression coefficients is translated into odds ratio. If all other variables are the same, the coefficient of the gender male variable can be interpreted as the odds of males being unemployed over the odds of females is 0,315. In other words, in terms of gender, the odds of males being unemployed is 31,5 %; or 68,5 % lower than the odds of females, holding all other variables fixed. The odds of a 25-30 years graduated student being unemployed is 0,286 or 71,4 % lower to a 20-25 years graduate student, holding all other variables fixed.
With 95 % significance, the below variables are interpreted. The students that have finished master’s have the odds of being unemployed of 0,325 compare to the graduates in bachelor's; or 67,5 % lower than the odds of the graduate’s students in the bachelor program. Attending regularly master studies has no significance in the model. Students who graduated within a bachelor with a 7-8 GPA have the odds of being unemployed at 0,345 or 65,5 % lower than other graduate student’s odds. While students who graduate with GPA above 9 have the odds of being unemployed at 0,061 or 93,9 % lower than the odds of the other graduate students- that is a plausible result. On the other side, the 8-9 GPA of the graduate students is not significant at the model and presents an atypical result.
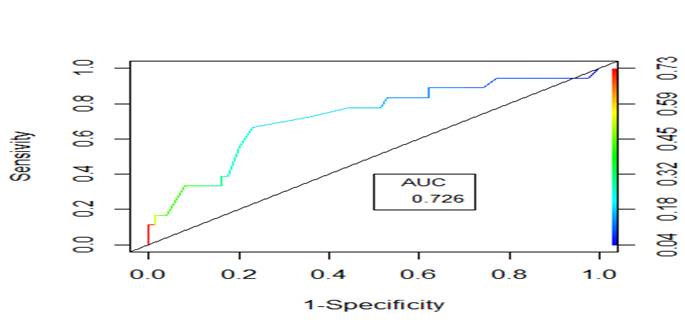
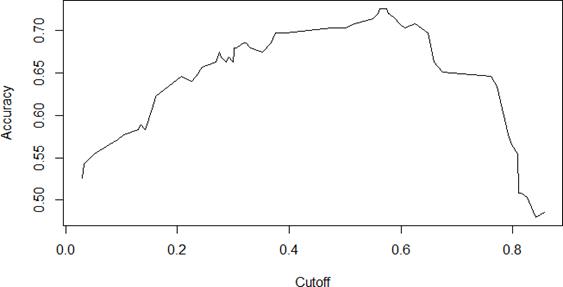
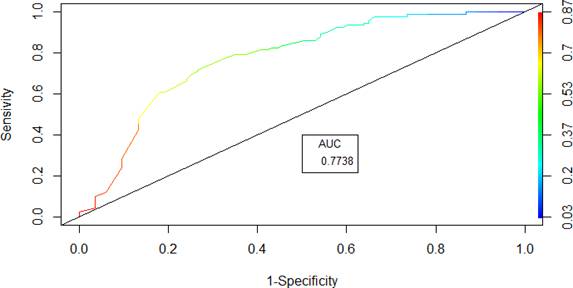
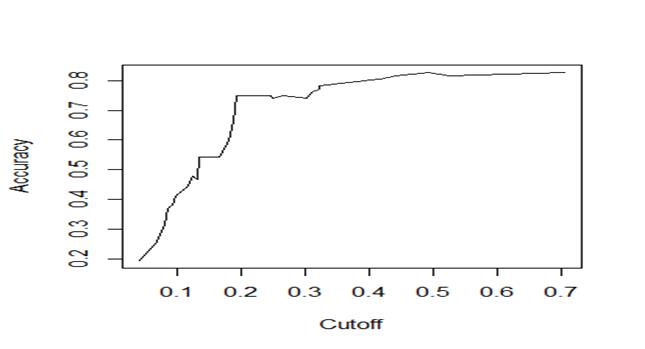
To make use of the accuracy values of the model, the ROC curve is presented (Figure 3). A useful tool in predicting the probabilities of the binary outcomes employed not employed is the ROC. The plot below shows how good the model is at predicting the positive outcome when the actual outcome is positive. The accuracy of the test is 0,7738, which is a good index for the model accuracy (Figure 4).
SEE UNIVERSITY
The regression model of the SEE University data shows that none of the independent variables is significant. An exception makes the GPA variable, specifically the 8-9 GPA statistically significant at p < 0,1 which is relatively low. High GPA 8-9 of the graduates’ students have a stronger impact than any other variable included in the model (Table 16).
*Statistically significant at ‘ 10 %
Even though almost all probabilities of the included variables show no significance in the model, still the test of the model performance for sensitivity and with accuracy index is presented. The plot below shows how good the model is at predicting the positive outcome when the actual outcome is positive. The accuracy of the test is 0,7257, which is a good index of the model accuracy but not as good as the accuracy of the model of LG University of 0,7738 (Figure 5 and 6).
CONCLUSION
As higher education is considered an investment in the persons’ life in time, money, and efforts, the objective of this study is to analyze the transition from tertiary education studies to the labour market. High school graduates often decide to continue university education for better job perspectives and advancement. High education is often perceived as a guarantee for employment. However, statistics show that youth employment faces many challenges and has lower rates compared to other categories of the population. Descriptive analysis and logistic regression is used to estimate the correlation between graduated youth employment and the various explanatory variables. The conclusions of the study are as follows. The unemployment rates are higher in the Western Balkan countries compared to the average of European countries. The unemployment rates of the youth age category 15-24 years in west Balkan countries are higher compared to the average of European countries. Employment of graduated youth faces many challenges such as local labour market demand, the divergence between education and job positions, etc. Labour markets with high unemployment rates are an indicator of either labour demand and supply high mismatch rates or a bad fit between the education system output and labour market demand, or a combination of both. Passive government education reforms of labour market demand have consequences in surpluses and shortages of graduates in the labour market.
Regression analyses of the graduated student’s questionnaires of the LG University in Albania show that the GPA of the bachelor program plays a crucial role in being employed. As educational attainment becomes increasingly more important in employments settings, higher undergraduate GPA is an important determinant in the employment process. A higher GPA of bachelor studies makes an advantage in the selection process of the graduated youth in the labour market in Albania. LG university logit model results show also other significant variables to the students’ graduate’s employment. There is a relationship between the gender and employment status of the graduates’ students. Males have higher probabilities of being employed compare to their counterparts females. Time plays a crucial factor in employment. Students of age category 21-25 years have a higher probability of being unemployed compare to the older category 25-30 years. The education level of the graduated program is significant in their employment. Students who graduated from the master,s program have a higher probability of being employed rather than students who graduated with the bachelor program. While being enrolled and frequenting the master studies does not affect their employment status.
Regression analyses of the graduated students of the SEE University in North Macedonia show no significance of all the independent variables included in the model, except of the GPA variable. The GPA variable, specifically the 8-9 GPA is at the margin of statistical significance (p < 0,0623) close to being statistically significant (p = 0,055).
For policy-makers, this study shows the importance of better cooperation with high educational institutions to develop adaptive curricula for the labour market. If Albania and North Macedonia will enter into the EU in the next years, facing the European market competition, an urgent need is the rethinking of the process. Although new law is decreed to stimulate meritocracy in employment of excellent students in public administration, by government of Albania, their peers might lack employment opportunities for long time. International institutions as the International Labour Organisation, etc. might help in the process of improving the capacity of the country’s local institutions for improvements to the youth employment policy-making process. There are many interesting issues open to be further investigated. It would be interesting to conduct an in-depth analysis of more inclusive variables, as well as using panel statistical data to make comparison between different non-EU and EU countries.

