1. Introduction
Progress in geologic and geophysical analysis relies on advanced cartographic visualization. This deep ontological, conceptual and technical connection between the Earth science disciplines has led to a variety of developed cartographic software, algorithms and methods which help geologic and geophysical data modeling and mapping. The epoch of big geospatial data presents new technical challenges in contemporary cartography which aims at effective and precise data processing and visualization with minimized handmade routines and increased speed of mapping. Therefore, the use of scripting console-based mapping in addition to a menu-based Geographic Information System (GIS), as presented in this paper, opens up new ways in the geological and geophysical mapping of Ghana.
Up to now there were only GIS-based applications in mapping Ghana at the regional country-level scale. Existing geological and environmental maps of Ghana for the purpose of environmental assessment are provided by relevant publications at the national scale. These include studies of flood hazards (Amoako and Boamah 2015,Ansah et al. 2020), investigations on gold deposits with geological maps, geochemical plots and diagrams (Amponsah et al. 2015), hazard and risk disaster mapping (Adu-Gyamfi et al. 2021), civil engineering and road construction (Ahenkorah et al. 2018).
Through this research, we were able to use the powerful functionality of both GMT and Quantum GIS (QGIS) to reflect the geophysical and geologic setting of the country from various data sources based on integrated approaches for accurate semi-automated mapping of Ghana, which is one of the significant advantages of this paper. Thus, this paper presented the combined cartographic method using GMT and QGIS for handling geospatial data to represent topographic, geologic and geophysical phenomena in Ghana with a twofold goal:
The cartographic goal is to present a series of the five new thematic maps on Ghana prepared by the sequential use of the QGIS and GMT techniques: a topographic raster layer representing terrain relief and geophysical layers of geoid and gravity grids, an overlay and geologic vector map prepared in the QGIS environment.
The geophysical goal is to analyze the gravity anomaly fields, geoid and topographic elevations to demonstrate the effects of the geology on the surface topographic and geophysical setting. The comparative analysis of maps aims to illustrate the correlation between the topography, geophysics and geology of Ghana.
2. Mapping Software
Recently, geologic research has focused on advanced solutions for data analysis and mapping (Sylvester and Attoh 1992,Attoh 1998,Lindh and Lemenkova 2021,Allibone et al. 2002,Lemenkov and Lemenkova 2021b). However, previous studies used traditional methods of plotting for data visualization with limited functionality to perform mapping by automated approaches, such as Generic Mapping Tools (GMT). Among various methods in geosciences, data analysis and mapping are the most widely used approaches (Klaučo et al. 2013, Lemenkov and Lemenkova 2021c). As for GIS, it remains a major method in mapping (Owusu-Nimo et al. 2018,Osei et al. 2021,Lemenkova et al. 2012,Suetova et al. 2005,Lemenkova 2021c,Gohl et al. 2006,Schenke and Lemenkova 2008). In contrast to the traditional GIS mapping methods, the GMT technique is less subjective and more functional, as it can perform mapping using repetitive scripts. However, due to the increased functionality of the scripting techniques for data processing, in particular in relation to the large datasets with global coverage, using a GMT cartographic toolset might be an effective way of cartographic data visualization (Wessel et al. 2019).
Although GIS software based on the conventional Graphical User Interface (GUI) can be used for mapping large amounts of geospatial data due to an easy interface and simpler functionality (Appiah 1991,Boher et al. 1992,Verutes et al. 2012,Eisenlohr and Hirdes 1992,Engstrom et al. 2013), there is an inherent potential for human-induced errors because of the workflow routine of mapping. Therefore, it is uncertain whether GIS will function effectively when processing multi-source large spatial data as is often the case in geologic mapping of Africa (Black and Fabre 1983,Loh and Hirdes 1996,1999,Perrouty et al. 2012). The traditional GIS has a straightforward way of mapping through GUI and an extended menu with a variety of functions for vector and raster types of data. At the same time, a complex mapping project functions best when adopting all the available data formats which might include native .shp formats finely readable by a compatible and open source QGIS.
In contrast to the traditional GIS, GMT provides a console-based machine learning approach for spatial processing (Lemenkova, 2021a,2021d). Flexibly combining these mapping approaches enables taking the advantages of both and increases mapping functionality. The sophisticated scripting of GMT is particularly well suited to cartographic visualization due to the extended functionality of the individual modules controlling map elements: finely adjusted colour palettes, legend placement and depiction, graticule ticks, clipping and translucency, compatibility with the Geospatial Data Abstraction Library (GDAL), hierarchical annotations using a variety of fonts, operating with various data formats, etc. For this reason, GMT is widely used in geophysics (Gauger et al. 2007,Lemenkova 2021a,2019b,2019c,Kuhn et al. 2006,Gorman et al. 2008).
3. Study Area and Dataset
Ghana, located in west Africa (Fig.1), is a country exceptionally rich in resources. These include both mineral resources of precious geologic deposits - gold, diamonds, bauxite, manganese ore, oil, aluminium (Amankwah and Anim-Sackey 2003,Nyame 2008,Ayanoore 2020) and environmental resources of high commercial value - forest timber, plants, agricultural products, cocoa, horticultural crops (Ahoa et al. 2020,Williams et al. 2019,Abdulai et al. 2017).
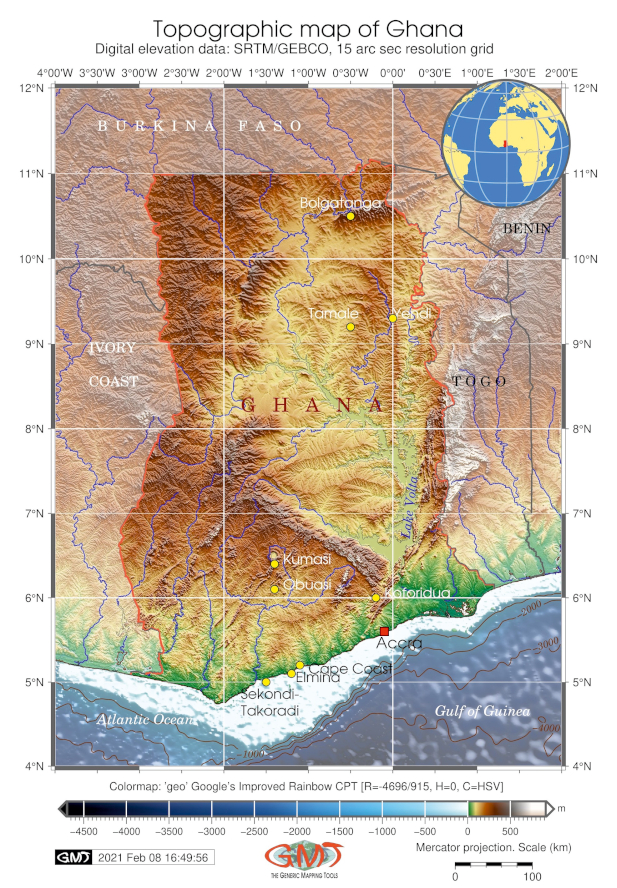
Fig. 1 Topographic map of Ghana using the GEBCO dataset. Mapping: GMT. Source: author. / Slika 1. Topografska karta Gane izrađena s pomoću podataka GEBCO. Kartiranje: GMT. Izvor: autorica
Ghana was ranked the 1st country in Africa according to gold deposits in 2019 with 130 t of yearly gold production (Mining.com 2019). The orogenic gold deposits of Ghana were formed as a result of the long-term geologic evolution of the region which included the meta-sedimentary successions of Ghana form part of the Birimian Paleoproterozoic West African Craton (Chudasama et al. 2016,Kalsbeek et al. 2020,Davis et al. 1994,Feybesse et al. 2006,Block et al. 2016).
Established gold belts of Ghana include the regions of Ashanti Fault, Kumasi Basin and Sefwi-Bibiani. The orogenic gold mineral deposits in southern Ghana were extensively studied and resulted in regular reports on the distribution and origin of gold (see inter aliaAdu-Baffour et al. 2021,Harcouët et al. 2007,Perrouty et al. 2016,Dzigbodi-Adjimah and Nana Asamoah 2009,Hilson 2002,Benshaul-Tolonen et al. 2019).
Other natural resources of Ghana include renewable energy potential presented by a variety of sources (Ankrah and Lin 2020). The most significant is the hydropower sector, presented by the hydroelectric Akosombo (Volta) Dam on the Volta River which enabled the completion of construction of a plant for producing aluminium from bauxite at the supplemented Kpong Dam. Other hydro-energy resources of Ghana include the Lower Pra River Basin and Volta tributaries (Arthur et al. 2020). In addition, solar, geothermal and wind energy may be developed to become important energy sources in Ghana (Essandoh-Yeddu 1997,Danso et al. 2021,Nuru et al. 2021).
Central challenges in this study include the twofold aspects of cartographic data processing.
First, the present study is a data-driven project based on the open-source datasets covering Ghana. Recent technical progress in data capture and organized geological surveys resulted in the available materials, such as high-resolution GEBCO (Fig.1), USGS geologic data (Fig.2), geoid (Fig.3) or gravity grids (Fig.4 and5), that enable the use of reliable Earth observation datasets. The accuracy of mapping is therefore ensured through the high-quality raw datasets. Using high-resolution EGM-2008 data facilitates detection of variation in geoid undulations with unprecedentedly high details. High-resolution satellite-derived gravity grids provide a source for fine-resolution mapping of geophysical fields and analysis of variations with respect to the topography of Ghana. Since the geoid reflects variations in the land masses that correspond well to the topography of the terrain with unique patterns, it can be compared with the topographic and gravity maps.
Second, this study employs GMT scripting methods for mapping several maps. Automatic data processing and plotting are the major challenges in digital cartography. Automated visualization is an important task because of the increased speed of data processing, accuracy and precision of visualization and fewer human-induced errors. Besides, the advantages of scripts consist in code repeatability so it can be reused in similar studies. This enables rapid processing of large volumes of data. Automated GMT techniques facilitate the cartographic workflow and enable focusing on geographical analysis. Thus, a comparative analysis of maps reveals similar geological and geophysical features on the visualized maps through an analysis of isolines contouring fields and distribution of objects. By contrast, GIS mapping can result in human-induced mistakes and accidental errors during plotting, because traditional mapping is a time-consuming and subjective process. Therefore, accurate automated mapping is a challenging problem in modern cartography, demonstrated in the Methodology section. Thus, using GMT presents a breakthrough in contemporary cartography applied in geologic, topographic and geophysical analysis.
The datasets used in this paper include the following materials:
General Bathymetric Chart of the Oceans (GEBCO) gridded data covering the topography and bathymetry of the Earth with unprecedentedly high resolution of 15 arc-second, i.e. ca. 450 m (Schenke 2016,GEBCO Compilation Group 2020).
Earth Gravitational Model of 2008 (EGM-2008) by the National Geospatial-Intelligence Agency (NGA) EGM Development Team (Pavlis et al. 2012).
Gravity satellite derived data from the CryoSat-2 and Jason-1 showing Faye's and Bouguer reduction models (Sandwell et al. 2014).
Geologic layers in ArcGIS .shp file formats showing the surficial geology and geologic provinces of Africa by the United States Geological Survey (USGS) datasets (Persits et al. 1997).
Geologic layers in ArcGIS .shp file formats showing the surficial geology and geologic provinces of Africa by the United States Geological Survey (USGS) datasets (Persits et al. 1997).
The research also references the Digital Chart of the World (DCW) developed in 1992 by the U.S. Defense Mapping Agency's (DMA) and National Imagery and Mapping Agency (NIMA) as a vector data product representing the borders of the World's countries (Defense Mapping Agency 1992) and evaluated for Africa (Goff 1994). The DCW was used for clipping the area of Ghana over the transparent background and for a global insert map inFig.1.
4. Analysis of Geophysical Features over Ghana
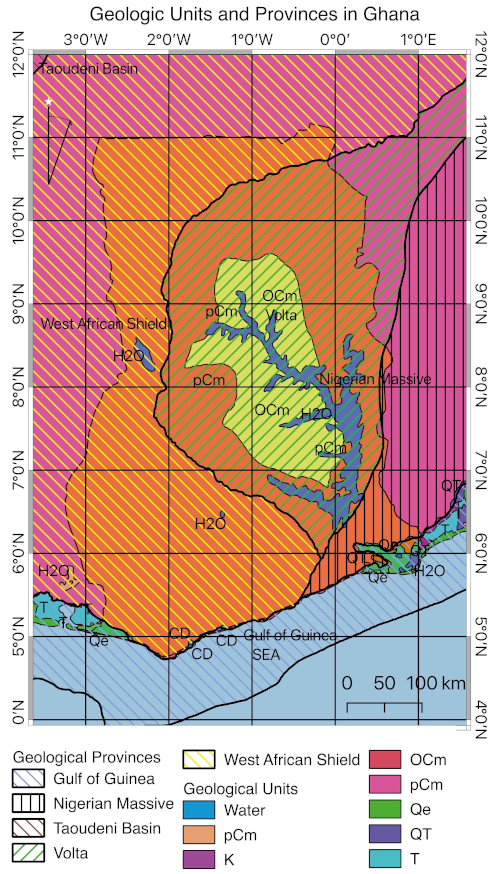
Fig. 2 Geologic map of Ghana based on USGS data. Mapping: QGIS. Source: author. / Slika 2. Geološka karta Gane izrađena na temelju podataka USGS-a. Kartiranje: QGIS. Izvor: autorica
The geologic mapping was performed using QGIS software (QGIS.org 2021). First, a GIS project was generated in a QGIS environment, where the input vector layers were uploaded (Persits et al. 1997) in the European Petroleum Survey Group (EPSG) standard EPSG:4326 - World Geodetic System (WGS) of 1984 WGS-84 projections, and the layout (Fig.2) was generated using the Layout Manager options. The Digital Chart of the World (DCW) was used as a clipping mask layer for Ghana as a comprehensive reliable vector cartographic layer (Goff 1994).
4.1 Mapping geologic units
The geologic provinces of Ghana visualized inFig.2 include the outcrops of rocks from the following geologic period units: Ordovician Cambrian (OCm), Precambrian and Cambrian (pCm), Cretaceous (K), Quaternary Tertiary (QT), Quaternary eolian (Qe) and Tertiary (T). The eolian fraction of the late Quaternary (Qe) sediments points at climate variations and change in the tropical region of Ghana since the Quaternary enabling the reconstruction of the regional climate changes based on the geological records of the past sediments.
The disposition of the geologic units shows the tectonic and stratigraphic correlations between the Precambrian and Lower Paleozoic Volta River Basin and the Pan African orogenic belt of West Africa. Moreover, the location of the Early Proterozoic Birimian Supergroup of Ghana is largely associated with gold mineralization in Ghana.
4.2 Mapping geologic provinces
The geologic provinces of Ghana include the Gulf of Guinea, Nigerian Massif, Taoudeni Basin, Volta River Basin and the West African Shield. The Volta Basin presents the structural geologic core of the region, while the Nigerian Massif is distributed on the east of the country and the West African Shield on the west, respectively. A three-phase geodynamic evolution of the Volta Basin of Ghana (light green colour inFig.2) was structured byAffaton (1990) divided into three groups:
deposition of craton-margin sandstones (Bombouaka Supergroup),
sedimentation marginal to a Pan-African oceanic domain (Pendjari-Oti Supergroup),
development of a foreland basin where molassic sediments of the Tamale Supergroup were poured. Deynoux et al. (2006) discussed the geologic properties of the 3 major units (megasequences) of the Volta Basin (green colour in Fig. 2): 1 Bombouaka, 2 Pendjari-Oti, 3 Tamale, serving as marker horizons to constrain inter-basin correlations between the geologic units of Ghana. However, the period of the sequential evolution from the rift- to collision-related sedimentation in these provinces of Ghana differed regionally.
The GMT consists in a console-based scripting approach, which differs from traditional GIS, such as QGIS. Parameters are set in special GMT modules to allow the cartographic elements on all plots to be visualized based on the settings (flags) in the shell script for each element (colour palette, grid specification, annotations, layers translucency and order of appearance). The specific commands used for mappingFig.1,3,4 and5 are provided with explanations below.
4.3. Topographic mapping
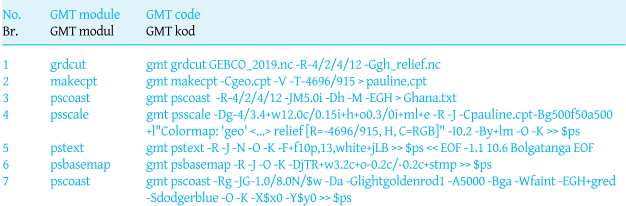
Fig.1 was mapped based on the GEBCO grid which contains information about the topography of Ghana. The examples of the GMT codes used forFigure 1 are presented inTable 1. Specifically, the image was determined using the coordinate extent of the country using clipping from the global grid, using code No. 1. The colour palette was defined using the extremes of the elevations using 'geo' embedded color palette of GMT, using code No. 2. The vector layer mask was generated from the DCW of the country's polygon using code No. 3. The legend was placed below the main map using the 'psscale' module using code No. 4. The annotations were added using the example of code No. 5. The global insert map was defined using the combination of 'psbasemap' and 'pscoast' modules as follows using code No. 6. The country code for Ghana was accepted from the ISO 3166-1 alpha-2 standard. The drawing of the insert map was done using code No. 7 inTable 1.
Table 1. GMT codes used for plottingFig.1 (Topographic map of Ghana). / Tablica 1. GMT kodovi upotrijebljeni za iscrtavanjesl.1 (topografska karta Gane).
4.4 Geophysical mapping
Mapping geoid and free-air gravity in Faye's and Bouguer corrections followed a similar scheme using the general GMT modules such as 'pscoast', 'makecpt', 'grdimage', 'pstext', 'psbasemap' and 'psscale' using the same Mercator projection. The codes using for plotting geophysical maps (Fig.3,4 and5) are presented inTable 2.. Here the 'grdconvert' module was applied for the EGM-2008 data re-formatting using code No. 1, following the example (Lemenkova, 2020a). The isolines on the geoid map (Fig.3) were plotted with an interval of 0.25 m by code No. 2. Plotting isolines provides information on the distribution of fields over the area enabling the assessment of the proximity of values, which are determined by the geologic and geophysical setting of the region, including rock density, topography and tectonic lineaments. Adding coastlines, borders and a river network was performed using the GMT 'pscoast' by code No. 3. The free-air gravity in Faye's reduction (Fig.4) was extracted as a subset of an img file in the Mercator projection by code No. 4. This file was then clipped using the coordinate extent of the study area and saved as netCDF format by code No. 5. The same procedure was repeated for the Bouguer correction (Fig.5).
Table 2. GMT codes used for geophysical mapping (Fig.3,4 and5). / Tablica 2. GMT kodovi upotrijebljeni za geofizičko kartiranje (sl.3,4 i5).
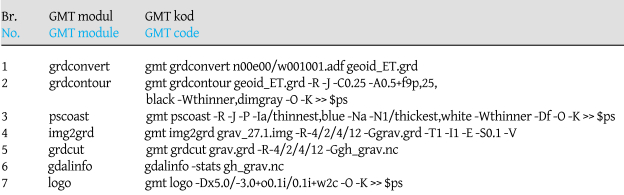
The extremes of the gravity grid were then assessed using the 'gdalinfo' GDAL utility using code No. 6. The GDAL Library is used both for handling and reformatting geospatial data (Lemenkova, 2020b,2021b). The results of the evaluation revealed the following data: Minimum=−66.055, Maximum=92.523, Mean=7.462, StdDev=20.665. The same process was repeated for the Bouguer grid (Fig.5) with the following outcome: It takes values from Minimum=−126.055 to Maximum=157.26, Mean=0.267, StdDev=12.482. According to the data scope, both grids (Fig.4 and5) were visualized using the 'jet' and 'seis' colour palettes. The GMT logo was plotted on all the maps using code No. 7.
To summarize the methodology, the GMT console-based scripting method for cartographic data processing is to a certain extent similar to programming such as in Python or R (Lemenkova, 2019d,2019a). It adds the lines of code using modules processed by the GMT syntax, and then executes the scripts from the console and presents the graphical output of the map. The final maps are saved by the 'psconvert' module using the PostScript format into the graphical standard output (JPG, TIFF).
5. Results and Discussion
There are several aspects of the results of this work that should be pointed out separately:
Modelling the/a geoid shows the variability of the geoid undulations over the region of Ghana with increased values in the SW.
Modelling free-air gravity in Faye's and Bouguer reductions mirrors the large topographic structures (e.g. the long Kwahu Plateau extending diagonally in the southern Ghana).
The topography is reflected in the spatial distribution of the geologic units and basins (Volta Basin, White Volta, Black Volta, Oti River).
Hence, the developed maps were used to study the relationships and comparisons between the geophysical fields, geologic units and provinces, and topographic structures of the country based on the input of high-resolution data. For each of these maps, data were processed using the Mercator projection for compatibility of the grids.
The topography data (Fig.1) after inspection had the data extremes ranging from −4696 m (Atlantic Ocean, Gulf of Guinea) up to 915 m (including elevations of the neighbouring countries: Togo, Burkina Faso, Ivory Coast), with a mean of −206.102 m and standard deviation at 1146.375 m. The highest point of Ghana was noted at the summit of Mt. Afadja at 885 m according to the GEBCO grid, located in the east of the country on the border with Togo in the Volta Lake region.
Fig. 3 Geoid model of Ghana using the EGM-2008 dataset. Mapping: GMT. Source: author. / Slika 3. Geoidni model Gane izrađen na temelju podataka EGM-2008. Kartiranje: GMT. Izvor: autor
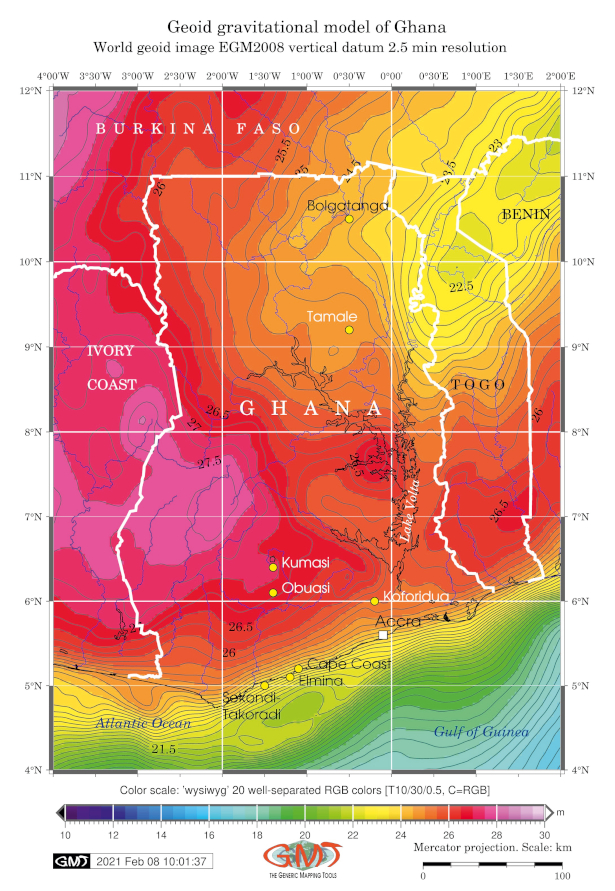
The obtained results for geoid undulations (Fig.3) were checked using the 'gdalinfo' utility using the command: "gdalinfo geoid_GH.grd -stats". The data ranges from minimum=−32.535 m to a maximum=65.174 with mean=24.730 and standard deviation (StdDev)=21.013. In order to check the calculated values with respect to the geologic map (Fig.2), the maps were compared by overlaying the polygons of the geologic provinces on the basis of which the distribution of the geoid fields was determined were marked they cross and overlap the geologic units and provinces of Ghana. It was detected that the maximal geoid values (values more than 27 m, coloured pink inFig.3) mostly extend over the Precambrian outcrops, while the minimal terrestrial values (22-23 m), not including the Gulf of Guinea, are mostly located in the NE region of the country, which corresponds to the Cambrian rocks of the Volta Basin.
It must be pointed out that in an effort to study the geologic and geophysical setting of Ghana visualization of geoid and gravity anomalies must be embedded into a more comprehensive framework using more detailed data. In this study, using cartographic representation methods, geology is reported to affect both the geophysical and topographic setting of the country by observing that the differences in those values are not universal and tend to be dependent on regional and local geology instead. A series of investigations on the impact of geology and geologic development on the geophysical setting and topography can further be continued using this study as a basis to explore the existence of bias phenomenon on comparative analysis of the topography and geology of the west African region. Both GMT and GIS in this study have shown that both scripting and traditional techniques consistently tend to perform well in the cartographic workflow, however, the GMT demonstrates more automation in techniques.
The free-air gravity maps visualized inFig.4 and5 for Faye's and Bouguer reductions, respectively. In each case, the correlation between the fields and topographic values of the Ghanian relief was noted. The grid for the free-air gravity was used in Faye's reduction (Fig.4).
Fig. 4 Free-air gravity (Faye's) model of Ghana using CryoSat-2 and Jason-1 satellite derived data. Mapping: GMT. Source: author. / Slika 4. Gravitacijski (Fayeov) model anomalija slobodnog zraka Gane izrađen na temelju satelitskih podataka CryoSat-2 i Jason-1. Kartiranje: GMT. Izvor: autor
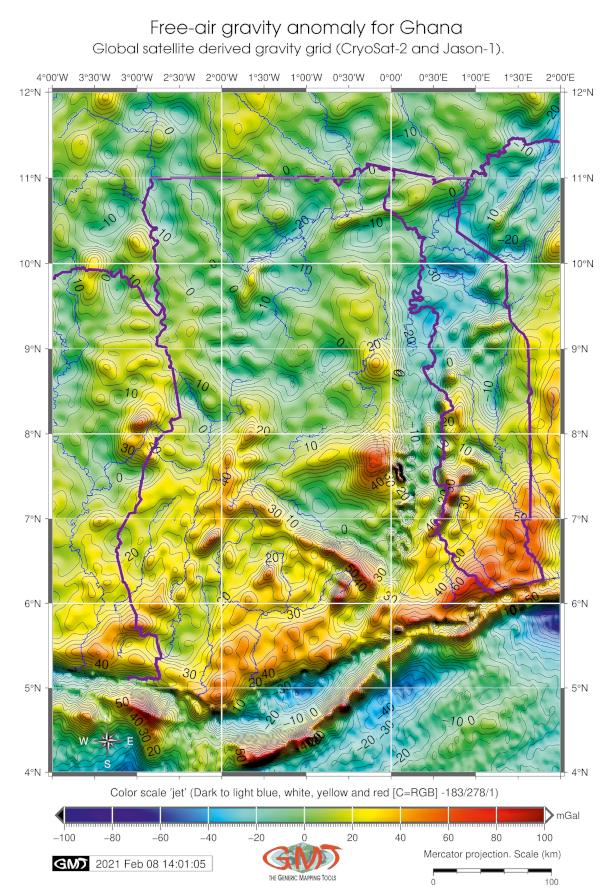
In the area where the Kwahu Plateau extends between 0.15°W−1.0°W, 6.00°N−7.20°N, the free-air gravity values are above 40 mGal (dark red colour inFig.5), that is, higher compared to the plain surrounding areas (between −5 to 1 mGal, coloured yellow inFig.5). Selected depressions in the topography of the Volta Basin coincide and are in correspondence with the lower values of gravity (−30 to −20 mGal, green colours in (Fig.5). The correspondence between the submarine relief in the coastal area of the Gulf of Guinea also demonstrates comparability between the elevated relief and higher free-air gravity values.
The comparison between Faye's and Bouguer reductions gives the following results. The data range for Faye's gravity (grav_27.1.img) extends from the minimum=−66.055 to a maximum=92.523, with a mean of 7.462 and standard deviation (StdDev)=20.665. For the same grid extent, the vertical gravity in the Bouguer reduction (curv_27.1.img) demonstrates the following data range: minimum=−126.055, maximum=157.265, mean=0.267 and the standard deviation (StdDev)=12.482. It indicates that Faye's gravity reduction shows a more compact data range and general extent which is higher for the Bouguer gravity due to the differences in the data processing algorithm.
Fig. 5 Vertical free-air gravity (Bouguer) model of Ghana using CryoSat-2 and Jason-1 satellite derived data. Mapping: GMT. Source: author. / Slika 5. Vertikalni model gravitacije slobodnog zraka (Bouguer) Gane na temelju satelitskih podataka CryoSat-2 i Jason-1. Kartiranje: GMT. Izvor: autor
The free-air Faye gravity anomalies are strongly correlated with topographic height and can be achieved by the interpolation of Bouguer anomalies and sequential transformation to the free-air (Faye's) anomalies.
Local linear correlation with the topographic heights of the relief in Ghana are demonstrated in both grids. Numerical values are modelled, compared and visualized for the interpolation of both Bouguer and Faye's gravity anomalies on Ghana. Higher values (over 60 mGal) are recorded for the elevated areas both in the submarine and terrestrial relief, while strongly negative values (-80 mGal) are noted in the water areas of the Gulf of Guinea. The majority of the Ghana terrain is covered by the values −10 to −20 mGal (aquamarine colour in (Fig.4) with clearly visible region of the extension of the Kwahu Plateau (25−30 mGal, orange colour inFig.4). The negative values in gravity are caused by the isostasy effect, as rock density of the mountains is lower, compared with the surrounding Earth's mantle. Hence, positive gravity values may indicate metallic ores and help in geologic prospecting.
6. Conclusions and Recommendations
The presented paper proposes that the described combination of the traditional GIS (with an example of QGIS) and scripting GMT methodology for an integrated thematic mapping of Ghana, starting with topographic relief visualization and then adding a series of geophysical and geologic maps, is not only a functional alternative to the GIS methods for cartographic multi-format data processing and map producing, but may also be significantly faster due to the console-based shell scripting applied for mapping.
In particular, using GMT syntax to write codes for data modelling, mapping and cartographic visualization appears to require an approach similar to programming (Lemenkova 2020e,Lemenkov and Lemenkova 2021a). These GMT code lines are needed to control the specific settings in a script for each element visualized on a map for each raster grid as opposed to the standard GIS methodology (Klaučo et al. 2014,2017) presented by the GIS where the settings were defined for the maps as undertaken in the QGIS part of this research. The available techniques for the cross-validation and calculation of the results received in geological mapping are described in previous studies and can be applied in research for comparison of results in similar studies (Malvić et al. 2019,Ivšinović and Malvić 2020).
This paper demonstrates a contribution to the development of mapping methods in cartography. Moreover, through a series of thematic maps it highlights the correlations between the geophysical, geological and topographic setting of Ghana using several datasets (gravity grids, geoid model, geologic layers and topographic raster) to show the distribution of the geophysical fields over the terrain relief of Ghana based on comparative cartographic data analysis processed by an integrated approach of the two open source geomatic tools: the GMT console-based scripting cartographic toolset and the QGIS software product. The recommendations for future studies can be summarized as follows:
Using GMT scripting is beneficial for enlarged regions of Ghana using the available geological datasets or fieldwork data. Other GMT modules can be applied as well (Lemenkova 2020c,2020d). QGIS or other open-source GIS may be considered for mapping, e.g. System for Automated Geoscientific Analyses GIS (SAGA GIS) or the Environment for Visualizing Images GIS (ENVI GIS).
Geologic data quality should be assessed carefully. This includes controling the data reliability and origin, format and resolution, spatial extent and relevance. Before handling datasets and making decisions about their acceptability for mapping, data quality has to be examined. It should normally include the inspection of settings using metadata and the relevant comments often accompanying a dataset. Moreover, data analysis includes controling the dataset generation time or the timeline of the geologic fieldwork and relevant technical specifications.
Retrospective analysis of the results is advised for the comparison of maps with previously made ones. This should be based on different maps of Ghana of an earlier origin and made by geological surveys in order to control the quality of the new maps using previously made ones.
Expanding the research towards a multidisciplinary project on the geology of Ghana includes both natural and social aspects of mineral resource exploration. Future research might also consider collaborative works with local geologic communities and expand projects towards emerging or geologically promising areas of Ghana. Additional studies can include environmental data assessment on climate issues (floods, droughts), social development and benefits for the local population from geologic exploration (e.g. increased employment, social facilities, mobility and possibilities for people).
Statistical data would update and bring new issues in geologic research on Ghana, integrating natural and social sciences. The combination of statistical data and mapping could be achieved by the use of R of Python languages that have a variety of libraries for tabular data processing and visualization.
To conclude, it is important to note the significance of scripting methods in contemporary cartography. Since the first scripting applications in cartographic routine, the emphasis has been placed on increasing both the quality and the speed of mapping achieved by machine learning algorithms in data processing. The first issue concerns the precision and aesthetics of maps. The second one concerns the automatization that increases the speed of data processing compared to the traditional GIS.
Hence, research on the geology and geophysics of Ghana should consider an integrated mapping methodology as a challenge for expanding technical cartographic tools into other geologic studies of Ghana in similar projects. While this emphasis is justified by the importance of automatization and machine learning in Earth sciences as technical tools, it also arises from the reason that the interest towards the geology of Ghana is consistently growing due to the exceptional richness of the country's mineral resources.
Acknowledgements
The author would like to thank the anonymous reviewers, corrector and the editor for their careful review, detailed critical comments and suggestions that improved the initial version of this manuscript.
1. Uvod
Napredak se u geološkim i geofizičkim analizama oslanja na naprednu kartografsku vizualizaciju. Ta duboka ontološka, konceptualna i tehnička povezanost među disciplinama znanosti o Zemlji dovela je do niza razvijenih kartografskih softvera, algoritama i metoda koje pomažu modeliranju i kartiranju geoloških i geofizičkih podataka. Epoha velikih geoprostornih podataka postavlja nove tehničke izazove suvremenoj kartografiji čiji je cilj učinkovita i precizna obrada i vizualizacija podataka uz minimaliziranu rutinu ručne izrade i povećanu brzinu kartiranja. Stoga, upotreba kartiranja temeljenog na konzoli za skriptiranje uz geoinformacijski sustav (GIS) koji se temelji na izborniku, kako je prikazano u ovom radu, otvara nove načine geološkog i geofizičkog kartiranja Gane.
Do sada su postojale samo aplikacije temeljene na GIS-u za kartiranje Gane na regionalnoj razini zemlje. Postojeće geološke i ekološke karte Gane usmjerene na procjenu okoliša objavljene su na nacionalnoj razini. To su studije opasnosti od poplava hazards (Amoako i Boamah 2015,Ansah i sur. 2020), istraživanja nalazišta zlata s geološkim kartama, geokemijskim crtežima i dijagramima (Amponsah i sur. 2015), kartiranje opasnosti i rizika od katastrofa (Adu-Gyamfi i sur. 2021), te za građevinarstvo i cestogradnju (Ahenkorah i sur. 2018).
Kroz ovo smo istraživanje uspjeli upotrijebiti moćnu funkcionalnost i GMT-a i Quantum GIS-a (QGIS) kako bismo prikazali geofizičko i geološko stanje zemlje na temelju različitih izvora podataka uz integrirani pristup za točno poluautomatizirano kartiranje Gane, što je jedna od značajnih prednosti ovoga rada. Ovaj rad, stoga, opisuje kombiniranu kartografsku metodu upotrebom GMT-a i QGIS-a za rukovanje geoprostornim podatcima i prikaz topografskih, geoloških i geofizičkih fenomena u Gani s dvostrukim ciljem:
Kartografski je cilj prikazati niz od pet novih tematskih karata Gane pripremljenih s pomoću QGIS-a i GMT-a: topografski rasterski sloj prikazuje reljef terena, a geofizički slojevi geoid i gravitacijsku mrežu, preklop i geološku vektorsku kartu pripremljenu s pomoću QGIS-a.
Geofizički je cilj analizirati polja gravitacijskih anomalija, geoid i topografske elevacije kako bi se demonstrirali utjecaji geologije na topografsko i geofizičko stanje površine. Komparativna analiza karata ima za cilj ilustrirati korelaciju između topografije, geofizike i geologije Gane
2. Softveri za kartiranje
U posljednje su se vrijeme geološka istraživanja usredotočila na napredna rješenja za analizu podataka i kartiranje (Sylvester i Attoh 1992,Attoh 1998,Lindh i Lemenkova 2021,Allibone i sur. 2002,Lemenkov i Lemenkova 2021b). Međutim, prethodne su studije koristile tradicionalne metode crtanja za vizualizaciju podataka s ograničenom funkcionalnošću za kartiranje, kao što je Generic Mapping Tools (GMT). Među različitim metodama u geoznanostima najčešće su u upotrebi analiza podataka i kartiranje (Klaučo i sur. 2013, Lemenkov i Lemenkova 2021c). Što se tiče GIS-a, on ostaje glavna metoda u kartiranju (Owusu-Nimo i sur. 2018,Osei i sur. 2021,Lemenkova i sur. 2012,Suetova i sur. 2005,Lemenkova 2021c,Gohl i sur. 2006,Schenke i Lemenkova 2008). Za razliku od tradicionalnih metoda GIS kartiranja, tehnika GMT-a je manje subjektivna i funkcionalnija je jer omogućava kartiranje s pomoću ponavljajućih skripti. Štoviše, zbog povećane funkcionalnosti tehnike skriptiranja za obradu podataka, posebno u odnosu na velike skupove podataka s globalnom pokrivenošću, upotreba GMT-a može biti učinkovit način vizualizacije kartografskih podataka (Wessel i sur. 2019).
Iako se GIS softver baziran na konvencionalnom grafičkom korisničkom sučelju (GUI) može koristiti za kartiranje velikih količina geoprostornih podataka zahvaljujući jednostavnom sučelju i jednostavnijoj funkcionalnosti (Appiah 1991,Boher i sur. 1992,Verutes i sur. 2012,Eisenlohr i Hirdes 1992,Engstrom i sur. 2013), postoji inherentni potencijal za pogreške uzrokovane ljudskim djelovanjem zbog rutine tijeka kartografiranja. Stoga je neizvjesno hoće li GIS učinkovito funkcionirati pri obrađivanju velike količine prostornih podataka iz više izvora, što je često slučaj u geološkom kartiranju Afrike (Black i Fabre 1983,Loh i Hirdes 1996,1999,Perrouty i sur. 2012). Tradicionalni GIS ima jednostavan način kartiranja s pomoću GUI-a i prošireni izbornik s raznim funkcijama za vektorske i rasterske vrste podataka. Istodobno, složeni projekt kartiranja najbolje funkcionira kada se prihvate svi dostupni formati podataka koji mogu sadržavati izvorne .shp datoteke fino čitljive kompatibilnim QGIS-om otvorenoga koda.
Za razliku od tradicionalnog GIS-a, GMT pruža pristup strojnog učenja baziran na konzoli za prostornu obradu (Lemenkova, 2021a,2021d). Fleksibilno kombiniranje tih pristupa kartiranju omogućuje iskorištavanje prednosti obaju i povećanje funkcionalnosti kartiranja. Sofisticirano skriptiranje GMT-a posebno je pogodno za kartografsku vizualizaciju zbog proširene funkcionalnosti pojedinačnih modula koji kontroliraju elemente karte: fino prilagođene palete boja, postavljanje i prikaz legende, oznake na mreži, izrezivanje i prozirnost, kompatibilnost s Geospatial Data Abstraction Library (GDAL), hijerarhijske napomene koje koriste različite fontove, rad s različitim formatima podataka itd. To je razlog zbog kojega se GMT široko koristi u geofizici (Gauger i sur. 2007,Lemenkova 2021a,2019b,2019c,Kuhn i sur. 2006,Gorman i sur. 2008).
3. Područje i podatci
Smještena u zapadnoj Africi (slika 1), Gana je zemlja iznimno bogata resursima. To su mineralni resursi dragocjenih geoloških nalazišta - zlata, dijamanata, boksita, manganove rude, nafte, aluminija (Amankwah i Anim-Sackey 2003,Nyame 2008,Ayanoore 2020) i ekološki resursi visoke komercijalne vrijednosti - šumskog drva, biljaka, poljoprivrednih proizvoda, kakaa, hortikulturnih usjeva (Ahoa i sur. 2020,Williams i sur. 2019,Abdulai i sur. 2017).
Gana je bila prva zemlja u Africi po nalazištima zlata u 2019. sa 130 tona godišnje proizvodnje zlata (Mining.com 2019). Orogena ležišta zlata u Gani nastala su kao rezultat dugotrajne geološke evolucije regije koja je uključivala metasedimentne sukcesije Gane koje čine dio birimskog paleoproterozojskog zapadnoafričkog kratona (Chudasama i sur. 2016,Kalsbeek i sur. 2020,Davis i sur. 1994,Feybesse i sur. 2006,Block i sur. 2016).
Poznati su zlatni pojasevi Gane regije: Ashanti Fault, Kumasi Basin i Sefwi-Bibiani. Orogena su ležišta minerala zlata u južnoj Gani opsežno proučavana i rezultirala su redovitim izvješćima o distribuciji i podrijetlu zlata (vidi npr.Adu-Baffour i sur. 2021,Harcouët i sur. 2007,Perrouty i sur. 2016,Dzigbodi-Adjimah i Nana Asamoah 2009,Hilson 2002,Benshaul-Tolonen i sur. 2019).
Ostali prirodni resursi Gane uključuju potencijal obnovljive energije predstavljen iz raznih izvora (Ankrah i Lin 2020). Najznačajniji je hidroenergetski sektor koji predstavlja hidroelektrana Akosombo (Volta), brana na rijeci Volti, koja je omogućila završetak izgradnje postrojenja za proizvodnju aluminija iz boksita na dodatnoj brani Kpong. Ostali su hidroenergetski resursi Gane donji sliv rijeke Pra i pritoke Volte (Arthur i sur. 2020). Osim toga, solarna se, geotermalna energija i energija vjetra mogu razviti kako bi postali važni izvori energije u Gani (Essandoh-Yeddu 1997,Danso i sur. 2021,Nuru i sur. 2021).
Središnji je izazov ovoga rada dvostruki aspekt obrade kartografskih podataka. Prvo, ovaj je rad projekt vođen skupovima podataka otvorenoga koda koji se odnose na Ganu. Nedavni tehnički napredak u prikupljanju podataka i organiziranim geološkim istraživanjima rezultirali su dostupnim materijalima, kao što su GEBCO visoke razlučivosti (slika 1), geološki podatci USGS-a (slika 2), geoid (slika 3) i gravimetrijska mreža (slike 4 i5), koji osiguravaju upotrebu pouzdanih skupova podataka za promatranje Zemlje.
Točnost kartiranja osigurana je, stoga, visokokvalitetnim sirovim skupovima podataka. Korištenje podataka EGM-2008 visoke razlučivosti olakšava otkrivanje varijacija u valovitosti geoida s neviđeno sitnim detaljima. Satelitske gravimetrijske mreže visoke razlučivosti pružaju izvor za kartiranje fine rezolucije geofizičkih polja i analizu varijacija s obzirom na topografiju Gane. Budući da geoid odražava varijacije u kopnenim masama koje dobro odgovaraju topografiji terena s jedinstvenim uzorcima, može se usporediti s topografskim i gravitacijskim kartama.
Drugo, u ovom se radu koristi metoda GMT skriptiranja za izradu nekoliko karata. Automatska obrada podataka i iscrtavanje glavni su izazovi u digitalnoj kartografiji. Automatizirana je vizualizacija važan zadatak zbog povećane brzine obrade podataka, točnosti i preciznosti vizualizacije te smanjenih pogrešaka uzrokovanih ljudskim djelovanjem. Osim toga, prednost skripti je kod koji se može ponovno koristiti u sličnim radovima. To omogućuje brzu obradu velike količine podataka. Automatizirane GMT tehnike olakšavaju kartografski tijek rada i omogućuju usredotočenje na geografsku analizu. Dakle, komparativna analiza karata otkriva slična geološka i geofizička obilježja na kartama s pomoću analize izolinija i distribucije objekata. S druge strane, GIS kartiranje može rezultirati ljudskim greškama i slučajnim pogreškama tijekom crtanja jer je tradicionalno kartiranje dugotrajan i subjektivan proces. Točno automatizirano kartiranje je izazovan problem u modernoj kartografiji koji je prikazan u poglavlju Metodologija. Stoga upotreba GMT-a u geološkoj, topografskoj i geofizičkoj analizi predstavlja iskorak u suvremenoj kartografiji.
Skupovi podataka upotrijebljeni u ovom radu su:
podatci s Opće batimetrijske karte oceana (GEBCO) koji pokrivaju topografiju i batimetriju Zemlje s neviđeno visokom razlučivosti od 15 lučnih sekundi, tj. oko 450 m (Schenke 2016,GEBCO Compilation Group 2020).
Earth Gravitational Model iz 2008 (EGM-2008) što ga je izradio EGM Development Team of the National Geospatial-Intelligence Agency (NGA) (Pavlis i sur. 2012).
podatci satelitske gravimetrije dobiveni od CryoSat-2 i Jason-1 koji prikazuju Fayeove i Bougerove modele (Sandwell i sur. 2014).
geološki slojevi u ArcGIS .shp formatima datoteka koji prikazuju površinsku geologiju i geološke provincije Afrike prema skupovima podataka Geološkog zavoda Sjedinjenih Američkih Država (United States Geological Survey − USGS) (Persits i sur. 1997).
Digitalna karta svijeta (Digital Chart of the World − DCW) koju su 1992. razvile Američka agencija za obrambeno kartiranje (U.S. Defense Mapping Agency's − DMA) i Nacionalna agencija za slike i kartiranje (National Imagery and Mapping Agency − NIMA) kao proizvod vektorskih podataka koji predstavlja granice država countries (Defense Mapping Agency 1992), a procijenjen je za Afriku (Goff 1994) te korišten za izrezivanje područja Gane preko prozirne pozadine i za globalnu kartu umetnutu naslici 1.
4. Analiza geofizičkih svojstava Gane
Geološko je kartiranje izvedeno s pomoću softvera QGIS (QGIS.org 2021). Prvo, generiran je GIS projekt u QGIS okruženju, gdje su ulazni vektorski slojevi učitani (Persits i sur. 1997) u standardu EPSG: 4326 European Petroleum Survey Group (EPSG) - Svjetski geodetski sustav (WGS) iz 1984., a izgled je (slika 2) generiran s pomoću opcija Layout Managera. Digitalna karta svijeta (DCW) upotrijebljena je kao sloj maske za izrezivanje za Ganu kao sveobuhvatni pouzdani vektorski kartografski sloj (Goff 1994).
4.1. Kartiranje geoloških jedinica
Geološke provincije Gane prikazane naslici 2 sadrže izdanke stijena iz sljedećih jedinica geoloških razdoblja: ordovicij kambrij (OCm), prekambrij i kambrij (pCm), kreda (K), kvartarni tercijarni (QT), kvartarni eol (Qe ) i tercijarni (T). Eolski dio kasnokvartarnih (Qe) sedimenata ukazuje na klimatske varijacije i promjene u tropskoj regiji Gane od kvartara, što omogućuje rekonstrukciju regionalnih klimatskih promjena na temelju geoloških zapisa starih sedimenata.
Raspored geoloških jedinica pokazuje tektonske i stratigrafske korelacije između pretkambrijskog i donjepaleozojskog sliva rijeke Volte i panafričkog orogenog pojasa zapadne Afrike. Štoviše, položaj ranoproterozojske birimijske superskupine u Gani uvelike je povezan s mineralizacijom zlata u Gani.
4.2. Kartiranje geoloških provincija
Geološke pokrajine Gane sadrže Gvinejski zaljev, Nigerijski masiv, bazen Taoudenija, sliv rijeke Volte i Zapadnoafrički štit. Bazen Volte predstavlja strukturnu geološku jezgru regije, Nigerijski masiv raspoređen je na istoku zemlje, a Zapadnoafrički štit na zapadu.
Geodinamičku evoluciju bazena Volte u Gani (svijetlozelena boja naslici 2) u trima je fazama strukturiraoAffaton (1990) podijelivši ju u tri skupine:
taloženje pješčenjaka na rubu kratona (Bombouaka Supergroup)
sedimentacija marginalna u odnosu na panafričku oceansku domenu (Pendjari-Oti Supergroup)
razvoj bazena u koji su se izlili melasni sedimenti superskupine Tamale.
Deynoux i sur. (2006) raspravljali su o geološkim svojstvima triju glavnih jedinica (megasekvencije) bazena Volte (zelena boja naslici 2): 1 Bombouake, 2 Pendjari-Oti, 3 Tamale koji služe kao horizonti markera za ograničavanje međubazenske korelacije među geološkim jedinicama Gane. Međutim, razdoblje uzastopne evolucije - od sedimentacije uzrokovane rascjepom do sudara u tim provincijama Gane - razlikovalo se regionalno. GMT se sastoji u pristupu skriptiranja temeljenom na konzoli, koji je u suprotnosti s tradicionalnim GIS-om kao što je QGIS. Parametri se postavljaju u posebnim modulima GMT-a kako bi se omogućilo vizualiziranje kartografskih elemenata na svim crtežima na temelju postavki (zastavice) u shell skripti za svaki element (paleta boja, specifikacija mreže, napomene, prozirnost slojeva i redoslijed pojavljivanja). Specifične su naredbe, koje se koriste za kartiranje karata naslikama 1,3,4 i5, dane s objašnjenjima u nastavku.
4.3. Topografsko kartiranje
Karta naslici 1 izrađena je na temelju mreže GEBCO-a koja sadrži informacije o topografiji Gane. Primjeri GMT kodova upotrijebljenih za kartu naslici 1 prikazani su utablici 1. Konkretno, slika je određena upotrebom koordinatnog raspona države izrezivanjem iz globalne mreže (kod br. 1). Paleta boja definirana je upotrebom ekstremnih visina uz 'geo' ugrađene palete boja GMT-a (kod br. 2). Maska vektorskog sloja generirana je iz poligona države DCW-a (kod br. 3). Tumač znakova postavljen je ispod glavne karte s pomoću modula 'psscale' (kod br. 4). Bilješke su dodane na primjeru koda br. 5. Umetnuta je globalna karta definirana kombinacijom modula 'psbasemap' i 'pscoast' upotrebom koda br. 6. Kod države za Ganu prihvaćen je iz standarda ISO 3166-1 alpha-2. Crtanje umetka izvedeno je prema kodu br. 7 utablici 1.
4.4. Geofizičko kartiranje
Kartiranje geoida i gravitacije slobodnog zraka u Fayeovim i Bougerovim korekcijama ima sličnu shemu uz opće module GMT-a kao što su 'pscoast', 'makecpt', 'grdimage', 'pstext', 'psbasemap' i 'psscale' te istu Mercatorovu projekciju. Kodovi koji se koriste za iscrtavanje geofizičkih karata (sl. 3,4 i5) prikazani su u intablici 2. Ovdje je modul 'grdconvert' primijenjen za ponovno formatiranje podataka EGM-2008 korištenjem koda br. 1 slijedeći primjer (Lemenkove (2020a)). Izolinije na karti geoida (slika 3) ucrtane su u razmaku od 0,25 m kodom br. 2. Iscrtavanje izolinija daje informacije o raspodjeli polja na području, što omogućuje procjenu blizine vrijednosti koje su određene geološkim i geofizičkim parametrima regije među kojima su gustoća stijena, topografija i tektonski lineamenti. Dodavanje obalne linije, granica i riječne mreže izvršeno je primjenom 'pscoast' GMT-a po kodu br. 3. Gravitacija slobodnog zraka u Fayeovoj redukciji reduction (slika 4) ekstrahirana je kao podskup img datoteke u Mercatorovoj projekciji kodom br. 4. Ta je datoteka zatim izrezana upotrebom raspona koordinata područja istraživanja i spremljena u formatu netCDF s pomoću koda br. 5. Isti je postupak ponovljen za Bougerovu korekciju (slika 5).
Ekstremi gravitacijske mreže zatim su procijenjeni s pomoću uslužnog programa GDAL 'gdalinfo' (kod br. 6). Biblioteka GDAL koristi se i za rukovanje i za preformatiranje geoprostornih podataka (Lemenkova, 2020b,2021b). Rezultati procjene su sljedeći: minimum=−66,055, maksimum=92,523, srednja vrijednost=7,462, standardna devijacija=20,665. Jednak je postupak primijenjen i na Bougerovu mrežu (sl. 5) sa sljedećim rezultatima: minimum=−126,055, maksimum=157,26, srednja vrijednost=0,267, standardna devijacija =12,482. Prema opsegu podataka obje su mreže grids (sl. 4 i5) vizualizirane s pomoću paleta boja 'jet' i 'seis'. Logo je GMT-a ucrtan na sve karte upotrebom koda br. 7.
Sumirajući metodologiju, metoda skriptiranja temeljena na GMT konzoli za obradu kartografskih podataka u određenoj je mjeri slična programiranju kao što su Python ili R (Lemenkova, 2019d,2019a).Dodaje retke koda koristeći module obrađene sintaksom GMT-a, a zatim izvršava skripte s konzole i daje grafički izlaz karte. Konačne karte sprema modul 'psconvert' koristeći PostScript u grafički standardni izlaz (jpg, tiff).
5. Rezultati i rasprava
Nekoliko je aspekata rezultata ovog rada koje treba posebno istaknuti:
Modeliranje geoida pokazuje varijabilnost valovitosti geoida u regiji Gane s povećanim vrijednostima u smjeru jugozapada.
Modeliranje gravitacije slobodnog zraka u Fayeovim i Bougerovim redukcijama odražava velike topografske strukture (npr. duga visoravan Kwahu koja se proteže dijagonalno u južnoj Gani).
Topografija se ogleda u prostornoj distribuciji geoloških cjelina i bazena (sliv Volte, Bijela Volta, Crna Volta, rijeka Oti).
Izrađene su karte, stoga, upotrijebljene za pretraživanje odnosa i usporedbe između geofizičkih polja, geoloških jedinica i pokrajina te topografskih struktura zemlje na temelju podataka visoke rezolucije. Za svaku od tih karata podatci su obrađeni u Mercatorovoj projekciji radi moguće usporedbe. Topografski su podatci (slika 1) nakon pregleda imali ekstreme u rasponu od −4696 m (Atlantski ocean, Gvinejski zaljev) do 915 m (uključujući nadmorske visine susjednih zemalja: Togo, Burkina Faso, Obala Bjelokosti), sa srednjom vrijednošću −206,102 m i standardnom devijacijom 1146,375 m. Najviša točka Gane zabilježena je na vrhu planine Afadja sa 885 m prema mreži GEBCO-a, a nalazi se na istoku zemlje na granici s Togom u području jezera Volte.
Dobiveni su rezultati za valovitost geoida (slika 3) provjereni uslužnim programom 'gdalinfo' naredbom: "gdalinfo geoid_GH.grd -stats". Podatci se kreću od minimuma=−32,535 m do maksimuma=65,174 sa srednjom vrijednošću=24,730 i standardnom devijacijom (StdDev)=21,013. Za provjeru izračunanih vrijednosti u odnosu na geološku kartu (slika 2) karte su uspoređene preklapanjem poligona geoloških pokrajina na temelju kojih je određena raspodjela geoidnih polja označena kako se križaju i preklapaju. geološke jedinice i pokrajine Gane. Utvrđeno je da se maksimalne vrijednosti geoida (vrijednosti više od 27 m, ružičasto obojene nasl. 3) uglavnom protežu preko pretkambrijskih izdanaka, dok su minimalne kopnene vrijednosti 22-23 m, ne uključujući Gvinejski zaljev. Uglavnom se nalaze u sjeveroistočnom području zemlje, što odgovara kambrijskim stijenama bazena Volte. Mora se istaknuti da se nastojanje proučavanja geološkog i geofizičkog stanja Gane, uključujući vizualizaciju geoidnih i gravitacijskih anomalija, mora ugraditi u sveobuhvatniji okvir upotrebom detaljnijih podataka. U ovom se radu, koristeći metode kartografskog prikazivanja, došlo do zaključka da geologija utječe i na geofizičko i topografsko stanje zemlje opažanjem da razlike u tim vrijednostima nisu univerzalne i da umjesto toga ovise o regionalnoj i lokalnoj geologiji. Niz istraživanja o utjecaju geologije i geološkog razvoja na geofizičko okruženje i topografiju može se dalje nastaviti koristeći ovu studiju kao osnovu za istraživanje postojanja fenomena pristranosti (bias) u usporednoj analizi topografije i geologije područja zapadne Afrike. I GMT i GIS u ovom su radu pokazali da i skriptiranje i tradicionalne tehnike dosljedno daju dobre rezultate u kartografskom tijeku rada, međutim, GMT pokazuje veću mogućnost automatizacije.
Anomalije slobodnog zraka vizualizirane su na kartama (slike 4 i5) koje respektivno prikazuju Fayeove i Bougerove redukcije. U svakom slučaju, uočena je korelacija između polja i topografskih vrijednosti ganskog reljefa. Mreža za Fayeovu redukciju gravitacije slobodnog zraka prikazana je na (slici 4).
U području gdje se visoravan Kwahu prostire između 0,15° i 1,60° zapadne geografske dužine i 6,00° i 7,20° sjeverne geografske širine vrijednosti gravitacije slobodnog zraka su iznad 40 mGal (tamnocrvena boja naslici 5), odnosno više u usporedbi s ravnim okolnim područjima (između −5 do 1 mGal, obojeno žuto naslici 5). Odabrane depresije u topografiji bazena Volte podudaraju se i korespondiraju s nižim vrijednostima gravitacije (−30 do −20 mGal, zelene boje nasl. 5). Korespondencija podmorskog reljefa u obalnom području Gvinejskog zaljeva također pokazuje usporedivost između povišenog reljefa i viših vrijednosti gravitacije slobodnog zraka.
Usporedba između Fayeovih i Bouguerovih redukcija daje sljedeće rezultate. Raspon podataka za Fayeovu gravitaciju (grav_27.1.img) proteže se od minimuma=−66,055 do maksimuma=92,523, s prosjekom od 7,462 i standardnom devijacijom (StdDev)=20,665. Za isti obuhvat mreže vertikalna gravitacija u Bouguerovoj redukciji (curv_27.1.img) pokazuje sljedeći raspon podataka: minimum=−126,055, maksimum=157,265, srednja vrijednost=0,267 i standardna devijacija (StdDev)=12,482. To pokazuje da Fayeovo smanjenje gravitacije daje kompaktniji raspon podataka i opći raspon koji je, zbog razlika u algoritmu obrade podataka, veći za Bouguerovu gravitaciju.
Fayeove gravitacijske anomalije slobodnog zraka su u snažnoj korelaciji s topografskom visinom. Interpolacijom Bouguerovih anomalija i sekvencijalnom transformacijom mogu se dobiti Fayeove anomalije slobodnog zraka.
Lokalna linearna korelacija s topografskim visinama reljefa u Gani pojavljuje se u objema mrežama. Numeričke su vrijednosti modelirane, uspoređene i vizualizirane za interpolaciju Bouguerovih i Fayeovih gravitacijskih anomalija na području Gane. Veće su vrijednosti (veće od 60 mGal) zabilježene za povišena područja i u podmorskom i kopnenom reljefu, a izrazito negativne vrijednosti (-80 mGal) zabilježene su u vodenim područjima Gvinejskog zaljeva. Većinu terena Gane pokrivaju vrijednosti od −10 do -20 mGal (boja akvamarina naslici 4) s jasno vidljivim područjem proširenja visoravni Kwahu (25−30 mGal, narančasta boja naslici 4). Negativne su vrijednosti gravitacije uzrokovane učinkom izostazije budući da je gustoća stijena planina manja u odnosu na okolni Zemljin plašt. Stoga pozitivne vrijednosti gravitacije mogu ukazivati na metalne rude i pomoći u geološkom istraživanju.
6. Zaključci i preporuke
Ovaj rad predlaže da opisana kombinacija tradicionalnog GIS-a (s primjerom QGIS-a) i GMT metodologije skriptiranja za integrirano tematsko kartiranje Gane, počevši od vizualizacije topografskog reljefa, a zatim dodavanjem niza geofizičkih i geoloških karata, nije samo funkcionalna alternativa metodama GIS-a za kartografsku obradu podataka u više formata i izradu karata, nego također omogućuje brže kartiranje zbog skriptiranja ljuske temeljene na konzoli. Upotreba sintakse GMT-a za pisanje kodova za modeliranje podataka, kartiranje i kartografsku vizualizaciju zahtijeva pristup sličan programiranju (Lemenkova 2020e,Lemenkov i Lemenkova 2021a). Naredbe GMT koda potrebne su za kontrolu specifičnih postavki postavljenih u skripti za svaki element vizualiziran na karti za svaku rastersku mrežu, za razliku od standardne metodologije (Klaučo i sur. 2014,2017) GIS-a primijenjene u dijelu ovog istraživanja s pomoću QGIS-a. Dostupne tehnike za unakrsnu provjeru (cross-validation) i računanje rezultata dobivenih geološkim kartiranjem opisane su u prethodnim radovima i mogu se primijeniti u istraživanjima za usporedbu rezultata u sličnim situacijama (Malvić i sur. 2019,Ivšinović i Malvić 2020). Ovaj rad pokazuje doprinos razvoju kartografskih metoda. Osim toga, nizom tematskih karata naglašava se korelacija između geofizičkih, geoloških i topografskih svojstava Gane uz upotrebu nekoliko skupova podataka (gravitacijske mreže, geoidni model, geološki slojevi i topografski raster) kako bi se prikazala raspodjela geofizičkih polja na području Gane na temelju usporedne analize kartografskih podataka obrađenih integriranim pristupom dvaju geomatskih alata otvorenog koda: skupa kartografskih alata za skriptiranje na GMT konzoli i softverskog proizvoda QGIS.
Preporuke za buduća istraživanja mogu se sažeti na sljedeći način:
GMT se može upotrijebiti za proširene regije Gane prema dostupnim skupovima geoloških podataka ili terenskim podatcima. Mogu se primijeniti i drugi moduli GMT-a (Lemenkova 2020c,2020d). QGIS ili drugi GIS otvorenog koda može se uzeti u obzir za kartiranje, npr. sustav za automatizirane geoznanstvene analize (System for Automated Geoscientific Analyses GIS − SAGA GIS) ili GIS okruženje za vizualizaciju slika (Environment for Visualizing Images − ENVI GIS).
Kvalitetu geoloških podataka treba pažljivo procijeniti. To uključuje kontrolu pouzdanosti i porijekla, formata i rezolucije, prostornog opsega i relevantnosti podataka. Prije rukovanja skupovima podataka i donošenja odluka o njihovoj prihvatljivosti za kartiranje mora se ispitati kvaliteta podataka. To bi obično trebalo sadržavati provjeru postavki upotrebom metapodataka i relevantnih komentara koji često prate skupove podataka. Štoviše, analiza podataka sadrži i kontrolu vremena generiranja skupa podataka ili vremenske linije geološkog terenskog rada i relevantne tehničke specifikacije.
Za usporedbu karata s prethodno izrađenima preporuča se retrospektivna analiza rezultata. Ona bi se trebala temeljiti na različitim prethodno izrađenim kartama Gane i prethodnim geološkim istraživanjima.
Proširenje istraživanja prema multidisciplinarnom projektu o geologiji Gane uključuje prirodne i društvene aspekte istraživanja mineralnih resursa. Buduća bi istraživanja također mogla razmotriti suradnju s lokalnim geološkim zajednicama i proširiti projekte na nastajućim ili geološki obećavajućim područjima Gane. Dodatna studija mogla bi sadržavati procjenu podataka o okolišu i klimatskim pitanjima (poplave, suše), društvenom razvoju i koristima za lokalno stanovništvo od geoloških istraživanja (npr. povećanje zaposlenosti, društvene pogodnosti, mobilnost i mogućnosti za ljude).
Statistički bi podatci ažurirali i donijeli nova pitanja u geološkim istraživanjima Gane integrirajući prirodne i društvene znanosti. Kombinacija statističkih podataka i kartiranja mogla bi se postići korištenjem jezika R ili Pythona koji sadrže niz biblioteka za obradu i vizualizaciju tabličnih podataka.
Za kraj napomenimo važnost skriptnih metoda u suvremenoj kartografiji. Od prvih aplikacija skriptiranja u kartografskoj rutini naglasak je stavljen na povećanje kvalitete i brzine preslikavanja koju postižu algoritmi strojnog učenja u obradi podataka. Prvo se pitanje tiče preciznosti i estetike karata. Drugo se odnosi na automatizaciju koja povećava brzinu obrade podataka u odnosu na tradicionalni GIS.
Stoga bi pri istraživanju geologije i geofizike Gane trebalo razmotriti integriranu metodologiju kartiranja kao izazov za proširenje tehničkih kartografskih alata na druge geološke studije Gane u sličnim projektima. Iako je ovaj naglasak opravdan zbog važnosti automatizacije i strojnog učenja u znanostima o Zemlji kao tehničkim alatima, on također proizlazi iz razloga što se interes za geologiju Gane dosljedno javlja zbog iznimnog bogatstva mineralnih resursa u toj zemlji.
Acknowledgements
Autorica zahvaljuje anonimnim recenzentima, lektoru i uredniku na pažljivom pregledu, detaljnim komentarima i prijedlozima koji su poboljšali početnu verziju ovog rukopisa.
