
Introduction
Esophageal cancer (EC), which includes esophageal squamous cell carcinoma (ESCC; 90 %) and esophageal adenocarcinoma (EAC), is a major contributor to cancer-related mortality, primarily due to the advanced stage at diagnosis and limited treatment efficacy (1, 2). Its aggressive nature, coupled with an increasing incidence and poor prognosis, underscores the urgent need for enhanced treatment strategies (3). Despite the introduction of novel therapeutic approaches such as immunotherapy, chemoradiotherapy, and molecular therapy (5–7), the 5-year survival rate for advanced EC remains dismal (4). Unfortunately, these approaches have yielded unsatisfactory outcomes, particularly in regions with a high incidence of EC, such as China (8). Therefore, novel therapies targeting the oncogenesis of EC are urgently needed.
Long non-coding RNAs (lncRNAs) have recently emerged as pivotal regulators in the initiation and progression of various tumors (9). These non-coding RNA transcripts, which exceed 200 nucleotides in length, regulate mRNA transcription and translation, protein stability, epigenetic modifications, and other critical biological processes (10, 11). FOXD2-AS1, previously associated with multiple tumor types, has also been implicated in the oncogenesis of EC. FOXD2-AS1, in collaboration with MACC1-AS1, mediates cisplatin resistance in ESCC cells through NSD2 induction (15). Overexpression of FOXD2-AS1 is associated with cisplatin resistance in ESCC by targeting miR-195 and modulating the Akt/mTOR signaling pathway (16). Our previous research demonstrated that FOXD2-AS1 promotes proliferation and invasion through the miR-145-5p/CDK6 axis in EC (17). This study aims to elucidate the upstream mechanisms regulating the role of FOXD2-AS1 in EC.
N6-methyladenosine (m6A) RNA modification is the most prevalent RNA modification in eukaryotes and is regulated by three classes of enzymes: m6A methyltransferases (METTL3/14), m6A demethylases (ALKBH5 and FTO), and m6A reading enzymes (YTHDF1/2/3) (18). Recent studies have revealed the presence of m6A RNA modifications in various non-coding RNAs, including miRNAs, lncRNAs, and circRNAs (19). METTL3, an m6A methyltransferase, is an S-adenosylmethionine (SAM)-binding protein highly conserved across eukaryotes (20). The m6A methyltransferase complex plays a crucial role in RNA methylation modification. The core of this complex consists of a heterodimer composed of methyltransferase-like protein 3 (METTL3) and methyltransferase-like protein 14 (METTL14) (21). Among these components, METTL3 is the only catalytically active element, responsible for transferring methyl groups to the N6 position of adenine nucleotides in RNA. In contrast, METTL14 contributes to the structural stabilization of METTL3, facilitating both the maintenance of the complex's integrity and the recognition of RNA substrates (22). YTH N6-methyladenosine RNA-binding protein 1 (YTHDF1) acts as a key reader enzyme of m6A RNA modifications (23), and there is increasing evidence supporting the role of m6A methylation in various cancers. In breast cancer, METTL3 has been shown to regulate MALAT1 expression, thereby modulating the E2F1/AGR2 axis and promoting resistance to adriamycin (24). YTHDF1 has also been implicated in driving breast cancer by enhancing FOXM1 translation in an m6A-dependent manner (25). However, the impact of m6A RNA modification on the initiation and progression of esophageal cancer (EC) through the regulation of lncRNA expression remains to be explored.
In this study, we first observed elevated METTL3 expression in esophageal cancer (EC) tissues and cells. Subsequently, loss-of-function experiments were performed to evaluate cell proliferation and apoptosis. Mechanistic investigations examined the molecular interplay between METTL3 and FOXD2-AS1, involving YTHDF1, in EC cells. Furthermore, in vivo experiments were conducted to assess the functional significance of the METTL3/FOXD2-AS1 axis in EC animal models.
EXPERIMENTAL
Bioinformatics prediction
The Encyclopedia of RNA Interactomes (ENCORI,https://starbase.sysu.edu.cn/index.php) (26) and The University of ALabama at Birmingham CANcer (UALCAN, https://ualcan.path.uab.edu/index.html) databases were used to analyze the expression of METTL3 and METTL14 in EC tissues and normal tissues (27–28). The sequence-based RNA adenosine methylation site predictor (SRAMP,http://www.cuilab.cn/sramp) (29–30) was used to analyze the m6A-modified sites in FOXD2-AS1. The correlation between FOXD2-AS1 and YTHDF1 in esophageal cancer was analyzed using the Gene Expression Profiling Interactive Analysis (GEPIA,http://gepia.cancer-pku.cn/) (31) database. All the above results were obtained on the TCGA-ESCA dataset (32).
Collection of clinical tissues
Clinical samples of esophageal cancerous and adjacent non-cancerous tissues were collected from 10 patients who underwent treatment at the Sixth Affiliated Hospital of Nantong University. The samples were immediately frozen in liquid nitrogen for preservation. None of the patients had received interventional therapy or systemic chemotherapy prior to surgery, and informed consent was obtained from either the patients or their legal guardians. All experiments were approved by the Ethics Committee of the Sixth Affiliated Hospital of Nantong University (2020-081).
Cell culture
Human normal esophageal epithelial cells (T-HEECs) and esophageal cancer (EC) cell lines (Eca-109 and /TE-1) were obtained from the Cell Resource Center of the Shanghai Academy of Sciences and cultured in DMEM supplemented with 10 % fetal bovine serum (FBS) and 1 % penicillin-streptomycin. Cells were cultured in a humidified incubator at 37 °C with 5 % CO2.
qRT-PCR analysis
Total RNA was isolated from tissues and cells using TRIzol reagent (Invitrogen, USA), followed by complementary DNA (cDNA) synthesis using the PrimeScript RT reagent kit (TaKaRa, China). Quantitative PCR (qPCR) was performed using SYBR Green (Vazyme Biotech) on a GeneAmp 7500 system (Applied Biosystems, Thermo Fisher, USA). RNA expression levels were quantified using the 2–ΔΔCt method (33), with GAPDH as the internal control. Primers were designed using the NCBI website (https://www.ncbi.nlm.nih.gov/tools/primer-blast/) (34). The amplification process was set as follows: the predenaturation stage lasted at 95 ℃ for 300 s, and then entered a cycling reaction. Each cycle included denaturation at 95 ℃ for 10 s and annealing at 60 ℃ for 30 s, a total of 45 cycles. The primer sequences used were as follows: METTL3, forward 5’-AAGCTGCACTTCAGACGAAT-3’ and reverse 5’-GGAATCACCTCCGACACTC-3’; METTL14, forward 5’-GAACACAGAGCTTAAATCCCCA-3’ and reverse 5’-TGTCAGCTAAACCTACATCCCTG-3’; FOXD2-AS1, forward 5’-TGGACCTAGCTGCAGCTCCA-3’ and reverse 5’-AGTTGAAGGTGCACACACTG-3’; YTHDF1, forward 5’-ATGTCGGCCACCAGCGTGGACA-3’ and reverse 5’-TCATTGTTTGTTTCGACTCTGC-3’; YTHDF2, forward 5’- CATGAATGGGAAGGGTCCCG-3’ and reverse 5’-GACGAATGTGTCGCAGTTGG-3’; YTHDF3, forward 5’-TGTTGTGGACTATAATGCGTATGC-3’ and reverse 5’-AAGCGAATATGCCGTAATTGGTTA-3’; GAPDH, forward 5’-GGAGCGAGATCCCTCCAAAAT-3’ and reverse 5’-GGCTGTTGTCATACTTCTCATGG-3’.
Cell transfection
To silence the expression of FOXD2-AS1, siRNAs targeting FOXD2-AS1 (siFOXD2-AS1-1 and siFOXD2-AS1-2) were used. To reduce METTL3 expression, shMETTL3-1 and shMETTL3-2 were applied. As for the construction of the shRNA expression vector, after designing synthetic primers based on METTL3 gene transcript, the transformants were screened by colony PCR and verified by sequencing. For modulating YTHDF1 expression, siYTHDF1 and pc-YTHDF1 were employed. In control experiments, siNC or pc-DNA3.1 served as negative controls. These plasmid transfections from GenePharma were carried out in Eca-109 and TE-1 cells using Lipofectamine 2000 reagent (Invitrogen). The sequences were as follows:
siFOXD2-AS1-1, sense: 5’-GGGCAAAGUUCGAGAGUGATT-3’ and anti-sense: 5’-UCACUCUCGAACUUUGCCCTT-3’; siFOXD2-AS1-2, sense: 5’-GGACUGGUUCUGAGACAAATT-3’and anti-sense: 5’-UUUGU -CUCAGAACCAGUCCTT-3’(8); pc-DNA3.1: F-CTAGAGAACCCACTGCTTAC R-TAGAAGGCACAGTCGAGG. ShMETTL3-1:CcggGCCAAGGAACAATCCATTGTTCTCGAGAACAATGGATTGTTCCTTGGCTTTTTTg; shMETTL3-2: CcggCGTCAGTATCTTGGGCAAGTTCTCGAGAACTTGCCCAAGATACTGACGTTTTTTg; shNC: CcggGCTGCACTTCAGACGAATTATCTCGAGATAATTCGTCTGAAGTGCAGCTTTTTTg.
Cell counting kit 8 (CCK-8) assay
1*104 cells were seeded into each well of a 96-well plate. Subsequently, 10 μL of CCK-8 (Dojindo, China) reagent was introduced into each well, and cells were cultured using serum-free medium (12309019, Thermo Fisher). This process was carried out at 24, 48, and 72 hours. After a 2-hour incubation, the absorbance at 450 nm in each well was measured using a microplate reader (BioTex, USA).
EdU incorporation assay
Cells were incubated with 10 mM EdU for 2 hours, then fixed with 4 % paraformaldehyde, permeabilized with 0.3 % Triton X-100, and stained with Apollo fluorescent dye (Sigma-Aldrich, China). Nuclei were stained with 5 mg mL–1 4',6-diamidino-2-phenylindole (DAPI) (D9542, Sigma-Aldrich) for 10 minutes. The number of EdU-positive cells in five random fields was counted under the Zeiss UV LSM 510 confocal microscope. All experimental procedures were performed according to the instructions of the kit (C0078S, Beyotime, China).
Flow cytometry
To assess the apoptosis ability of tumor cells, the PE Annexin V Apoptosis Detection Kit I (BD Pharmingen) was used. Cells were harvested, resuspended in 1 × binding buffer, and collected in a 10 mL centrifuge tube. Incubation with 5-μL PE Annexin V and 5-μL 7-AAD was conducted for 15 min. Apoptotic cells were assessed using a FACS Calibur flow cytometer (BD Bioscience, USA).
Western blotting
To assess the protein expression of METTL3, METTL14, YTHDF1, Bax, c-caspase-3, t-caspase-3, PCNA, and Ki-67 in Esophageal cancer cells and tissues, protein extraction was performed using RIPA lysis buffer (Beyotime). The protein concentration was determined using a BCA Protein assay kit (Beyotime). Subsequently, the proteins were separated on SDS-PAGE and transferred onto PVDF membranes. Blocking was achieved using 5 % skimmed milk (P0216, Beyotime). Primary antibodies against METTL3 (1:1000; 67733-1-IG, Proteintech, China) METTL14 (1:1000; F1391, Selleck, China) YTHDF1 (1:500; 66745-1-IG, Proteintech), Bax (1:1000; Cat. #2772T, CST, China), c-caspase-3 (1:1000; Cat. #9661T, CST), t-caspase-3 (1:1000; 82202-1-RR, Proteintech), PCNA (1:500; Cat. #13110T, CST), Ki-67 (1:700; ab15580, Abcam, China), and GAPDH (1:1000;sc-32233, Santa Cruz Biotechnology, USA) were incubated overnight in a 5 % milk dilution followed by incubation with HRP-labeled goat anti-rabbit IgG. The blots were then visualized using chemiluminescence (HRP Substrate) and captured with an AlphaView analysis system (ProteinSimple) (FluorChem R, USA). GAPDH was used as a referent protein for calculating protein expression, and protein band quantification was performed using ImageJ software (-v1.8.0) (35).
Quantification of m6A RNA methylation
Total RNA was extracted from cells following the manufacturer's instructions, using the TRIzol reagent (Thermo Fisher). m6A RNA methylation levels were quantified using the EpiQuik m6A RNA Methylation Quantification Kit (Colorimetric; Epigentek) and measured at an absorbance of 450 nm.
RNA stability assays
Cells were seeded in 6-well plates and transfected with either shNC or shMETTL3. Following transfection, cells were treated with actinomycin D (CST, 5 µg mL–1) for 0, 4, and 8 hours. RNA was then extracted to evaluate the levels of the target RNA via real-time PCR.
Co-IP
To investigate the interaction between METTL3 and YTHDF1 proteins, we performed a Co-IP (co-immunoprecipitation) assay. We first constructed the METTL3-Myc© expression vector by fusing the METTL3 coding sequence with the pc-AMBIA1300-35S-Myc-rbcsE9 vector (NM_019852.5). (F-CGCAAATGGGCGGTAGGCGTG; R-CATAGCGTAAAAGGAGCAACA). Similarly, we generated the YTHDF1-GFP© expression vector by amplifying and fusing the coding sequence of YTHDF1 with the pC-AMBIA1300-35S-GFP-rbcsE9 vector (NM_017798.4) (F- CGCAAATGGGCGGTAGGCGTG; R- GACACGCTGAACTTGTGGC). Subsequently, these expression vectors were transfected into the appropriate cells. The cells were lysed under non-denaturing conditions, and the resulting lysate was collected. The lysate was then incubated with either anti-GFP (P2132, Beyotime) or anti-MYC (P2118, Beyotime) beads at 4 °C for 4 hours. Following incubation, we carried out five washes using an extraction buffer. Subsequently, we eluted the proteins from the magnetic beads by boiling the samples in the SDS sample buffer for 10 minutes. Afterward, we isolated the proteins via SDS-PAGE electrophoresis and performed Western Blots to detect the presence of the proteins.
RNA immunoprecipitation (RIP)
To validate the interaction between FOXD2-AS1 and YTHDF1, YTHDF2, or YTHDF3, we performed RNA immunoprecipitation (RIP) using the EZMagna RIP Kit (Millipore, USA). After washing and scraping the cells with PBS, they were centrifuged and resuspended in complete RIP lysis buffer. Antibodies (IgG, YTHDF1, YTHDF2, and YTHDF3) were pre-incubated with Protein A/G magnetic beads in an immunoprecipitation buffer. The cell lysates were then incubated with the antibody-bead complexes overnight at 4 °C. The RNA eluted from the beads was precipitated with ethanol, dissolved in RNase-free water, and analyzed by qPCR to assess FOXD2-AS1 expression. The antibodies used were IgG (10284-1-AP, Proteintech), YTHDF1 (#86463, CST), YTHDF2 (24744-1-AP, Proteintech), and YTHDF3 (#24206S, CST).
M6A MeRIP qPCR
To quantify the m6A methylation level of FOXD2-AS1, we performed m6A methylated RNA immunoprecipitation (MeRIP) using an m6A-specific antibody and the Magna m6A MeRIP Kit (Millipore). Following cell treatment (transfection with shNC, shMETTL3-1, and shMETTL3-2), RNA was extracted from Eca-109 and TE-1 cells using the Trizol reagent (Invitrogen). After fragmenting the RNA, immunoprecipitation was carried out using m6A or IgG antibodies in 1 ml of buffer supplemented with ribonuclease inhibitors. Following washing, protein A/G magnetic beads were added to the mixture and incubated for 2 hours at 4 °C. The m6A RNA was then eluted using N6-methyladenosine-5'-monophosphate sodium salt at 4 °C for 1 hour, followed by RNA purification and qPCR analysis to investigate the regulation of FOXD2-AS1 by METTL3.
RNA pull-down assay
To investigate the binding interaction between YTHDF1 and FOXD2-AS1, we performed an RNA pull-down assay. A biotinylated FOXD2-AS1 probe was designed and synthesized by RiboBio. The cells were transfected with the probe and treated for 2 days. Subsequently, the cells were washed, lysed, and incubated at 4 °C with Dynabeads™ M-280 Streptavidin magnetic beads (Invitrogen). The precipitated proteins were then purified using TRIzol for western blot analysis.
Animal models
The procedures involving animal assays were conducted following approval from the Ethical Committee of Affiliated Hospital 6 of Nantong University (XMLL-2021-808). A total of 24 BALB/c nude mice, aged 4–6 weeks and weighing 18–20 grams, were subcutaneously injected with cells transfected with various constructs, including a blank vector (NC group), shMETTL3-1 (METTL3 KD group), pc-FOXD2-AS1 (FOXD2-AS1 OE group), and shMETTL3-1+pc-FOXD2-AS1 (METTL3 KD+FOXD2-AS1 OE group). The injections were administered to the right flank of the mice. Over a 28-day period, tumor volume measurements were taken every 3 days, and the recorded data were calculated using the formula (length×width2)/2. Additionally, upon sacrificing the mice, the tumors were excised, and their weights were measured.
FISH
Specific FISH probes for FOXD2-AS1 were designed and synthesized by Servicebio (China). Hybridization was performed in mouse tumor tissue, as previously reported (36). All images were analyzed using a fluorescence microscope. The FISH probe sequence for FOXD2-AS1 was as follows: 5'-TAAAATTAGAGAAATCTGCGGGCGTAGTTCCCCAAGC-3'.
Immunohistochemistry (IHC)
Formalin-fixed tissue samples were sectioned into 5-µm slices. Subsequently, dewaxing, hydration, and heat-induced epitope retrieval were performed. The sections were treated with a primary antibody against METTL3 (1:1000; 67733-1-IG, Proteintech), Ki-67 (1:1000; ab15580, Abcam) followed by incubation with secondary antibodies (1:3000; ab205719, Abcam) and peroxidase-conjugated streptavidin. A 3,3'-diaminobenzidine tetrahydrochloride (DAB) solution (36201ES03, Yeasen, China) was applied for 5 minutes, and counterstaining was carried out with hematoxylin. The stained sections were then observed under a light microscope. For protein quantification of METTL3: the number of METTL3-positive cells in five random areas was counted at 40 × magnification, and the average value was the number of METTL3-positive cells in that section.
Hematoxylin and eosin (HE) staining
Paraffin-embedded tissue sections were subjected to a 30-minute roasting process (70 ℃), followed by dewaxing and hydration. The cell nuclei were stained with hematoxylin solution (Biosharp, China), and the cytoplasm was stained with eosin solution (Biosharp). After the sections were allowed to dry, they were preserved using a neutral resin.
All experiments were performed in triplicate, and statistical significance was determined at a level of p < 0.05. Statistical analyses were conducted using SPSS 21.0 software (IBM). Differences were assessed using either the student’s t-test or one-way ANOVA (Tukey's post hoc test). Additionally, a ROC curve was generated to assess the diagnostic value of FOXD2-AS1 expression for EC patients.
Results and Discussion
METTL3 was upregulated in EC tissues and cells
The ENCORI database analysis revealed a significant increase in METTL3 expression in EC tissues compared to normal tissues, with no significant change in METTL14 expression (Fig. 1a). Furthermore, UALCAN database analysis showed that METTL3 expression increased with tumor grade, while METTL14 expression remained relatively unchanged (Fig. 1c). The receiver operating characteristic (ROC) curve showed that the expression level of METTL3 in esophageal cancer had potential diagnostic value (Fig. 1b) (32). The expression of METTL3 protein in tissues was confirmed through WB, revealing a significant upregulation of METTL3 in cancerous tissues compared to normal tissues (Fig. 1d) (p < 0.001). To validate these predictions, METTL3 and METTL14 mRNA levels were assessed in tissues and cells using qRT-PCR. In comparison to normal tissues, only METTL3 showed a significant upregulation in cancerous tissues (Fig. 1e) (p < 0.001). High levels of METTL3 were observed in Eca-109 and TE-1 cells compared to HEEC (Fig. 1f) (p < 0.001, p = 0.023). In summary, METTL3 is significantly overexpressed in EC tissues and cells.

Fig. 1. METTL3 expression was upregulated in EC tissues and cells: a) ENCORI analysis of elevated METTL3 expression and unaltered METTL14 expression in EC tissues compared to normal tissues; b) ROC curve analysis evaluating the potential diagnostic value of METTL3 expression levels in esophageal cancer; c) UALCAN database analysis of METTL3 and METTL14 expression based on tumor grade; d) WB analysis of METTL3 expression in the samples; e) qRT-PCR analysis showing the expression levels of METTL3 and METTL14 in 10 matched EC and non-tumor tissues; f) qRT-PCR analysis of METTL3 and METTL14 expression in HEEC, Eca-109, and TE-1 cells. *p < 0.05, **p < 0.01, ***p < 0.001.
METTL3 silencing suppressed proliferation and accelerated apoptosis of EC cells
To investigate the functional role of METTL3 in EC, qRT-PCR results confirmed the successful silencing of METTL3 (Fig. 2a) (ECA-109: shNC vs. shMETTL3-1, p < 0.001; shNC vs. shMETTL3-2, p < 0.001) (TE-1: shNC vs. shMETTL3-1, p < 0.001; shNC vs. shMETTL3-2, p < 0.001). Following METTL3 knockdown, the total m6A level was also reduced (Fig. 2b) (ECA-109: shNC vs. shMETTL3-1, p < 0.001; shNC vs. shMETTL3-2, p < 0.001) (TE-1: shNC vs. shMETTL3-1, p < 0.001; shNC vs. shMETTL3-2, p < 0.001). The CCK-8 assay demonstrated that METTL3 downregulation inhibited cell proliferation (Fig. 2c) (ECA-109: shNC vs. sh METTL3-1, p < 0.001; shNC vs. shMETTL3-2, p < 0.001) (TE-1: shNC vs. shMETTL3-1, p < 0.001; shNC vs. shMETTL3-2, p < 0.001). The EdU assay showed a decrease in the abundance of proliferating cells when METTL3 expression was downregulated (Fig. 2d,g) (ECA-109: shNC vs. shMETTL3-1, p < 0.001; shNC vs. shMETTL3-2, p < 0.001) (TE-1: shNC vs. shMETTL3-1, p < 0.001; shNC vs. shMETTL3-2, p < 0.001). Flow cytometry analysis revealed an increase in apoptotic cells following METTL3 knockdown (Fig. 2e,h) (Eca-109: shNC vs. shMETTL3-1, p = 0.009; shNC vs. sh METTL3-2, p = 0.008) (TE-1: shNC vs. shMETTL3-1, p = 0.007; shNC vs. sh METTL3-2, p = 0.008). WB analysis showed that the expression levels of the proapoptotic proteins Bax and c-caspase-3 increased after METTL3 knockdown, while there was no significant change in t-caspase-3 levels. Additionally, the levels of proliferation-related proteins Ki-67 and PCNA decreased compared to the control group (Fig. 2f) (BAX: shNC vs. shMETTL3-1, p < 0.001; shNC vs. shMETTL3-2, p < 0.001) (c-caspase-3: shNC vs. shMETTL3-1, p < 0.001; shNC vs. shMETTL3-2, p < 0.001) (Ki-67: shNC vs. shMETTL3-1, p < 0.001; shNC vs. shMETTL3-2, p < 0.001) (PCNA: shNC vs. shMETTL3-1, p < 0.001; shNC vs. shMETTL3-2, p < 0.001). These findings illustrate that METTL3 inhibition impedes proliferation while inducing apoptosis in EC.


Fig. 2. METTL3 silencing suppressed proliferation and accelerated apoptosis of EC cells: a) mRNA expression of METTL3 in Eca-109 and TE-1 cells treated with shNC, shMETTL3-1, and shMETTL3-2 to confirm transfection efficiency by qRT-PCR; b) m6A RNA methylation was estimated using a colorimetric method; c) cell proliferation of transfected Eca-109 and TE-1 cells assessed by performing a CCK-8 experiment; d) EdU incorporation assay in Eca-109 and TE-1 cells; e) Apoptosis of Eca-109 and TE-1 cells was tested by flow cytometry. (F) Bax, c-caspase-3, t-caspase-3, Ki67, and PCNA proteins are expressed in Eca-109 cells with or without shMETTL3; g) and h) quantified data of EdU incorporation assay and flow cytometry. *p < 0.05, **p < 0.01, ***p < 0.001.
METTL3 regulated the m6A modification of FOXD2-AS1
SRAMP predicted 12 m6A-modified sites (Fig. 3a). Several of the analyzed binding sites showed above moderate confidence. MeRIP assays revealed that the m6A level in Eca-109 and TE-1 cells was higher than that in HEEC cells (Fig. 3b) (HEEC: Input vs. IgG, p < 0.001; Input vs. m6A, p < 0.001) (Eca-109: Input vs. IgG, p < 0.001; Input vs. m6A, p = 0.007) (TE-1: Input vs. IgG, p < 0.001; Input vs. m6A, p = 0.006) (m6A content: HEEC cells vs. TE-1 cells, p = 0.006; HEEC cells vs. Eca-109 cells, p = 0.017). During qRT-PCR experiments, FOXD2-AS1 expression was significantly reduced upon METTL3 inhibition (Fig. 3c) (Eca-109: shNC vs. shMETTL3-1, p < 0.001; shNC vs. shMETTL3-2, p < 0.001) (TE-1: shNC vs. shMETTL3-1, p < 0.001; shNC vs. shMETTL3-2, p < 0.001). Subsequently, the effect of METTL3 knockdown on the stability of FOXD2-AS1 was investigated, revealing that METTL3 knockdown improved the stability of FOXD2-AS1 RNA in Eca-109 and TE-1 cells (Fig. 3d) (Eca-109:4h- shNC vs. shMETTL3-1, p < 0.001; shNC vs. shMETTL3-2, p = 0.0002; 8h- shNC vs. shMETTL3-1, p < 0.001; shNC vs. shMETTL3-2, p = 0.010) (TE-1: 4h- shNC vs. shMETTL3-1, p < 0.001; shNC vs. shMETTL3-2, p = 0.023; 8h- shNC vs. shMETTL3-1, p = 0.008; shNC vs. shMETTL3-2, p = 0.004). Moreover, METTL3 silencing decreased the m6A level in Eca-109 and TE-1 cells (Fig. 3e) (Eca-109:sh-NC- Input vs. IgG, p < 0.001; Input vs. m6A, p = 0.043; shMETTL3-1- Input vs. IgG, p < 0.001; Input vs. m6A, p = 0.009; shMETTL3-2- Input vs. IgG, p < 0.001; Input vs. m6A, p = 0.008) (TE-1: shNC- Input vs. IgG, p < 0.001; Input vs. m6A, p = 0.007; shMETTL3-1- Input vs. IgG, p < 0.001; Input vs. m6A, p = 0.0004; shMETTL3-2- Input vs. IgG, p < 0.001; Input vs. m6A, p < 0.001). These results clarify that METTL3 modulates the m6A modification of FOXD2-AS1 in EC.

Fig. 3 METTL3 regulated the m6A modification of FOXD2-AS1: a) analysis of m6A-modified sites in FOXD2-AS1 by SRAMP; b) MeRIP-qPCR analysis of m6A levels in HEEC, TE-1, and Eca-109 cells; c) qRT-PCR results showing the expression of FOXD2-AS1 after transfection with shNC, shMETTL3-1, and shMETTL3-2; d) evaluation of FOXD2-AS1 RNA stability in TE-1 and Eca-109 cells with or without METTL3 shRNA; e) MeRIP-qPCR analysis of m6A levels following METTL3 silencing in TE-1 and Eca-109 cells. *p < 0.05, **p < 0.01, ***p < 0.001.
YTHDF1 bound with FOXD2-AS1
To identify the functional proteins involved in the m6A modification of FOXD2-AS1, RIP experiments were conducted. YTHDF1, YTHDF2, and YTHDF3 were found to bind with FOXD2-AS1, with YTHDF1 exhibiting the highest affinity (Fig. 4a-c) (Eca-109: IgG vs. YTHDF1, p < 0.001; TE-1-IgG vs. YTHDF1, p < 0.001) (Eca-109: IgG vs. YTHDF2, p < 0.001; TE-1-IgG vs. YTHDF1, p < 0.001) (ECA-109: IgG vs. YTHDF3, p < 0.001; TE-1-IgG vs. YTHDF3, p < 0.001). The positive correlation between YTHDF1 and FOXD2-AS1 in EC was analyzed by GEPIA (Pearson correlation coefficient) (R = 0.38, p < 0.001) (Fig. 4d). RNA pull-down experiments validated the interaction between the YTHDF1 protein and FOXD2-AS1 (Fig. 4e). Subsequently, YTHDF1 was either upregulated or downregulated, and the transfection efficacy was confirmed by western blot (Fig. 4f,g) (Fig.4 F: Eca-109: shNC vs. shMETTL3-1, p < 0.001; TE-1: shNC vs. shMETTL3-1, p < 0.001) (Fig. 4g: Eca-109: Vector vs. YTHDF1, p = 0.006; TE-1: Vector vs. YTHDF1, p = 0.005) FOXD2-AS1 expression was significantly increased or decreased after YTHDF1 overexpression or knockdown, as assessed by qRT-PCR (Fig. 4h) (Eca-109: shNC vs. shYTHDF1, p < 0.001; Vector vs. YTHDF1, p = 0.005; TE-1: shNC vs. shYTHDF1, p < 0.001; Vector vs. YTHDF1, p < 0.001). Co-IP experiments confirmed the interaction between METTL3 protein and YTHDF1 protein (Fig. 4i). Moreover, RIP experiments confirmed that the interaction between YTHDF1 and FOXD2-AS1 was modulated when METTL3 expression was downregulated or upregulated (Fig. 4j) (Left: Eca-109: IgG: Vector vs. METTL3, p = 0.767; YTHDF1: Vector vs. METTL3, p = 0.006; TE-1: IgG: Vector vs. METTL3, p = 0.835; YTHDF1: Vector vs. METTL3, p = 0.004) (Right: Eca-109: IgG: shNC vs. shMETTL3, p = 0.713; YTHDF1: shNC vs. shMETTL3, p < 0.001; TE-1: IgG: shNC vs. shMETTL3, p = 0.849; YTHDF1: shNC vs. shMETTL3, p = 0.037). These results collectively demonstrate that METTL3 regulates the interaction between YTHDF1 and FOXD2-AS1.
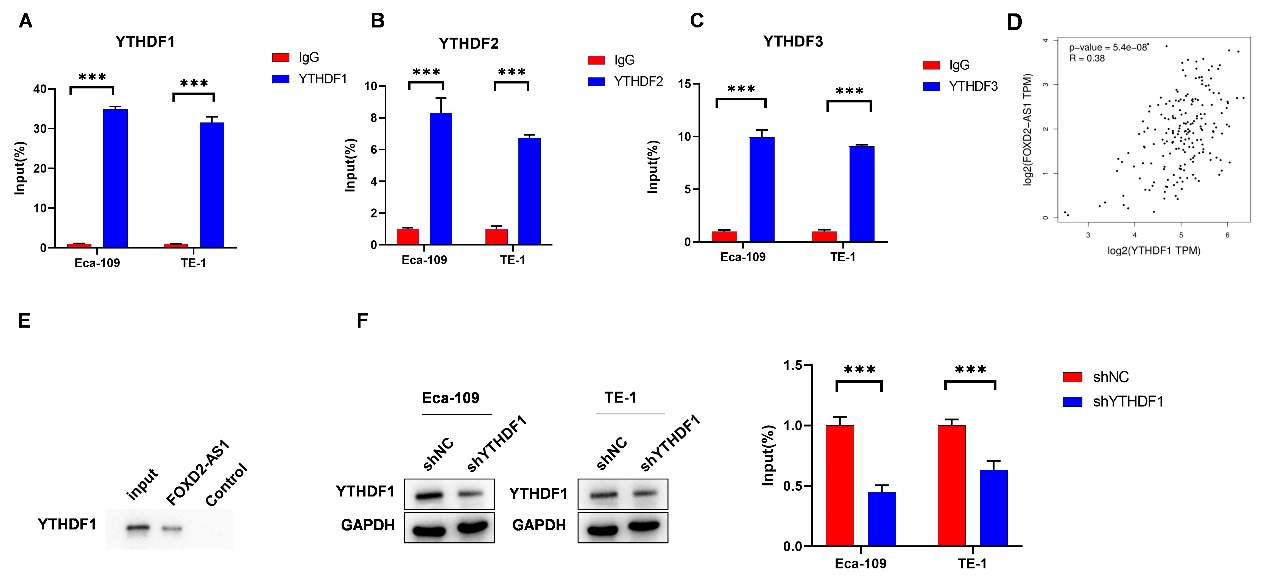
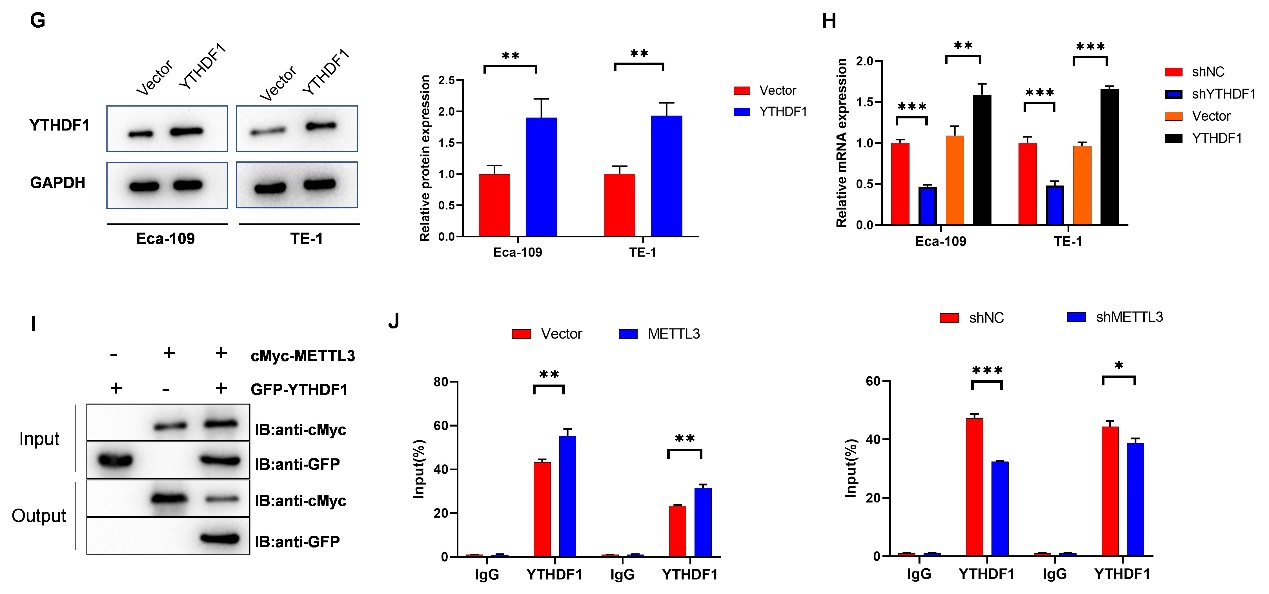


Fig. 4. YTHDF1 interaction with FOXD2-AS1: a) to c) RIP assay measured the binding affinity of FOXD2-AS1 with m6A methylation-reading proteins YTHDF1, YTHDF2, and YTHDF3; d) GEPIA analyzed a positive correlation between FOXD2-AS1 and YTHDF1 in EC; e) RNA pull-down analysis determined the binding of FOXD2-AS1 with YTHDF1; f) to h) Tumor cells were transfected with shNC, shYTHDF1, vector, and YTHDF1, and their effects were assessed by western blot. Changes in FOXD2-AS1 expression following YTHDF1 downregulation or upregulation were explored using qRT-PCR; i) CO-IP assay probed the interaction between METTL3 and YTHDF1; j) RIP assay investigated the effects of METTL3 knockdown or upregulation on the interaction between FOXD2-AS1 and YTHDF1. The impact of METTL3 depletion on their binding was also estimated through RIP assay. *p < 0.05, **p < 0.01, ***p < 0.001.
METTL3 regulated FOXD2-AS1 m6A modification to affect EC in vivo
Animal models were categorized into the NC group, METTL3 KD group, FOXD2-AS1 OE group, and METTL3 KD+FOXD2-AS1 OE group. Tumor sizes and volumes were significantly smaller in the METTL3 KD group than in the NC group, while larger tumor sizes and volumes were observed in the FOXD2-AS1 OE group. Tumor sizes and volumes were significantly larger in the FOXD2-AS1 OE group compared to the METTL3 KD group (Fig. 5a,b) (Fig. 5b: NC vs. METTL3 KD, p < 0.001;NC vs. FOXD2-AS1 OE, p < 0.001; METTL3 KD vs. METTL3 KD+FOXD2-AS1 OE, p = 0.004; METTL3 KD+FOXD2-AS1 OE vs. FOXD2-AS1 OE, p < 0.001) (Fig. 5c: NC vs. METTL3 KD, p < 0.001;NC vs. FOXD2-AS1 OE, p = 0.048; METTL3 KD vs. METTL3 KD+FOXD2-AS1 OE, p = 0.005; METTL3 KD+FOXD2-AS1 OE vs. FOXD2-AS1 OE, p = 0.049). Additionally, tumor weights were significantly reduced with METTL3 silencing but markedly increased with FOXD2-AS1 overexpression. Furthermore, tumor weights in the METTL3 KD+FOXD2-AS1 OE group were significantly heavier compared to the METTL3 KD group (Fig. 5c) (NC vs. METTL3 KD, p = 0.005; NC vs. FOXD2-AS1 OE, p = 0.527; METTL3 KD vs. METTL3 KD+FOXD2-AS1 OE, p = 0.298; METTL3 KD+FOXD2-AS1 OE vs. FOXD2-AS1 OE, p = 0.005). qRT-PCR analysis of tissues indicated that FOXD2-AS1 expression was decreased after METTL3 knockdown but enhanced following FOXD2-AS1 overexpression vector transfection. Moreover, the decrease in FOXD2-AS1 due to METTL3 silencing was reversed by FOXD2-AS1 overexpression vector transfection (Fig. 5d-e) (NC vs. METTL3 KD, p < 0.001;NC vs. FOXD2-AS1 OE, p = 0.005; METTL3 KD vs. METTL3 KD+FOXD2-AS1 OE, p = 0.007; METTL3 KD+FOXD2-AS1 OE vs. FOXD2-AS1 OE, p = 0.006). Upregulation of FOXD2-AS1 abrogated the mitigation of tissue injury caused by METTL3 silencing. FISH experiments revealed FOXD2-AS1 expression in tumor tissue, confirming that FOXD2-AS1 expression was reduced after METTL3 knockdown but enhanced after FOXD2-AS1 overexpression vector transfection. Immunohistochemistry revealed the expression levels of METTL3 and Ki67 in tumor tissues, with METTL3 knockdown reversing the upregulation of Ki67 levels caused by FOXD2-AS1 overexpression. However, METTL3 expression in the METTL3 KD group was downregulated, while METTL3 expression in other groups remained unchanged (Fig. 5f). Thus, METTL3 mediated FOXD2-AS1 m6A modification to affect EC in vivo.

Fig. 5. METTL3 regulated FOXD2-AS1 m6A modification to affect EC in vivo. Animals were divided into the NC group, METTL3 KD group, FOXD2-AS1 OE group, and METTL3 KD+FOXD2-AS1 OE group. a) pictures of tumors were exhibited; b) tumor volumes were measured every third day; c) tumor weights were recorded and plotted as a histogram; d) qRT-PCR analysis of the METTL3 expression in tissues of four groups; e) qRT-PCR analysis of the FOXD2-AS1 expression in tissues of four groups; f) Representative images of FISH staining for FOXD2-AS1, immunohistochemical staining for METTL3 and Ki-67, and HE staining of the tumors of mice. *p < 0.05, **p < 0.01, ***p < 0.001.
FOXD2-AS1, recognized for its role as an oncogene in esophageal cancer (EC), has been implicated in several aspects of the disease. For instance, Xue et al. demonstrated that FOXD2-AS1, in collaboration with MACC1-AS1, mediates cisplatin resistance in ESCC cells through NSD2 (15). Liu et al. revealed that FOXD2-AS1 overexpression induces cisplatin resistance in ESCC by interacting with miR-195 to regulate the Akt/mTOR pathway (16). Additionally, our previous work has demonstrated that FOXD2-AS1 enhances the proliferation and invasion capacities of EC cells via the miR-145-5p/CDK6 axis (17). Based on these findings, we systematically explored the mechanisms regulating FOXD2-AS1 in EC.
Extensive research has revealed the critical involvement of dysregulated m6A RNA methylation in various cancers, where it can exert either enhancing or suppressive effects (37, 38). Furthermore, emerging evidence suggests that long non-coding RNAs play a role in modulating METTL3 in various carcinomas. For example, in non-small-cell lung cancer, METTL3 promotes ABHD11-AS1 expression to enhance the Warburg effect (39). METTL3 has also been shown to stabilize the lncRNA SNHG7, thereby regulating the SRSF1/c-Myc axis and accelerating glycolysis in prostate cancer (40). Notably, we identified 12 m6A-mediated sites on FOXD2-AS1 using SRAMP, suggesting METTL3’s involvement in the regulation of FOXD2-AS1. Moreover, predictions from the ENCORI database indicate that only METTL3, not METTL14, exhibits relatively high expression in EC. Consistently, we observed upregulation of METTL3 expression in EC tissues and cells compared to normal counterparts. Subsequent functional experiments revealed that inhibition of METTL3 impedes proliferation and induces apoptosis in Eca-109 and TE-1 cells. These results suggest that METTL3 may regulate EC proliferation and apoptosis. Additionally, MeRIP assays confirmed a high m6A level on FOXD2-AS1, which was decreased when METTL3 expression was silenced, suggesting that FOXD2-AS1 might be mediated by METTL3 in an m6A-dependent manner.
Previous research has highlighted the crucial roles of m6A readers in facilitating the processing of m6A RNA methylation. For example, Anita et al. found that the dysregulation of m6A readers YTHDF1 and YTHDF3 is associated with metastasis and prognosis in breast cancer patients (41). In liver cancer, YTHDF2 was shown to facilitate the stem cell phenotype and metastasis by influencing OCT4 levels (42). To uncover the m6A reader involved in the modulation of FOXD2-AS1 by METTL3, we conducted RIP assays to measure the binding affinity between YTHDF1, YTHDF2, or YTHDF3 with FOXD2-AS1. Our results revealed the highest binding affinity between YTHDF1 and FOXD2-AS1, and this positive correlation was further supported by predictions from the GEPIA database. Subsequent mechanistic assays confirmed that METTL3 could influence the binding of YTHDF1 to FOXD2-AS1. Moreover, in in vivo assays, we demonstrated that METTL3 regulates FOXD2-AS1 to control EC tumor growth. This study represents the first exploration of m6A RNA methylation in EC and the mechanism underlying the METTL3/YTHDF1/FOXD2-AS1 axis in EC.
CONCLUSIONS
Our findings suggest that METTL3 regulates FOXD2-AS1 in an m6A-dependent manner through its interaction with YTHDF1, ultimately mediating the proliferation and apoptosis abilities of EC cells. These discoveries provide valuable insights into potential therapeutic targets for the treatment of EC patients.
Conflicts of interest. – The authors declare no conflict of interest.
Funding. – This project was supported by Jiangsu Provincial Health Commission Research Project Approval (No:M2021089).
Authors contributions. – Conceptualization, W.C.W.; investigation, X.C.L., statistical analysis, Z.Y.G., graphics, W.D.S.; writing, original draft preparation, review, and editing, Z.J.W. All authors have read and agreed to the published version of the manuscript.