
1. INTRODUCTION
Cartagena de Indias is a tourist city, located in the Caribbean region of Colombia, adjacent to the Atlantic Ocean. Thanks to its geographical characteristics, its natural and cultural attractions, its historical wealth and its hotel facilities and ports, among others, the city has become one of the main summers and business destinations in the Caribbean Sea. In fact, a high proportion of national tourists converge - surpassed only by the cities of Bogotá and Medellín; Likewise, in recent years it has maintained a constant growth in international tourist arrivals, thanks to the greater confluence of cruises to the country (Corpoturismo 2017). In this sense, in Cartagena de Indias, accommodation and restaurant services correspond to the third economic activity with the largest number of companies and it is the productive commitment that generates the greatest number of jobs in the city (Ramos, García and Villadiego 2017).
Despite its capacities and potential in tourism, Cartagena de Indias experiences a complex situation, with high levels of poverty and informality, which affect its competitiveness as a tourist destination. Against the above, in 2014 the tourist vocation of the city was emphasized as a generator of income, sources of employment and promoter of its development (Alcaldía Mayor de Cartagena de Indias 2004). At the same time, several sustainability and competitive improvement challenges were raised in front of similar tourist destinations, which have greater investment in infrastructure, better prices and human capital trained to serve tourists (Botero, Zuluaga, Camacho and Bermúdez 2010), challenges that remain valid. To the inconveniences of infrastructure, customer service, offer of services, mobility, environment, and insecurity (Caracol Radio 2019;Olivares 2011), new problems are added due to the growth in the number of annual visitors, such as overload in beaches (Razón Pública 2015;Ávila Romero 2015) and illegality (Vergara-Schmalbach, Cortez-Cantero and Martínez-Correa 2019), elements reflected in the quality of service that materialize in the conformity and satisfaction experienced by tourists (El Universal 2018).
Faced with the above, and to increase this volume of tourists and, consequently, the level of income, the quality of the service offered by Cartagena de Indias should become the central theme of any analysis (Prabaharan, Arulraj and Rajagopal 2008). Therefore, this article aims to assess the quality of service and the levels of satisfaction of international tourists arriving in the city of Cartagena de Indias, which allows identifying the elements with the highest incidence of satisfaction, as a basis for making recommendations aimed at improving future behaviour in users of the tourist service, thereby increasing the possibility that they have an intention to enjoy the destination again and, in turn, can recommend the city to third parties. With the understanding of the factors that affect the satisfaction of tourists, recommendations can also be generated addressed to both service providers, as well as government entities and tourism investors (Song, Li, Van Der Veen and Chen 2011), of Thus, this information constitutes an input for the formulation and implementation of policies and strategies aimed at the consolidation of Cartagena de Indias as a tourist destination (Salleh, Zarul, Othman and Idris 2014).
2. LITERATURE REVIEW
Assessing or measuring the quality of a service is a complex task, due to the characteristics of the services - difficulty in standardization, intangibility, production, and consumption at the time - (Zeithaml 1981). Therefore, the service should be interpreted as a process, with a stage of prior planning of resources, a stage of development and results that will be evaluated by the client (Grönroos 2001). These efforts to characterize the quality of the service are fundamental when you want to improve customer satisfaction, retention, and future behaviour (Gronroos 1982;Cronin and Taylor 1992;Fornell 1992).
Against this, authors such asOliver (1981),Grönroos (1982),Parasuraman, Zeithalm and Berry (1985) established a general characterization applicable to any service, based on the definition of a series of dimensions or stages that facilitate measurement of its quality, a benchmark widely adopted in the industrial and commercial area. These models are usually represented through tables or diagrams with two fundamental components related to each other: the assessment of perception and an analysis of the results, the latter represented by the satisfaction and future behaviour of customers or users (Dodds and Monroe 1985). These components suggest the identification of hypothetical relationships between key factors that characterize the service, and that can be analyzed through quantitative methods, determining the causal effects between perceptions -including perceived quality-, satisfaction and future behaviour.
The discussion on how to evaluate the quality of the service, access to quantitative methods and computer applications, have "(...) motivated researchers to propose new causal schemes focused on understanding the behaviour of consumers, focusing more on assessing their perceptions" (Vergara-Schmalbach and Quesada 2013). Mathematical models such as Structural Equation Models (or SEM), allow measuring the causal relationships between the factors or variables that characterize the service (Casas 2001) and that could facilitate the identification of the elements that affect the user satisfaction (Vergara-Schmalbach and Quesada 2011).
2.1. Satisfaction, quality, and future behaviours of the tourist destination
The construction of the tourist satisfaction indexes is based on the assessment of the quality of the tourist service, being satisfaction one of several available elements that allow it to be measured. The generic characterization in dimensions applied to services, proposed byOliver (1981),Grönroos (1982),Parasuraman, Zeithalm and Berry (1985), have a place in the characterization of tourist services (Al-ababneh 2013). In this sense,Middleton and Clarke (2012) suggest 5 dimensions or key components to assess this type of products: the attractions of the destination and the environment, facilities and services offered, accessibility to the destination, image of the destination and price charged to the tourist. In turn, each of these dimensions will consist of its own elements. For example, the attractions of the destination may be natural, buildings, cultural or social. This magnitude of variables that make up a tourist service makes it difficult to establish a single or universal index, leading researchers to propose the development of indexes and models specific to the characteristics of the destination and strengths of the services offered.
Authors of studies like the one proposed -between 1999 and 2019 - applied in the sector, demonstrate the existence of a variety of theoretical models -contextualized to the place of impact-. These studies tend to be dominated by latent or structural variables related to price (or cost paid), tourist loyalty, demographic characteristics, perceived quality, and overall satisfaction (Table 1). In this review, common aspects can be concluded, highlighting significant relationships between perceptions, satisfaction, and future behaviours of tourists, such as loyalty, image and repurchase intention.
| Authors | Latent Variables | Number of variables oserved | Size of the sample | Parameters used for the validation of the model | Software used | Results |
| Suhartanto and Kusdibyo (2019) | 4* Quality of experience, perceived value, satisfaction, and image of the destination | 18 | 400 | AVE, R2, t-student, GoF | Does not define | The results indicate that there are significant effects among the variables, except for the effect of perceived value on destination image. |
| Rojulai, Aminudin, Asmalina and Anuar (2018) | 3* Perceived impact of tourism (Economic, social, cultural, and environmental), Quality of life, Development in the sector | 27 | 400 | AVE, t-student | SmartPLS | Validate the relationship between economic, social, cultural and environmental aspects on the quality of life. |
| Van Ryzin, Muzzio, Immerwahr, Gulick and Martinez (2004) | 5* Perceived quality, Expectations, Satisfaction, Move Out, Trust Government., | 25 | 2000 | χ2, χ2/df, NFI, IFI, TLI, CFI, RMSEA | AMOS | Satisfaction affect the trust in local government officials and the intentions to move out of the city |
| Ghanian, Ghoochani and Crotts (2014) | 6* Image, Infrastructure, Perceived quality, Perceived value, Satisfaction, Commitment | 25 | 134 | χ2, χ2/df, NFI, IFI, TLI, CFI, RMSEA | AMOS | They determine as predetermining factors that influence the commitment to tourism and on which future tourism development will probably depend. |
| Salleh et al. (2014) | 5* Diversity of services offered, Infrastructure, Logistics, Security, Satisfaction | 19 | 193 | RMSEA, RMR, GFI, CFI | AMOS | They identify support services, the level of security, the overall trip and the diversity of tourism products as key factors affecting tourist satisfaction. |
| Al-ababneh (2013) | 4* Infrastructure (Restaurants, shops, tourist guides), Accessibility (maps, parking, and bathrooms) and Attractions (museums), tourist satisfaction | 34 | 180 | t-student | SPSS v. 18 | The results show a positive relationship between the characteristics of the tourism product and tourist satisfaction. |
| Li, Song, Chen and Wu (2012) | 8* Hotels, restaurants, shopping, attractions, transportation, tour operators, immigration, and satisfaction | 24 | 230 | t-student | SMART PLS v 2.0 | They recommend including tourism services with an intercultural approach for an international tourist destination. |
| Song, van der Veen, Li and Chen (2012) | 6* Perceived value, perceived performance, expectations, satisfaction, complaints, and loyalty | 15 | 2760 | t-student | Does not define | The results conclude that aggregate service satisfaction positively influences overall tourist satisfaction. |
| Untong, Kaosa-ard, Ramos,Sangkakorn, and Rey-Maquieira (2010) | 5* potential destination, economic impact, social and cultural impact, environmental impact, local resident support for tourism development in their communities | 15 | 1367 | χ2, GFI, AGFI, RMSR | LISREL | The results indicate that local residents consider the relationship with the private sector to be an important factor in boosting local tourism. |
| Martínez, Novello and Murias (2009) | 3* Loyalty, Global Satisfaction, Attribute Satisfaction | 11 | 1441 | χ2, CFI, TLI, IFI, RMSEA | AMOS | The results show that tourist satisfaction positively affects tourist loyalty. |
| Liang, Corbitt and Peszynski (2008) | 7* Personnel Service Quality; Order accuracy and quality; Order efficiency, discrepancy, and flexibility; Information service quality and product availability; Perceived service value; Overall tourists' satisfaction; Tourists' loyalty | 23 | 425 | χ2, χ2/df, GFI, NFI, CFI, CN, RMSEA, SRMR | SPSS | The results show that logistics service performance affect the tourist satisfaction and loyalty, |
| Chaitip, Chaiboonsri, Kovács and Balogh (2008) | 5* Travel Cost Satisfaction, Tourist Demographic, Tourism Product, Tourism Product Attribute, Tourism Product Management | 20 | 300 | χ2, NFI, GFI, AGFI, CFI, NNFI, RMSR | LISREL | This study concludes that tourist demographics positively affect the tourism product and its attributes. |
| Alen (2006) | 4* 2nd Order Model, Reliability, Convergent Validity, Discriminant Validity | 22 | 545 | χ2, χ2/df, GFI, CFI, IFI, RMSEA | AMOS | They made a comparison between scales, concluding that SERVQUAL offers greater diagnostic possibilities while SERVPERF has better psychometric properties. |
| Yoon and Uysal (2005) | 4* Push Travel Motivation, Pull Travel Motivation, Tourists' Satisfaction, Destination Loyalty | 11 | 248 | χ2, GFI, RMSR, RMSEA, NULL χ2, AGFI, NNFI, PNFI, CFI, IFI, RFI | LISREL | The authors establish a positive causal relationship between satisfaction and future behaviours. |
| Furutani and Fujita (2005) | 3* Degree of satisfaction for tourism resources, Convenience and availability of services, Comprehensibility, and appropriateness of sign in public spaces | 12 | 341 | χ2, CFI, AGFI | LISREL | Results show a relationship between service performance on foreign tourists' satisfaction. |
| Simó (2002) | 8* Discomfort, satisfaction, loyalty, williness to pay more for the service offered, intensification of the experience lived, desire to come back again in another trip | 27 | 200 | χ2, GFI, RMSEA, NFI, NNFI, CFI, AGFI, AlC | EQS | The study demonstrates a positive effect of satisfaction on loyalty, and of pleasure on loyalty. |
| Gandhi-Arora and Shaw (2002) | 9*Satisfaction with the event, Revisit Intention, Sex, Age, Marital Status, Education, Income, Number of Children, Employment | 10 | 500 | χ2 | LISREL | The study demonstrates a positive effect of satisfaction on loyalty, and of pleasure on loyalty. |
| Ko and Stewart (2002) | 5* Personal Benefit from Tourism Development, Perceived Positive Tourism Impacts, Perceived Negative Tourism Impacts, Overall Community Satisfaction, Attitudes for Additional Tourism Development | 26 | 732 | χ2, GFI, RMSEA, RMR | AMOS | The results indicate that resident satisfaction was related to both positive and negative perceptions. |
| Yoon , Gursoy and Chen (2001) | 6* Economic Impact, Social Impact, Cultural Impact, Environment Impact, Total Impact, Support Tourism | 29 | 321 | χ2, χ2/df, AGFI, GFI, IFI, CFI, NNFI, PNFI, RMSEA, SRSR, RFI | LISREL | Demonstrate a relationship between motivations, satisfaction and tourist loyalty |
| Oh (1999) | 8*Actual price, perceived price, perceived service quality, perceptions, perceived customer value, customer satisfaction, repurchase intention, word of mouth | 16 | 3451 | χ2, GFI, AGFI, CFI, TLI, RMSEA, t-value | LISREL | Results indicate a positive relationship between satisfaction, intention to repurchase and intention to communicate by word of mouth. |
2.2. Theoretical model
The construction of the theoretical scheme was adapted to a formative type of model, where observable variables affect latent or structural variables (Hair, Hult, Ringle and Sarstedt 2016). This model allows explaining the constructs from the indicators evaluated in the instrument. It consists of six (6) hypotheses based on possible causal relationships between the latent or structural variables present. The objective of this model is to evaluated the level of correlation that exists between the dimensions of quality used in the study and its direct effect on the satisfaction and future behaviours of the international tourist.
H1: There is a significant direct causal effect between tangibility variables and international tourist satisfaction.
H2: There is a significant direct causal effect between the variables of reliability and the satisfaction of international tourists.
H3: There is a significant direct causal effect between the responsiveness variables and international tourist satisfaction.
H4: There is a significant direct causal effect between security variables and international tourist satisfaction.
H5: There is a significant direct causal effect between the empathy variables and the satisfaction of the international tourist.
H6: There is a significant direct causal effect between the satisfaction variables and future behaviours of the international tourist.
Under the previous premises, which start from the theoretical assumptions referenced, a conceptual model or scheme is proposed to assess the quality of the service of the tourism sector of the city of Cartagena de Indias, whose dimensions are expressed through constructs that, first measure, characterize the service (tangibility, reliability, responsiveness, security, and empathy), and evaluate the levels of satisfaction and future behaviour (Figure 1). Each dimension or construct (known as latent variables in the model) was assessed through observed variables, synthesized in a questionnaire.
Source: authors’ own.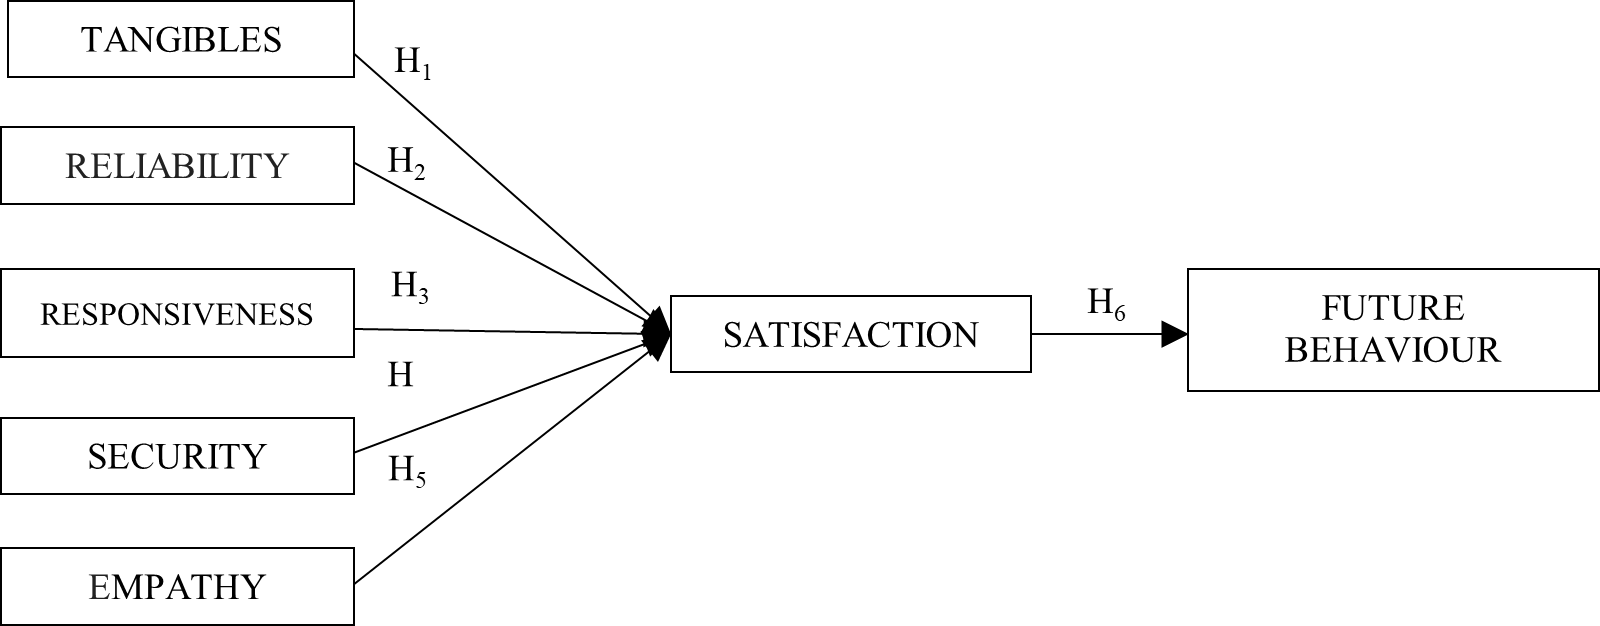
3. METHODOLOGY
For the interpretation of the model data of the present study, a Structural Equation Model (SEM) was applied, a technique that combines both multiple regression and factor analysis. This method allows not only to assess the complexity of dependency relationships, but also to incorporate the effects of measurement error on structural coefficients at the same time (Hair, Anderson, Tatham and Black 1999). Of the main postulates of the SEM, it is highlighted that it allows to evaluate or test theoretical models, becoming a relevant tool for the study of causal relationships over non-experimental data when these relationships are linear. It is for the above that, for the present article, the application of the model allowed to examine all the relevant variables in parallel, as well as contrast the theoretical model of the research and evaluate the significance of the hypotheses.
3.1. Materials and method
For the solution of the proposed model, the SEM-PLS technique (based on variances) was used, which can be used for the development of explanatory and predictive projects (Sarstedt, Ringle, Henseler and Hair 2014), using small samples, whose data are not based on normal behaviour (Cassel, Hackl, and Westlund 1999;Chin and Newsted 1999;Henseler 2010). The solution of the model was based on the weighted relationships scheme, a scheme that provides the highest values for R2 for the endogenous latent variables (Monecke and Leisch 2012), and they conform to explanatory type investigations, which are aimed at establishing relationships between a phenomenon and the theory that sustains it.
The software used during this study was SmartPLS 3.1.8, developed byRingle, Wende and Becker (2005). This software allows for the establishment of an SEM estimation and analysis model (Barroso, Carrión and Roldán 2010), which evaluates the measurement model and the structural model (Hair, Sarstedt, Hopkins and Kuppelwieser 2014;Wan Afthanorhan 2013), to establish relationships between indicators and constructs (Roldán and Sánchez-Franco 2012). The structural model was estimated, through the path coefficients, its significance level (R2 Coefficent of determination) and cross-validated redundancy (Q2 Crossvalidated redundancy) (Hair, Black, Babin and Anderson 2014).
For the development of the final model of valuation of the quality of the tourist service, a backward elimination analysis was chosen, starting with an initial model considering all the variables, to later eliminate the elements (latent and observable variables) not significant. In this way, it was concluded in a reduced final model, considering only the variables that have significant relationships (Diez, Barr and Cetinkaya-Rundel 2014;Kline 2011;Wang, Wright, Brownlee and Buswell 2016).
3.2. Questionnaire and measurement scale
To evaluate the model, an instrument was designed to assess the perceptions of the international tourists surveyed. This questionnaire was made up of 40 questions about tourism service perception and 6 questions about socio-demographic aspects.Table 2 shows the observable variables grouped by dimension evaluated. The observable variables included were adapted according to the scale and dimensions proposed in the SERVQUAL model (Parasuraman, Zeithalm and Berry 1985).
To obtain relevant research information, a Likert scale of 1 to 5 points was adopted. This scale is the most used in the methods of measuring perceptions (Vergara-Schmalbach and Quesada 2013), using one of several positions on the five-point scale (Hernández, Fernández and Baptista 2010).
For the perception of attributes, products and services of the city, a scoring scale was established with values from 0 to 5, being 0 = Does not know; 1 = Minimum qualification and 5 = Maximum qualification. Also, for the satisfaction of the experience, a Likert scale of 1 to 5 points was proposed, adjusted to the information that is desired to be collected from the respondents, such as:
A scale of 1 to 5, which reflects the degree of satisfaction that is perceived from the services received during the stay in the city of Cartagena de Indias, being 1 = Much worse than expected and 5 = Much better than expected.
A scale of 1 to 5, which expresses the level of general satisfaction with respect to your stay in the city of Cartagena de Indias, being 1 = Very dissatisfied and 5 = Very satisfied.
Finally, to measure future behaviour, the same measurement scale used in satisfaction was raised, ranging from 1 to 5 points, referring to how willing the respondent would be to recommend to a family member, friend, or partner, visiting Cartagena de Indias, being 1 = Unwilling and 5 = Very willing.
3.3. Population and sample
For the development of the research, 390 surveys were applied to Spanish, English, and Italian-speaking international tourists (the most recurrent languages of foreign tourists visiting the city), during the mid-year holiday season, between the months of June of 2018 and August 2018, with a confidence level of 95% and a margin of error of 5%, assuming an infinite population.
4. RESULTS
Of the 390 surveys applied, 386 records were accepted (for missing data and values that did not fit the measurement scale), indicating an approximate rate of 99% instrument application effectiveness. Of the total international tourists surveyed, 54.6% belonged to the male gender, from Europe (47.2%), Latin America (28.8%) and North America (22%). Likewise, tourists who visited Cartagena de Indias were accompanied by friends (37.9%), family members (35.7%), members of a sports team (11.9%), or members of a cruise ship (11.2%). On the other hand, most of the subjects surveyed indicated that it was the first time they visited the city of Cartagena de Indias (81.9%). The most frequent ages of tourists were in the ranges of 20-29 years (34.2%) and 30-39 years (29.3%).
4.1. Model solution
40 questions related to the assessment of the perception, satisfaction and future behaviour of international tourists were evaluated, based on the proposed causal scheme or models.Table 3 summarizes the main statistical indicators by variable observed. It should be noted that 15 missing data were found, which were treated as of their replacement by the most frequent or mode value of the variable (O’Loughlin and Coenders, 2004). The variables associated with satisfaction (S1 and S2) and future behaviour (IF1 and IF2) obtained the highest scores. On the other hand, the variables with the lowest scores were those associated with empathy (P32 and P33).
The model was validated through the bootstrap method, simulating 1000 subsamples to determine, in the first measure, the significance of the correlations between the dimensions (for a t> І1.96 І product of a two-tailed test and confidence level of 95 %) (Table 4).
* Significant at 0.01 level .
The final model proposes two significant relationships between empathy, satisfaction, and future behaviours. Non-significant relationships were eliminated step by step through the Backward Elimination technique. Applying the PLS technique confirms the correlations between empathy and satisfaction (0.357), and satisfaction and future behaviours (0.719). In this case, the variation in satisfaction scores is explained in 12.7% (R2) by empathy. In turn, the variation in the score of future behaviours is explained, to a large extent, by 51.7% satisfaction (Figure 2).
Source: authors’ own.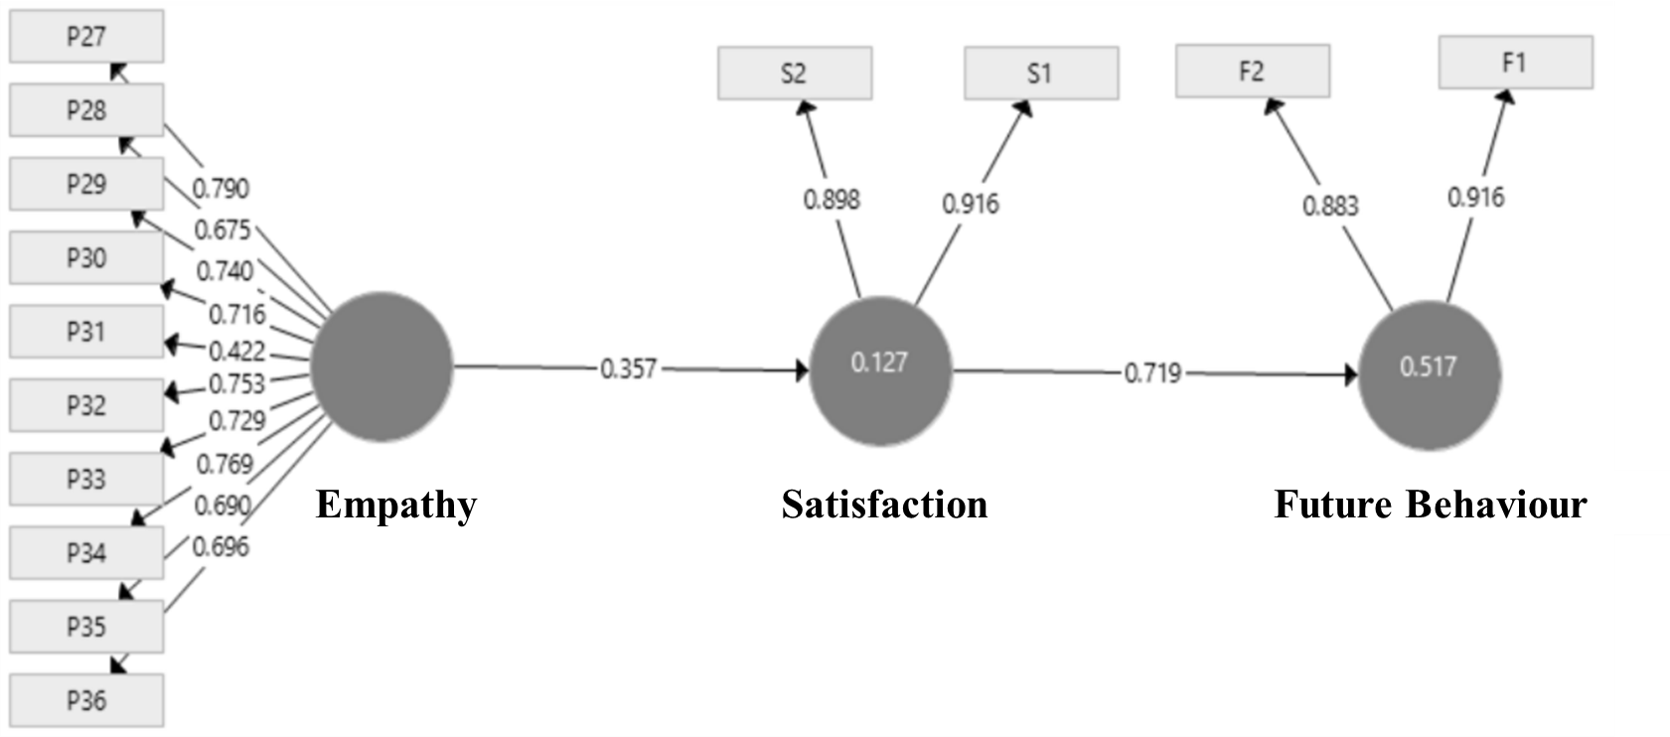
4.2. Model validity
The validity of the model is demonstrated through the Average Extract Variance (AVE) with values greater than 0.5 (Henseler, Ringle and Sinkovics 2009), indicating that more than 50% of the data is explained by each of the constructs. On the other hand, Cronbach's Alpha and Composite Reliability, with values greater than 0.7, demonstrate its internal consistency (Hair et al. 2014).
| Dimensión | Cronbach’s Alpha | Compound Reliability | Average Extraction Variance |
| Empathy | 0.89 | 0.91 | 0.50 |
| Future behaviour | 0.77 | 0.90 | 0.81 |
| Satisfaction | 0.79 | 0.90 | 0.82 |
The results of the Variance Inflation Factor (VIF) applied to the relationships between the observed variables show values below 10, indicating non-presence of multicollinearity (Henseler, Ringle and Sinkovics 2009) (Table 6).
Source: authors’ own.5. DISCUSSION AND CONCLUSIONS
The purpose of this study was to assess the quality of the tourist service of Cartagena de Indias from the products and services offered by the destination evaluated from the perspective of international tourists, through the identification of latent and observable variables, the design of an instrument , the approach of six hypotheses based on a causal model solved by the technique of Partial Minimum Squares, establishing the significant relationships between attributes and identifying the key elements that affect satisfaction. The model was successfully applied in the context of the city's tourism service, demonstrating the high relationship between empathy (a construct representing the perceived quality dimension), satisfaction and future behaviour of international visitors to the city of Cartagena de Indias, providing a solution to the research problem posed.
After the application of the causal model, empathy and satisfaction were found to be decisive for the future behaviours of the international tourist regarding Cartagena as a sustainable tourist destination. Empathy has a high correlation with satisfaction, shown in the model as a significant motivator of tourist satisfaction levels. The above results are consistent with the findings ofGhanian, Ghoochani and Crotts (2014);Al-ababneh (2013);Song, van der Veen, Li and Chen (2012), andHamsanandini et al. (2017). The other dimensions, (tangible, reliability, responsiveness, and security) seem to have no significant impact on satisfaction, concluding that, of the six hypotheses presented, the two statements (H5 and H6) were accepted.
It should be noted that satisfaction had a positive evaluation globally. The surveyed tourists were generally very satisfied with the destination, as well as with the services received during their stay, which continues to position Cartagena as one of the main tourist destinations in the country, given that they find different products such as sun and beach, heritage, gastronomic and a good hotel offer of accommodation and lodging.
Despite the previous results, at present, there is great uncertainty about the evolution of the Covid-19 pandemic and its economic impact on the tourism sector in Cartagena de Indias. Faced with this scenario, the prompt formulation of strategies is required to enable the recovery of tourist confidence. For this reason, and in accordance with the results of this study, it is recommended that the authorities in charge of strengthening the city's tourism sector include, as part of their strategy, the periodic assessment of the perception of the quality of service and the satisfaction of international tourists. This assessment should also include the level of compliance with biosecurity measures by service providers.
The above measures are of great importance, as they will serve as a basis for the development of new tourism services that are in line with the expectations of tourists. The measures are also in line with the current conditions imposed by Covid-19, which require all actors in the sector to provide sustainable, responsible and safe services for both themselves and the tourists.
Finally, the limitations of this research lie in the estimation methods used (PLS-SEM), the population under study (international tourists), the variables defined and the specific context in which it was applied (tourism sector of Cartagena de Indias). In future research, it would be worthwhile to analyze the effect of the inclusion of other variables in the model, such as socio-demographic variables. The inclusion of domestic tourists in the sample may also be considered.