
1. INTRODUCTION
Students spend many hours on campus, and eating on-campus is an inevitable activity (Joung et al. 2014). College dining is roughly an 18-billion-dollar industry and plays a key role in university communities, especially students’ mental and physical health and social life (Foodservicedirector.com 2018). Market research firms report that it’s a market continuing to grow with 54% of students buying their food on campus compared to a 35% buying off campus (Technomics 2019), amounting to 1.6 billion visits between March 2015 and March 2016 (Wirth 2019). One of the overarching missions of college food service management is keeping students well-nourished and healthy and campus foodservice operations hold the key responsibilities to meet the mission. Interestingly, a more recent study found that 69% of college students eat off-campus at least once a week and only 33% of college students are satisfied with their current on-campus foodservice facilities (Smith, White-McNeil and Ali 2020). When so much food and menu options available outside of campus as well as mobile food ordering and delivery services, the students will easily lose their interest in on-campus dining experiences and food, and quickly leave campus to find better food options and experiences (Technomics 2016).
Millennials or Generation Y, refers to a generation born between the eighties and the start of the new millennium. According toKuhns and Saksena (2015), in the United States, there are approximately 73 million Millennials in comparison to 72 million baby boomers. Those that are millennials range from working adults who are forty years old to those that are college students in their early twenties, and with such a range in age difference, it is vital that restaurants recognize their preferences in food choices. Millennials have a different set of personality characteristics, values, behaviors, expectations, and perspectives (Lancaster 2016). They are considered as the most educated, well-travelled, and technologically sophisticated generation in general. This generation has always lived with technology in their hand, with tablets and mobile devices such as a cell phones. This group is considered to be more process focused and less outcome focused (Berkup 2014). For Generation Y, making a lot of money is not the driving force. Instead, they value their contribution to society and their role as parents more.Setiobudi and Herdinata (2018) found that monetary gains do not drive this generation, but not having any may lead to the loss of sense of self fulfilment. Generation Z is individuals who were born after 1995 (Lindell 2018). In comparison to other generations, Generation Z is known to be missing interpersonal skills such as talking to people and also may lack the skill of being a good listener. They often appear to be “awkward” and have difficulty relating to others. Their preferred method of communication tends to be using online platforms (Tulgan 2013). As Generation Z is the newest generation, there is not much information on this youngest generation. These two youngest generations in the nation are the largest consumer group in the nation since 2018, and their ever-changing consumer demand is drastically reshaping the foodservice industry, specifically the on-campus dining industry (Sheldon 2019).
Many previous researchers have tried to examine what factors are important for college students’ on-campus dining experience and the service during the last several decades (Joung et al. 2014). But, for the newest generations, little research on young generation college students’ on-campus dining experience and perception was conducted. Therefore, an instrument called DINESERV was used in this study to measure diners’ satisfaction in on-campus foodservice delivery. AsMarkovic, Raspor, and Segaric (2010) pointed out, the quality of service in the foodservice industry is difficult to assess since it is not all about the service outcome, but also the process of service delivery to diners. Additionally, in on-campus dining, service quality is an essential factor of customer satisfaction (Joung et al. 2014).
Therefore, the purposes of this research is to better understand why college students eat on-campus. Also, this research aims to compare highly satisfied and low satisfied groups on their on-campus dining experience and behavior and to understand what values college students are currently satisfied with and looking for from their on-campus dining. From the findings of this research, on-campus foodservice operations will find the answers to satisfy the new and young college students and keep hungry students on campus.
2. CONCEPTUAL BACKGROUND AND HYPOTHESES
2.1. The Younger Generations – Generation Y (Millennials) and Generation Z
There are numerous generations in this nation. World War II Generation are those that are born before 1933, the swing generation is those that were born between 1934 and 1945, baby boomers were born between 1946 and 1964; Generation X was born between 1965 and 1980, Generation Y (millennials) is individuals who were born between 1981 to 1996, and Generation Z is those who were born after 1995 (Stegelin 2002;Parment 2013). According to theUnited States Census Bureau (2019), there are 73 million millennials in the United States. They are characterized as being the most mobile and independent (Stegelin 2002). They tend to rely on prepared food from home instead of eating out and they tend to make wise food purchases using their hard-earned money (Hammond 2013). On the other hand, Generation Z are known as the iGeneration, or post-millennials (Hardie 2018) and there are 90.77 million Generation Z in the United States, the largest generation so far (US Census Bureau 2018). They were brought up during a time when political and global issues were forefront and are characterized as being realists and not easily influenced or fooled by marketing gimmicks and false advertising (Hardie 2018).
When it comes to eating habits and spending power, the millennials and Generation Z (Gen Z) have a very different attitude than any other generations that exist in this nation (Kuster, Vila and Srabia 2019). According toPulido (2019), between 1943 to 1964, there were over 78 million baby boomers being born, more than Generation X, Y, and Z combined. These baby boomers may have the largest spending power, but they do not splurge on the latest craze. Rather, they inform themselves on what they need and are self-aware on how much they can afford to spend to meet their needs in food selection. According toPwC (2016), by the year 2020, half of the consumer population were millennials.Delbosc et al. (2019) points out that millennials have a tremendous impact on food spending since they represent roughly 26% of the United States’ population and contribute to one trillion-dollar worth of spending power (Millennial Marketing 2016). Furthermore,Morton (2002) indicated that they have the strongest impact on major family purchasing decisions as well. Additionally, their food consumption and influence in the food industry has already drastically changed the way food companies market their products. Unlike other generations,Morton (2002) stated that millennials and Gen Z rely heavily on the views of their peers along with social media when it comes to decisions on what to buy and how much to spend. In addition,Hewlett, Sherbin and Sumberg (2009) found that millennials make purchases based on the value of the product, convenience of purchase, and reasonable pricing. They also have the habit of shopping around, looking for the best deal by comparing prices (Parment 2013).
2.2. Gen Y and Z’s eating habits and eating behaviour
2.2.1. The most tech-savvy generation
They grew up in a world with internet, mobile devices, and apps that are easily accessible. This created an opportunity for them to have access to infinite choices of flavor from all over the world and that access has the ability to impact the eating habits of other generations at the same time (Millennial Marketing 2016).Lindell (2018) points out that since they grew up with technology, they learn how to cook from videos online since it is more practical, healthier, and less expensive than eating out at a restaurant. According toKlara (2016), restaurants such as TGI Friday are spending millions of dollars to redesign their restaurants to cater to millennials. He pointed out that millennials expect up-to-date technology that includes WiFi, Apple pay, digital reservation capabilities, and the use of tablets to place food orders. In addition,Jennings (2016) added that fast food restaurants such as Chick-fil-A specifically designed their mobile app for millennial parents to order and pay for their meals ahead of time.
2.2.2. Quick service & Convenience
According to Chick-fil-A surveys, 82% of millennial parents rank quick service as their top priority and 48% would rather skip the meal than wait in line (Jennings 2016). Furthermore,Ruggless (2016) pointed out that millennials prefer quick chain restaurants rather than dining in, especially those that offer grab-n-go packaged meals. In addition, a restaurant’s information such as menu, location, and directions should be readily available on smartphones as many millennials are always “on the go”. On the other hand,Tuttle (2015) points out that millennials tend to shop at gas stations more regularly because of convenience.
2.2.3. Healthy options
Nowadays, a healthy lifestyle is forefront in the news media.Peskett (2006) indicated that millennials are the driving force behind the healthy eating trend and they are spending more money on food than any other generation. Young generations prefer organic food and freshness compared to the older generations (Ruggless 2016). In 2011, Chen investigated food choices of those that wish to maintain a healthy lifestyle. He found that consumers who are health conscious tend to choose foods that are dietary in nature with rich nutrients (Chen 2011). According toFinancial Times (2016), mergers and acquisitions of foods have changed the way their foods taste to tailor millennials since they prefer healthier taste options. Furthermore,Retail Merchandiser Publication (2014) indicated that millennials and Gen Z are more engaged in preparing their meals than other generations. In fact, the complexity of preparing breakfast is the focal point of their daily meal. Furthermore, according to Gordon Good Services (n.d.) andTechnomics (2019), both indicated that in order to please Generation Z, menu items must be natural, organic, and sustainable. Additionally, listing using keywords on products such as local, authentic, farm-raised, organic, and free-range helps to inform Generation Z that they are socially responsible and ultimately to justify the need to pay more for the goods.
2.2.4. Trendiness, Value and Experience
According toGordon Food Service (n.d.), the trend of Generation Z in food selection is that they want everything that they can imagine. They want delicious food, exciting flavors, anytime, anywhere. The value of the meal is also taken into consideration. In addition,Turow (2015) points out that millennials have a higher level of involvement in food choices; they look for food that provides new experiences and self-expression. Their expectations are high considering they grew up with TV shows that teach them how to cook and experiment on their own.
2.2.5. Social gatherings and peer groups
Aside from making healthy food choices, research has shown that millennials seek the opportunity to eat together among referent groups and interact together with peers (Abraham and Harrington 2015).Abraham and Harrington (2015) also pointed out while socializing within their referent group is a typical habit among millennials, they will also bring food from home rather than eating out during lunch. This is largely driven by their healthy eating habits as indicated above. Furthermore, it is worth noting that not all social gatherings are equal among referent groups. Research indicates that millennials view elegant dining that involves wine as a representation of social class rather than referent groups gathering (Teagle, Mueller and Lockshin 2010).
2.2.6. Variety seekers
According toFinancial Times (2016), most of Generation Z enjoy exploring a variety of food from different cultures. On the other hand, older Gen Z tends to enjoy dining at restaurants that use unique ingredients resulting in tasty flavors. For example, restaurants are using flavors such as tamarind, lemongrass, and vinegar in their menus to provide a memorable experience for diners especially among Gen Z. An August survey byFood-management.com (2020) asked college and university foodservice experts about Gen Z preferences; they found that they prefer to have a variety of options. Their preferences include:
Have a variety of ethnic comfort foods available all day long.
Have authentic dishes from other parts of the world such as Mediterranean, Southeast Asian, Korean, and Middle Eastern.
Have other flavors that are unique, hot, spicy, etc.
Have a menu that has plant-based options.
Millennials live in a fast-paced world using technology such as smartphones, smartwatches, tablets, and other electronic devices to connect with everything that goes on in their lives. According toFinancial Times (2016), it is estimated that they have over 250 billion dollars of spending power. Therefore, it is vital for the food industry to create products that appeal to them. With the vast amount of food information online, they are well educated on a variety of cultures and their cuisines.
2.3. DINESERV and its history
2.3.1. DINESERV
DINSERV is an instrument that was created by Stevens,Knutson and Patton (1995) specifically for the restaurant industry, and it was derived from SERVQUAL that measures the difference between what consumers hope to receive in terms of service versus what they actually get in service organizations. The first draft of DINESERV had forty items regarding what should happen during a dining experience. By using a seven-point Likert scale, respondents were able to rate “strongly agree” to “strongly disagree” on their dining expectations and experience (Stevens et al. 1995). The sample was those who identified themselves as regular restaurant goers within the last six months. In their study, three categories of dining experience were revealed. There were close to 200 participants in each of the three categories in fine dining, casual dining, and quick-service dining. In order to improve the internal consistency and parallelism, a newer version of DINESERV was developed and the forty items were narrowed down to twenty-nine items (Ogletree and Chandan 2014). DINESERV consist of five dimensions: tangibles, reliabilities, responsiveness, assurance, and empathy.
Studies have shown that these five dimensions have a strong impact on customer satisfaction and customer loyalty. Researchers such asChow et al. (2017),Dean (2002),Fu and Parks (2001), andLadhari (2009) have done studies that indicated service quality as the major factor of customer loyalty. Furthermore,Chow et al. (2017) andFu and Parks (2001) showed that there is a direct connection between service quality as it relates to customer loyalty in restaurants.Chow et al. (2017) points out the better service quality restaurants provide, the higher of customer retention it receives. Furthermore,Carrillat et al. (2009),Ha and Jang (2010), andParasuraman and Varadarajan (1985) found that service quality translated into customer satisfaction, and, as a result, affects customer loyalty. For example,Caruana (2002) pointed out that customer satisfaction is the facilitating factor between service quality and customer loyalty. Therefore, in order to retain customer loyalty, restaurants are focused on providing higher level of service quality that results in higher customer satisfaction (Pfeifer and Farris 2004;Berry, Zeithaml and Parasuraman (1990). Current literature on DINESERV pointed out that when a customer is loyal to an eatery, they will go out of their way to revisit the same restaurant despite the fact that the competitors may offer cheaper prices while providing the same products and services (Chen et al. 2018). In addition,Lupo and Bellomo (2019) added that customer loyalty is a good indicator of customer service success.
2.3.2. History of DINESERV
Service quality research has been the forefront of the hospitality industry since the 1980s. During this time, the concept of service quality was thought to be the most significant impact in the restaurant industry. In 1988, Parasuraman created a SERVQUAL model to measure service quality and it was quickly adopted and preferred by many researchers over any other instrument at that time (Stevens et al. 1995). However, other researchers felt that the model was not suited for measuring all types of services including the restaurant industry. As a result,Stevens et al. (1995) used the concept of SERVQUAL and developed a 29–item scale named DINESERV to address the need to measure service quality in the restaurant industry. It used the five dimensions from SERVQUAL and translated that into DINESERV as a way to measure restaurant’s service quality. Since then, countless research studies have used DINESERV as a way to measure restaurants’ service quality (Kim et al. 2009a;Markovic et al. 2010).Bougoure and Neu (2010) used DINESERV to examine the connections between service quality, service quality perceptions, customer satisfaction, and the intention to repurchase at a university in Malaysia. The results of their findings support the five dimensions of DINESERV mentioned above. In addition,Markovic et al. (2010) not only used DINESERV to compare dining customers’ experience between expectations and perceptions of service quality, but they also identified a number of dimensions using the modified DINESERV model and tested the reliability of it. Lastly, in looking at best practices in service quality,Adeinat (2019) used Data Envelopment Analysis (DEA) tool to analyze the data collected from DINESERV questionnaire to interpret the restaurant’s efficiency in customer service at three different restaurant locations. The results suggest that two of the three restaurants were running efficiently in terms of customer service, but having similar customer service scores from the results do not necessarily mean the restaurants are functioning at a similar level. Therefore, the contrast factors from these studies in contrast to the DINESERV factors propose the limitation of the DINESERV model.
Furthermore,Nandhini and Krishnaraj (2018) have determined the essential factors by measuring the variables in each factor of DINESERV that result in the inclusive service quality in the restaurant industry. By using confirmatory factor analysis, they were able to confirm that the six DINESERV factors of: Relationship benefits, Empathy, Communication, Food quality, Price fairness, and Tangibles are indeed essential. In addition to their study, there was a strong connection between food quality that correlate to the overall service quality experience. On the other hand,Kim et al. (2009a) used a modified version of DINESERV to determine the reliability and validity on service quality in foodservice operations. They found that a positive foodservice quality experience is essential because it leads to diners wanting to recommend to others in the form of “word of mouth” to those around them. From this study, it is evident that positive customer satisfaction is directly correlated with the quality of products and positive foodservice quality experiences. They concluded by suggesting that DINESERV can be used in a variety of settings not only in the United States, but also in Asian countries to measure foodservice quality. Moreover,O’Mahony, Sophonsiri, and Turner (2013) looked at how each dimension of service quality may affect customer satisfaction and loyalty in the restaurant industry. Their study revealed that of the service quality dimensions, tangibles and empathy had the most significant influences on customer satisfaction and customer loyalty; whereas, reliabilities, responsiveness, and assurance had minimal impact. Also, they found that customer satisfaction appears to contribute to the factors of service quality dimensions on customer loyalty. Their results are aligned with what was found inKim et al. (2009a) research study.
To strengthen the validity of the study, previous researchers used Importance-Performance Analysis (IPA) and factor analysis to analyze consumer’s satisfaction with their dining experience by giving an insight into which aspect of the dining experience restaurants should focus their attention on to as well as identifying areas that are consuming unnecessary resources. For example,Martilla and James (1977) pointed out that IPA provides “where attributes are important and also where performance can be improved” (p. 77-78). There are a number of research articles that combined the above service quality instruments mentioned to strengthen their research studies. For instance,Rood and Dziadkowiec (2013) used SERVQUAL and IPA to examine the quality of services perceived in two different countries. In doing so, SERVQUAL was able to provide the negative gap in quality deficiencies and IPA was able to demonstrate the importance of service quality gap (Rood and Dziadkowiec 2013). In another study,Bufquin et al. (2015) looked at social connectedness and food healthfulness by using DinEX. Similar to DINESERV, this instrument has its own five service quality dimensions in food, service, atmosphere, social, and health. To add to this, this study also incorporated IPA to help minimize the weakness in the study. The end results suggested that food, service, and atmosphere are essential attributes in service quality and that the restaurants are meeting the expectations of their guests.
DINESERV in association with LODGSERV uses the five dimensions of service quality in assurance, empathy, reliability, responsiveness, and tangibles. In one study,Keith and Simmers (2011) utilized questions within the DINESERV instrument in the form of comment cards to measure consumers’ satisfaction with their dining experience. Their findings suggest that utilizing questions from DINESERV may be helpful, but it is important that it addresses at least one of the five dimensions of service quality mentioned above. However, it is worth noting that DINESERV was created over twenty-four years ago, and some researchers may view it as being outdated. For example,Carman (1990) indicated that the definition of the dimensions are vague and it needs to be customizable to certain service industry. However, many previous researchers consistently found the reliability and validity of DINESERV and its critical impact on customer satisfaction and consumer behavior such as revisit intention and loyalty (Kim et al. 2009a). And many researchers still utilize DINESERV for their research with the belief that DINESERV provides a well-known conceptual model of the restaurant services quality together with a suitable hierarchical structure of evaluation criteria and sub-criteria (Lupo and Bellomo 2019). According toKim et al. (2009b) DINESERV is a reliable, valid, and relatively simple instrument for determining how consumers view a restaurant’s quality. DINESERV was developed in 1995, so there is a more than 25-year gap between the original DINESERV research and the current research. This time difference might affect the results of the study even though the same measurement tool is used. People’s values change every day (McKeachie and Svinicki 2013). Similarly, an individual’s values and perceptions on the service qualities and dining properties might have changed over the course of the 25 years between these two studies. The changing values of human beings over the course of time might cause different results between the two research studies. More importantly, there is a lack of research being done on the newest and youngest generations, millennials and Gen Z’s on-campus dining experience, especially in the five dimensions of service quality. Therefore, the use of DINESERV instrument for the purpose of this study is applicable and appropriate.
2.4. On-Campus Dining Industry in the USA
According toLam and Chen (2012), on-campus dining and food service is one of the largest areas in the food service industry. Looking at students’ on-campus dining experience is important because students who are happy with their dining experience are more likely to stay loyal to that restaurant by going back to it again and again. Therefore, students who are pleased with the dining experience and services are more likely to return and are more willing to share their positive experience with their friends and family (Yuksel and Yuksel 2002;Oh 2000). On-campus dining must recognize the importance of customer satisfaction in order to have repeated diners and to have long- term success since disgruntled diners will most likely not return, or worse, tell others not to go. The three largest food service contract management companies in the United States includes Sodexo, Aramark, and Compass. However, Aramark has become the forefront of food service providers in almost 400 colleges and universities (Oches 2013). According to theNational Center for Education Statistics (2018), the number of college students (including millennial and Gen Z) is expected to increase to 17.2 million by the year 2028 and there will be a huge demand for on-campus university food service.Knutson (2000) suggests that there is a need to evaluate on-campus food service because studies have shown that students will go off campus for food options when their food needs are not met. Moreover,Eckel (1985) points out that on-campus food service and quality must be maintained to attract and retain students to dine on campus. Furthermore, periodic improvements must be made to keep up with millennials and Gen Z’s food preferences (Eckel 1985). Another option that accounts for on-campus dining is having food trucks available on campus. One article points out that the overall climate of on-campus has continued to change over the years, and having mobile food service such as taco trucks are in more demand since millennial students want more options in food choices that provide a quick meal (Anonymous 2010). Therefore, this research attempts to find out how satisfied millennials and Gen Z students are with their current on-campus dining and its service, and also what specific food options and services millennials and Gen Z students want to have. Therefore, the following hypotheses were proposed.
H1. There is a significant difference in the mean of Tangible between low and highly DINESERV satisfied.
H2. There is a significant difference in the mean of Reliability between low and highly DINESERV satisfied.
H3. There is a significant difference in the mean of Responsiveness between low and highly DINESERV satisfied.
H4. There is a significant difference in the mean of Assurance between low and highly DINESERV satisfied.
H5. There is a significant difference in the mean of Empathy between low and highly DINESERV satisfied.
H6. All five aspects (dimensions) of DINESERV are significantly correlated with the mean value of DINESERV.
3. Methods
3.1. Data Collection
The population for this research is Gen Y and Gen Z who have eaten at colleges’ on-campus dining facilities. Generation Y, millennials, are individuals who were born between 1982 and 1994, and Generation Z is individuals who were born after 1995 to present. Our sample was any college students who have eaten at on-campus dining facilities within the last 30 days as customers can reliably recall their dining experiences from the past 30 days (Liu and Tse 2018). A mass email was sent out to faculty member of universities to seek survey participation. The faculty members who agreed to support this research sent out the survey link to their students who were enrolled in their courses. The survey was distributed to a total of 780 college students who were currently enrolled in the major universities in California. However, 272 valid and completed surveys were collected with the response rate of 34.87%. Among the 272 completed surveys, 28 of them were not usable since they have not eaten at any of the on-campus dining. (N=244). The size of sample was adequate given the usual “rule of thumb” of a minimum of five respondents per item used in a scale (Hair et al. 1998).
3.2. Measurement
Survey design was used for this research. The first section of the survey included the introduction of the survey and questions asking the participants’ experience and behavior on on-campus dining: number of times they eat on-campus, spending habits at the on-campus dining facilities, and the reasons to eat on campus or why not to eat on campus. The second section of the survey instrument contained the demographic information questions asking about age, genders, household income, and full- or part-time status. The last section of the measurement contained a total of 29 items measuring the five dimensions of DINESERV (Stevens, Knutson and and Patton 1995). The first ten items are about tangibles, and the next five items were about reliability. The next three items were about responsiveness, the next six items about assurance and, the last five items about empathy. The same exact 29 survey items that the original DINESERV had were used in this study, except for the one question regarding parking facilities since the on-campus dining facilities do not have their own, separate parking facilities. All of the dimensions showed Cronbach’s alpha value between 0.89 and 0.95, indicating that questions in each construct measure a similar concept (Cronbach 1951).Table 2 shows the results for Cronbach’s coefficient α.
| Number of Items | Cronbach’s α | |
| Tangible | 10 | 0.912 |
| Reliability | 5 | 0.910 |
| Responsiveness | 3 | 0.890 |
| Assurance | 6 | 0.946 |
| Empathy | 5 | 0.92 |
3.3. Data analysis
Only valid cases were left for the data analysis after missing, invalid, and mis-coded cases were deleted. Cluster analysis was conducted to group the cases based on the mean values of DINESERV. The mean value of DINESERV were calculated using the 29 DINESERV questions. The two clusters were extracted, and then, t-test and correlation were conducted to determine whether there were any significant differences between the clusters and to examine the correlation between surveyed factors and the mean values of DINESERV. The Statistical Package for the Social Sciences (SPSS) version 22.0 was utilized.
Cluster analysis is beneficial “to group entities on the basis of their similarity with respect to selected variables, so that members of the resulting groups are as similar as possible to others within their group (high within-group homogeneity) and as different as possible to those in other groups (low between-group homogeneity)” (Clatworthy et al. 2005).Two-step clusters method was used to cluster groups based on the mean values of DINESERV. As DINESERV is a main concept of this research project, the mean values of DINESERV were selected as a variable to classify the participants into a high DINESERV and a low DINESERV group. By using the clusters extracted, correlation and t-test were utilized for data analysis in order to compare the two clusters’ similarities and differences relevant to the Gen Y and Z’s perception and behaviors on on-campus dining. Also, descriptive data such as demographic information on the participants, and on-campus dining experience were analyzed in order to have overall information on the participants.
4. Results
Descriptive statistics were calculated to obtain an overall representation of the sample. Regarding gender, 70.9% of respondents were female (n=244), and the majority of respondents were in the range of 20 to 29 years old (68.9%). In terms of generation, 74.2% of the respondents were Generation Y and 25.8% of the respondents were Generation Z. Regarding ethnicity, 34% of the respondents were Hispanic or Latino, followed by 22.5% of white or Caucasian and 20.5% of Asian. In terms of marital status, 90.6% of the respondents were single. Regarding the college years, 31.6% of the respondents were senior, followed by 30.7%% junior, and 21.3% sophomore. With respect to student status, 92.2% of the respondents were full time students who were taking 12 or more units. In terms of household income, 45.1% of the respondents earned less than $25,000, followed by 22.5% falling in the range of $25,000 - $54,999.Table 3 summarizes the respondent profile.
As shown in thetable 3, the sample perfectly represents college students in the western area of the U.S. According to California’s Bay Area Census that was done in 2010, millennials are categorized within the 18-24 age bracket which makes up 85% of California's population (Bay Area Census 2010). In addition, 50.4% were female and 49.6% were male and roughly 10% were living in poverty. Among all the hospitality majors in the USA, 61.0% were female and 39.0% were male, which matches with the respondents in the survey (Jogaratnam and Buchanan 2004). The average income per capita is around $38,000 annually. Furthermore, according to theNational Center for Education Statistics (2018), there were 12 million full time college students and 7.7 million part-time college students in 2020. Another resource indicated that in California, there were 2,636,921 full-time and part-time college students enrolled in Fall, 2013 and 36.1% of these college students were Hispanic (Ballotpedia.com 2016). Moreover, diversity plays a large role in the make-up of California’s census. In the United States, those who identify themselves as White American are the racial majority and nonwhite are considered minority groups. However, in California, the majority are represented by the minority group that accounts for more than half of the Bay Area’s census. California’s 2010 Census report indicated that Hispanic and Latino Americans represent 23.5% of the Bay Area’s population followed by 23% of Asian Americans, 6.5% of African Americans, and 0.6% of Native Hawaiian and Other Pacific Islander (Policylink 2017).
There were several questions asking the college student’s on-campus dining experience and 59.9% of the respondents ate 1-3 times a week on campus, and a majority of them (67.7%) were willing to spend $5.00 - $9.99 per meal on campus. The majority (75.4%) of the respondents lived off-campus.
The majority of the students chose to eat on campus due to convenience of location and convenience of time because most of them do not drive. According to theNational Center for Education Statistics (2018), “low-income residents are less likely to drive along to work” (p. 80). Furthermore, those who choose not to eat on campus brought their own food mainly because of expensive prices since the majority of them have an extremely low household income with 10% of Californians living in poverty (Bay Area Census 2010). Lastly, common responses on how campus dining can be improved were to lower the prices, improve food quality, and provide more menu options. These responses are reflective on not only their low-income status, but also the representation of their characteristics as millennials.
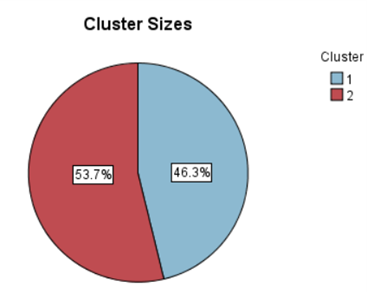
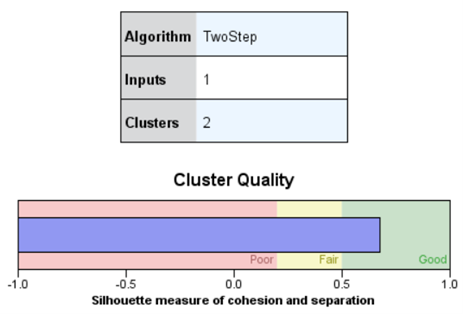
First, two-step cluster analysis was conducted to extract groups and memberships based on the mean values of DINESERV (MD = Mean value of DINESERV). MD was used to create groups because examining group differences between the highly satisfied and low satisfied group is one of the research purposes.Table 5 displays the results of the two-step cluster analysis and groups’ statistics. The two groups were extracted: low DINESERV satisfied group (MD = 3.88 out of 7.00), and highly DINESERV satisfied group (MD = 5.58 out of 7.00). “Ratio of sizes” value of cluster sizes was 1.16, which is a great indicator of cluster size and membership, meaning that if the cluster size is in balance, the membership of the two groups is similar in numbers (Figure 1). The two groups’ memberships are balanced, suitable to compare. “Cluster quality” value, which is a measure of cohesion and separation, was 0.7, falls in a good quality range (between 0.5 - 1.0). SeeFigure 2 for cluster quality. Therefore, the two clusters extracted based on MD are pertinent to use for this research to meet its purposes and test hypotheses.
| Clusters | N | Percent | Means |
| Cluster 1 – Low DINESERV Satisfied group | 99 | 46.3% | 3.88 |
| Cluster 2 – Highly DINESERV Satisfied group | 115 | 53.7% | 5.58 |
| TOTAL | 214 | 100% |
An independent-samples t-test was conducted to test if the two cluster were significantly different before conducting other data analysis. The test was not significant, as the result of the equal variances assumed displays (Sig. = .000, df = 212). Therefore, the two clusters extracted from the mean values of DINESERV are appropriate to examine college students’ on-campus dining experience and behavior in this study.Table 6 displays the results of independent-samples t-test of the two groups extracted from MD.
| Groups | N | Mean | SD* | T-value | Probability |
| Low DNIESERV satisfied | 99 | 4.20 | .77 | -13.923 | .000** |
| Highly DINESERV satisfied | 115 | 5.54 | .62 |
Note. * Standard Deviation; ** Significant at .05 level
Hypothesis 1.
As seen inTable 7, the mean of Tangible for the low DINESERV satisfied group was 4.20, and the mean of Tangible for the highly DINESERV satisfied group was 5.54. In comparing the two means, there is a significant difference in the mean of Tangible between low and highly DINESERV satisfied. Therefore, the highly DINESERV satisfied group values Tangible more than the low DINESERV satisfied respondents. The results support this hypothesis.
Note. * Standard Deviation; ** Significant at .05 level
Hypothesis 2.
As seen inTable 7, the mean of Reliability for the low DINESERV satisfied group was 3.94, and the mean of Reliability for the highly DINESERV satisfied group was 5.68. In comparing the two means, there is a significant difference in the mean of Reliability between low and highly DINESERV satisfied. Therefore, the highly DINESERV satisfied group values Reliability more than the low DINESERV satisfied respondents. The results support this hypothesis.
Hypothesis 3.
As seen inTable 7, the mean of Responsiveness for the low DINESERV satisfied group was 3.67, and the mean of Responsiveness for the highly DINESERV satisfied group was 5.62. In comparing the two means, there is a significant difference in the mean of Responsiveness between low and highly DINESERV satisfied. Therefore, the highly DINESERV satisfied group values Responsiveness more than the low DINESERV satisfied respondents. The results support this hypothesis.
Hypothesis 4.
As seen inTable 7, the mean of Assurance for the low DINESERV satisfied group was 3.97, and the mean of Assurance for the highly DINESERV satisfied group was 5.76. In comparing the two means, there is a significant difference in the mean of Assurance between low and highly DINESERV satisfied. Therefore, the highly DINESERV satisfied group values Assurance more than the low DINESERV satisfied respondents. The results support this hypothesis.
Hypothesis 5.
As seen inTable 7, the mean of Empathy for the low DINESERV satisfied group was 3.64, and the mean of Empathy for the highly DINESERV satisfied group was 5.30. In comparing the two means, there is a significant difference in the mean of Empathy between low and highly DINESERV satisfied. Therefore, the highly DINESERV satisfied group values Empathy more than the low DINESERV satisfied respondents. The results support this hypothesis.
Hypothesis 6.
Table 8 presents the correlation matrix of the mean values of the five factors of DINESERV and the mean value of DINESERV. All five aspects of DINESERV were significantly correlated to the overall mean values of DINESERV at the 0.01 level. All of the correlation coefficient values in the matrix had a positive value, meaning the five factors and DINESERV were positively correlated. The correlation coefficient values range from .687 to .941. Therefore, Hypothesis 6 is supported.
Note. ** Correlation is significant at the 0.01 level (2-tailed). M_DNSV = Mean_DINESERV, M_T= Mean_Tabgible, M_R = Mean Reliability, M_RS= Mena_Responsibility, M_A = Mean_Assurance, M_E = Mean_Empathy
5. Discussion and Conclusion
This study proves the validity and reliability of DINESERV; highly satisfied young generations have high satisfaction mean values for all of the five aspects of DINESERV. After DINESERV was developed in 1995, there was a more than 25-year gap between the original DINESERV research and the current research. People’s values change every day and the time differences might affect the results of the study when the same DINESERV measurement is used (McKeachie and Svinicki 2013). The findings of this research prove that DINESERV is still valid to use and reliable to measure the service quality of restaurants in the 21st century. This study also contributes to the literature by adding new information on the on-campus dining experience, satisfaction, and perception of the youngest generations in this nation, Generation Y and Z.
For both clusters, Assurance ranked number one factors which had the highest correlation coefficient value, while Tangible was ranked the last among the five DINESERV factors. Assurance in DINESERV is defined as “knowledge and courtesy of employees and their ability to convey trust and confidence.” Some of the questions asking about Assurance in this research were: “The on-campus dining facilities have employees who can answer your questions completely,” “…has personnel who are both able and willing to give you information about menu items, their ingredients, and methods of preparation,” “…has personnel who seem well-trained, competent, and experienced,” and “…seems to give employees support so that they can do their jobs well.” The reason why Assurance dimension is ranked first could be the student employees who work at the restaurants in on-campus dining facilities. Most of the employees are currently enrolled students. Having their friends and peers at on-campus dining facilities might make college students feel comfortable and safe as well as make for easy communication when they eat on campus as previous research studies found that Gen Y and Z value peer groups and the feeling of belonging (Manago and Vaughn 2015).
Tangibles is the last ranked factor among the five dimensions of DINESERV. The questions asking Tangibles are about the exterior of the building, interior of the on-campus dining facilities, staff’s clean and neat appearance, visually attractive designs of menu, and tables and seats and cleanliness of restroom and dining area. Young generations do value exclusive and unique visual contents and look for something hip (Kim and Bachman 2019). It is often overlooked to regularly improve on-campus dining facilities’ design and cleanliness. And most of the time, it is due to a budget issue. When designs of the menu, signs or interiors cannot be regularly updated, then a thorough cleanliness can solve the problem of Tangibles. Thorough cleanliness of the restrooms and dining area is a cheaper solution for the management of on-campus dining businesses, compared to costly remodeling of the on-campus dining facilities. Also, collaborating with several departments can be a great way to not only solve the tangible issue, but also improve the young generations’ experience of on-campus dining. For examples, the management of on-campus dining businesses can collaborate with the faculty and the students from the art department, which can help them to design menus, restaurant signs, brochures, marketing materials, and from the space design department, which can help them to design the space and location of tables, chairs, and any decorations. This is a great opportunity for the faculty and students to not only have experiential and service learning experiences, providing their skills and abilities for the community, but also beneficial for the young college students’ better experience of on-campus dining. Tangibles was still highly correlated with DINESERV (α = .839) even though it was ranked last. This means that on-campus dining management must continue to provide tangible aspects of on-campus dining that satisfy the young college students.
The other dimensions of DINESERV are also very important to the young college students as the high correlation coefficient values show. The management of on-campus dining must try to provide dependable and consistent service and great quality food on time and errors or mistakes must be corrected immediately (reliability), speedy, responsive, and with quality service (responsiveness), sympathetic and special care for their individual needs (empathy). Reliability and responsiveness of on-campus dining service quality can be improved by providing regular trainings for employees. Next, empathy can be resolved after employees are well trained and maintained. Once employees have information on how to serve their customers well and are familiar with the work, responsibilities and customers’ expectation which take time to be familiar, that is where special care and service for their customers can occur.
All of the t-test results comparing the two groups were significant, which means that our findings confirmed that highly satisfied young generations have high satisfaction mean values for all of the five aspects of DINESERV. This finding confirms the validity of DINESERV and also provides us the most important advice for on-campus dining management: highly satisfied customers are the key to success as they are more satisfied with all five dimensions of DINESERV, compared to the satisfaction level of the low satisfied group. As underlined, highly satisfied customers tend to come back to the business for reuse or repurchase and are more loyal to the business. However, all of the five dimensions’ mean values range between 4.53 to 4.89 out of 7.00, which is “somewhat satisfied.” Both Assurance and Tangible have the mean value of 4.89 out of 7.00, ranked number 1, while Empathy ranked the last, 4.53 out of 7.00. This is where on-campus dining management must pay attention. When young generations are somewhat satisfied, there are still needs and room to grow for the management of on-campus dining facilities. Management of on-campus dining service must consider the current status of all the five aspects of DINESERV, and try to provide better services or facilities to increase the satisfaction level of the young college students. Our findings from the on-campus dining behavior questions provide great solutions for this. As the results show, the young college students are looking for authentic and healthy food options, a variety food menu options, and high-quality food but less expensive menus. Most of the food options at on-campus dining facilities at universities in the U.S.A. are hamburgers, sandwiches, Chinese fast food, tacos, and pizza. Gen Y and Z want more ethnically authentic food and they do not hesitate to try new food. They are already familiar with all the ethnically authentic food and want to see it at on-campus dining facilities. Also, the findings of this research show that young college students are looking for inexpensive menu options at on-campus dining restaurants. Trying to offer an affordable price menu is another key to success. As the average income per capita is around $38,000 annually in California, looking for inexpensive menu options is understandable. However, previous research showed that young generations are willing to pay for the food if they find value in it (Kim and Bachman 2019). If young college students find value from the food and service provided by the on-campus dining facilities, they will be willing to pay a lot and eat at on-campus dining facilities. The fact young college students mentioned the high price as a reason why they do not eat on campus in this research might be a result from a poor food quality and service of the current on-campus dining facilities. As millennials makes up 85% of California's population (Bay Area Census 2010) and more Gen Z is coming to use on-campus dining facilities and services, it is essential for management of on-campus dining facilities to consider what the young generations look for and want. It will benefit their revenue and long-term success in the market, but more importantly, it is directly connected to the mental and physical health of young college students, who are our community members and future leaders.
Therefore, management of on-campus dining service must devise an actionable plan in relation to the five DINESERV dimensions by offering training opportunities for its staff to provide reliable and dependable services. This may include training the staff in being knowledgeable on the food that they serve as well as providing prompt service when a customer needs assistance. Moreover, renovating the facility’s appearance by investing in having the right equipment such as dining ware and updating the personnel’s appearance are essential to diner’s overall experience. As a result, satisfaction rate will increase and student diners will most likely dine on-campus rather than off campus. Furthermore, training opportunities should also be considered its chefs to learn how to make high quality food that are authentic, healthy, and inexpensive. Lastly, management of on-campus dining service can invite food trucks onto campus as an alternative for the students to try new foods. AsFitzpatrick (2019) pointed out, food truck has become a vital food option for many especially millennial college students. There are thousands of hungry college students on campus everyday who are eager to try the latest food trends and many of these food trucks offer authentic and healthy foods that are affordable for students to try. These actionable suggestions will not only address the five DINESERV dimensions but also provide an opportunity for the campus to try new things when it comes to on-campus dining experience.
Limitations and future studies
As the previous researchers already argued, the original DINESERV has some limitations - DINESERV does not cover all the aspects of restaurants’ service of different and various types of restaurants. DINESERV might not be the best tool to measure on-campus dining facilities. The original DINESERV can be revised based on the characteristics of on-campus dining to appropriately measure the service quality of on-campus dining facilities. Additionally, the current research has collected data only at the major universities located in California in the U.S.A. Generalizing the findings of this research might not be proper. Therefore, future studies can be expanded and collect data from other states in U.S.A.
These days, on-campus dining service and facilities are rapidly changing by adopting technologies to the food processing, service, and delivery systems. For example, several on-campus ordering and delivery applications are widely used at many universities in the states. And, kiosks, a small stand-alone device providing information and services on a computer screen, have been introduced and are widely used at many universities in the states for order and payment systems. To better understand the young college students’ satisfaction and behavior on on-campus dining in the United States, future studies are suggested to add new dimensions (factors) adopting the new trends of on-campus dining in the original DINESERV measurement tool.