
Introduction
Goat milk production has increased in Turkey and worldwide as well. It has become more popular thanks to its functional properties such as lower allergenic properties and higher digestibility compared to cow milk. Also, goat milk contains less trans C18:1 fatty acid than cow milk, which provides an advantage in terms of the risk of heart diseases (Haenlein, 2004). Therefore, goat milk products like yoghurt, ice cream, and cheese have been highly demanded by consumers.
Benzoic acid and its salts such as sodium benzoate and potassium benzoate are preservatives that are commonly used in the food industry. Benzoic acid has strong antimicrobial effects on microorganisms like E. coli, L. monocytogenes, Aspergillus spp., and Penicillium spp. Although benzoic acid is used as a preservative additive, it can also occur naturally in vegetables and animal-origin foods. In terms of milk and dairy products, minor components of milk also include organic acids which can be obtained from the hydrolysis of milk fat and proteins. Also, the natural organic acid content of milk changes depending on a variety of factors such as animal breeding diet and the duration of the lactation period. The formation of benzoic acid in dairy products is based on 3 mechanisms (Sieber et al., 1995). During the fermentation or ripening period of fermented dairy products, benzoic acid can be produced from hippuric acid, a milk component naturally present at concentrations of up to 30-50 mg/kg. Also, it has been reported that especially different cheese types and concentrated yogurt/skimmed yogurt contain higher benzoic acid concentrations during ripening and cold storage period (Sieber et al. 1995). Benzoic acid values mainly depend on the level of hippuric acid in raw milk as well as the dairy production process, especially the microorganisms used in the production. Lactococcus lactis, Lactobacillus spp, Streptococcus thermophilus, Escherichia coli, and Pseudomonas fluorescens can synthesize benzoic acid in milk (Hejtmankova et al., 2000; Tavaria et al. 2002).
Another metabolic pathway has been reported to be responsible for additional quantity of benzoic acid originating from phenylalanine degradation (Leuthardt, 1977), with 3-phenyl propionic acid and cinnamic acid as intermediate products. Acetophone is a by-product of this breakdown which essentially occurs in washed-rind and smear-ripened cheese (Sieber, et al. 1995). The presence of intermediate products, their concentrations, the benzoic acid levels, and its formation during the production/ripening of cheese and cheese-like products and the simultaneous production of ammonia resulting from deamination support the validity of this second metabolic pathway. The last way of formation of benzoic acid is the autoxidation of benzaldehyde, produced by certain strains of lactic acid bacteria. In addition to the transformation of hippuric acid, these two sources (phenylalanine degradation, autoxidation of benzaldehyde) form benzoic acid in dairy products. Benzoic acid levels in raw milk are very low, however fermented milk products like yogurt, kefir and cheese could contain approximately 20-50 mg/kg of benzoic acid (Sieber et al. 1995). Therefore, the aim of this study was to investigate how the use of different starter cultures in goat milk kefir production affects naturally occurring benzoic acid levels. Thereby, nine different starter cultures and one kefir grain culture were used in goat milk kefir production. This study aimed to determine the hippuric acid and benzoic acid levels in raw goat milk and the content of benzoic acid in kefir prepared using different commercial starter cultures and kefir grains during 28-day-storage.
Materials and method
Materials
UHT goat milk was provided from Mar Consumer Goods Export Import Industry and Trade Inc. (Balıkesir, Turkey) Nine commercial kefir starter cultures were provided from various dairy product distributors while the kefir grains were provided from Ege University Faculty of Agriculture Pilot Dairy Plant. The contents and producers of different kefir starter cultures are shown in Table 1.
Table 1. Microorganisms of kefir starter cultures used for production of goat milk kefir
Chemicals and standards
Benzoic acid standard (1µg/mL) was purchased from AlfaAesar. The standards were diluted in purified water. All the water used was purified by the Millipore Milli-Q a10 system. HPLC-grade acetonitrile was purchased from Carlo Erba. Other reagents were also HPLC-grade and were obtained from Panreac, Sigma-Aldrich.
Method
Kefir production
In this study, the industrial kefir production method was adopted. UHT goat milk (at room temperature) was cultured with nine different starter cultures (according to the instructions of the manufacturers) and kefir grains (3 % w/v) and incubated at 25 °C until pH values of kefir samples reached 4.6. Following the incubation period (approximately 16-18 hours), kefir samples were bottled and stored at 4 °C. The composition of starter cultures used in kefir production is given in Table 1.
Physicochemical analyses
In kefir samples, pH values were determined using a digital pH-meter (Polychroniadou et al., 1999). Titratable acidity values were determined by the alkali titratable method (AOAC, 1990). The total dry matter and ash compositions were determined by the gravimetric method (AOAC, 2005). Fat levels were determined by the Gerber method. The total nitrogen and protein values were determined by the Kjeldahl method according to AOAC (2003).
Hippuric and benzoic acid analysis
Sample preparation
Approximately 100-g of each sample was homogenized with 25 mL purified water and the dilution was stirred. The homogenized sample was kept for 10 minutes in an ultrasonic bath and then in a water bath at 25 °C. Then 5 mL of Carrez I and 5 mL Carrez II were added into the tube and stirred in a rotator for 1 minute. The solution was diluted to 100 mL with purified water. After the solution was agitated manually for 1 minute, all the solution and samples were filtered through a 0.45-µm filter (ISOLAB PTFE) before being injected into the liquid chromatography.
Determination of benzoic acid by HPLC
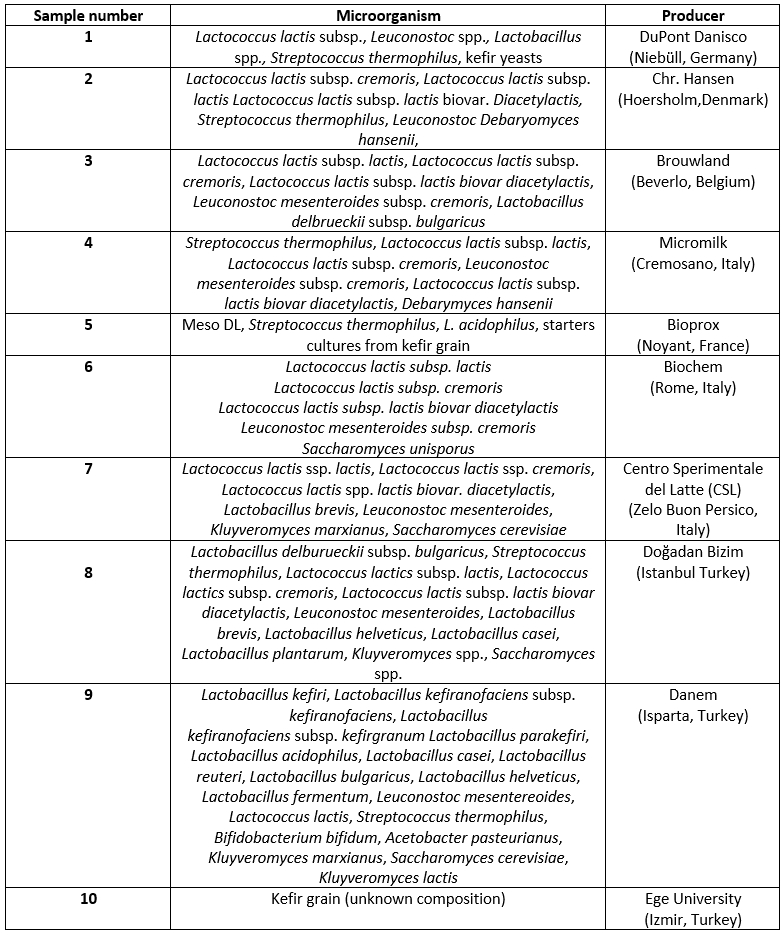
The determination of hippuric acid and benzoic acid in kefir samples were analysed according to Prodolliet and Bruelhart (1993). HPLC analysis was carried out using an Agilent 1100 series HPLC system equipped with a DAD detector and C18 analytical column (μ Bondapak, 10 μm, 3.9 x 300 mm.) The mobile phase contained a KH 2PO 4 buffer (pH: 4.0) and acetonitrile (v/v) with a flow rate of 2 mL/min. The peak of benzoic acid was measured at 230 nm wavelength (Figure 1). The injection volume was 20 µL. The analysis was conducted in three repetitions.
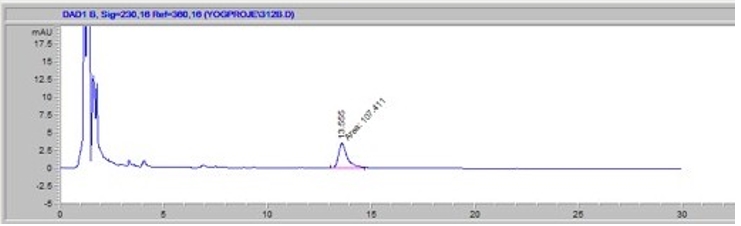
Figure 1. View of benzoic acid chromatogram at 230 nm wavelength
Recovery and optimization
The chromatographic system was calibrated for the quantification of hippuric and benzoic acid by the external standard method. Standard solutions ranging in concentration from 5-50 mg/L of hippuric acid, 5-45 mg/L of benzoic acid and peak areas corresponding to the standard levels were determined and averaged for duplicate injections. The validity of the analytical procedure was assessed by spiking samples with hippuric and benzoic acid. The analyses were carried out in duplicate before and after additions of 5-50 mg and 5-45 mg of either hippuric and benzoic acid into 20 g samples.
Microbiological analyses
Lactic acid bacteria (LAB) and total yeast and mold counts of the kefir samples were determined on days 1, 7, 14, 21 and 28 of storage. Accordingly, 1 mL of kefir sample was diluted with 9 mL 0.1 % peptone water. Then, serial dilutions were prepared in peptone water. Lactobacillus, Lactococcus, and total yeast and mold inoculations were respectively carried out using MRS, M17 and YGC agar. Incubations were carried out in an anaerobic jar at 37 °C for 72 hours, aerobic jar at 37 °C for 48 hours (Terzaghi and Sandine, 1975) and 25 °C for 72-120 hours (Irrigoyen et al., 2005), respectively. In microbiologic analyses, the pour plate technique was adopted.
Data analysis
The research was conducted in two repetitions and all analyses were performed in three parallels. For the statistical evaluation of analysis results, One-Way ANOVA was performed using SPSS version 22.0 (SPSS Inc. Chicago, Illinois). The Duncan was used to determine the groups in statistically significant differences (p<0.05).
Results and discussions
Physicochemical properties
The total dry matter, fat, total protein and ash values were determined on the first day of storage. Dry matter, fat, total protein and ash values of kefir samples ranged from 10.6-13.5 %, 32-3.7 %, 3.1-4.4 %, and 0.84-0.92 %, respectively. Different starter cultures used in the production of kefir samples had an effect on the composition of samples (p<0.05). The fat content of sample 10 produced using kefir grains differed from the samples produced using kefir starter cultures (p<0.05). Total protein and ash contents of kefir samples were statistically different between the sample groups on the same storage day (p<0.05). The differences in protein contents of kefir samples can be associated with the proteolytic properties of different starter kefir cultures used in production.
Table 2. Titratable acidity values (lactic acid%) of kefir samples
Data are expressed as means ± SD. Means followed by different small letters in the row are significantly different (p<0.05). Means followed by different capital letters in the columns are significantly different (p<0.05).
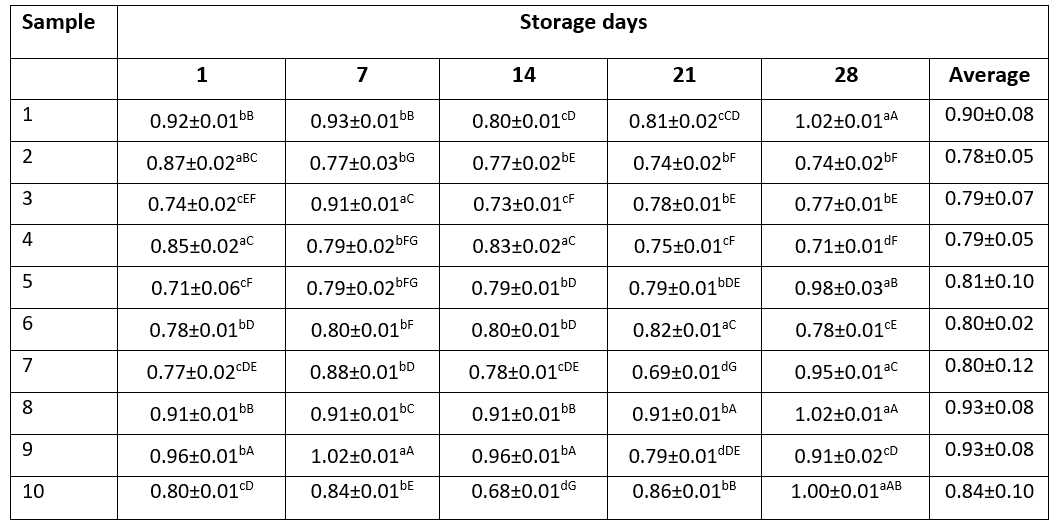
Table 3. pH values of kefir samples during the storage period
Data are expressed as means ± SD. Means followed by different small letters in the row are significantly different (p<0.05). Means followed by different capital letters in the columns are significantly different (p<0.05)
Titratable acidity and pH
Titratable acidity values of kefir samples showed an increase during the storage period (Table 2). The lowest acidity value (0.71 %) was observed in sample 1 whereas the highest acidity value (0.96 %) was observed in sample 5 and sample 9. Titratable acidity values showed statistically significant differences during the storage period (p<0.05). These differences were associated with starter cultures and kefir grain used in kefir production and lactic acid production ability of starter cultures and kefir grain. The increase in the lactic acid contents as a result of lactic acid bacteria activity can promote the production of benzoic acid. During the 28-day storage period, the highest titratable acidity values were determined in sample 8 (0.93±0.08), sample 9 (0.93±0.08) and sample 1 (0.90±0.08). Similarly, benzoic acid levels of these samples were the highest among the kefir samples.
It was seen that the ph values of the samples (Table 3) changed statistically significantly during the storage period (p<0.05). The reason for this is the use of different cultures in kefir production. When the average pH values were evaluated during the storage period, the sample number 10 produced with kefir grain had the lowest pH value.
Examining the changes in live microorganism counts during fermentation in kefir production according to benzoic acid levels, changes in pH or titratable acidity, no direct correlations were found between the relative decreasing tendency recorded in pH during fermentation that can be regarded to be rapid up to the isoelectric point and the pH during storage and the benzoic acid levels. The level of benzoic acid formed varies depending on the fermentation kinetics and species in monocultures, the species forming the culture in mixed cultures, the relationship between the species and the ambient conditions. It is known that lactic acid bacteria can transform the hippuric acid naturally found in milk into benzoic acid. Also, benzoic acid can occur by benzaldehyde oxidation and anaerobic/aerobic metabolism of phenolic compounds. In light of these data, it can be argued that, rather than pH, the species and strains of lactic acid bacteria that are active in dairy products even at low high acidity have an effect on the benzoic acid level levels formed naturally in dairy products (Ping et al., 2009; Han et al., 2016; Tavaria et al., 2002).
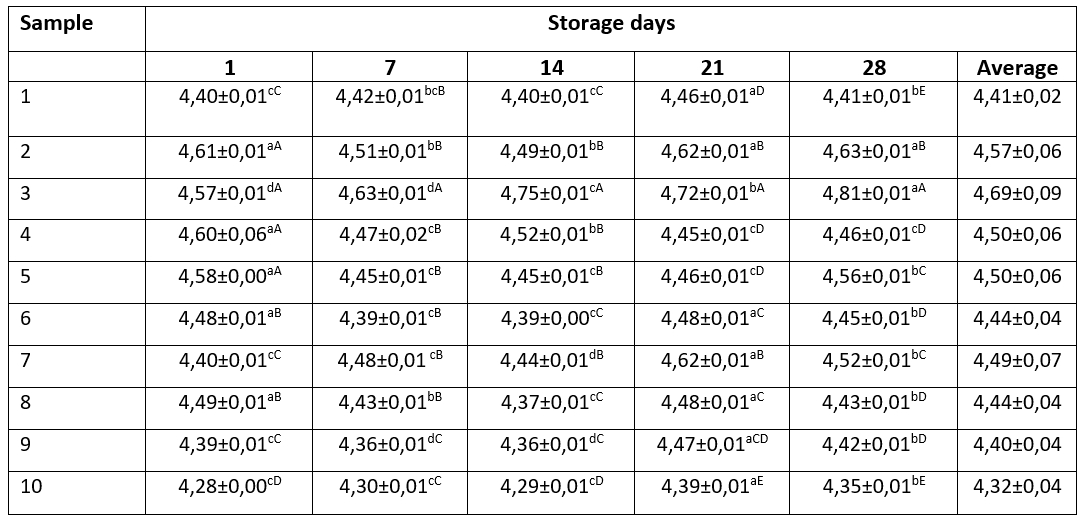
Table 4. Benzoic acid contents (mg/kg) of kefir samples during the storage period
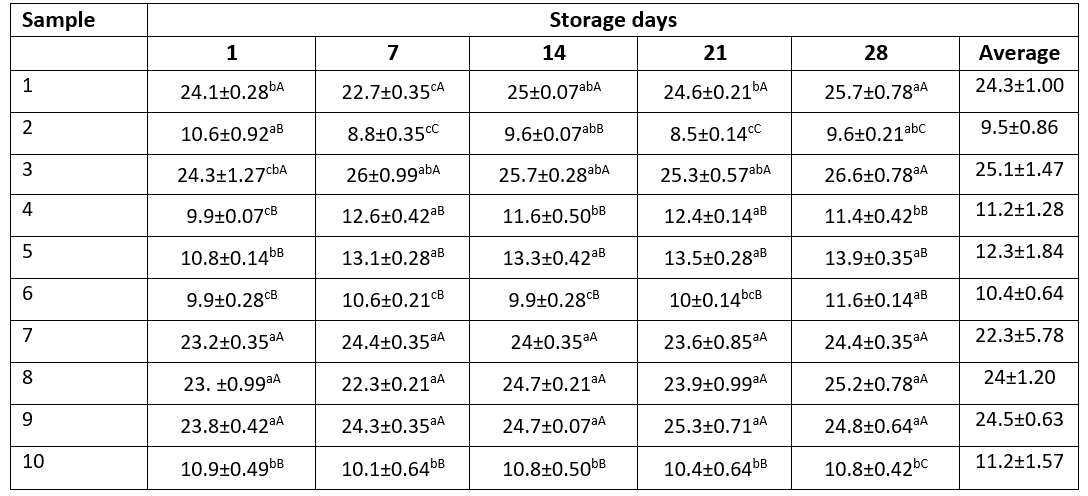
Data are expressed as means ± SD. Means followed by different small letters in the row are significantly different (p<0.05). Means followed by different capital letters in the columns are significantly different (p<0.05)
Benzoic acid and hippuric acid values
Benzoic acid levels of kefir samples are shown in Table 4. In this study, hippuric acid was not found in kefir samples during the storage period while goat milk samples were found to contain hippuric acid (14.8 mg/kg). Therefore, it can be argued that, in milk fermentation and storage of kefir samples, hippuric acid was naturally converted to benzoic acid. In different storage periods, except for samples 7 and 9, benzoic acid levels of other kefir samples showed statistically significant differences (p<0.05). Benzoic acid levels of kefir samples ranged from 8.5 to 26.6 mg/kg during the 28-day storage period. Benzoic acid levels of samples 2, 4, 5, 6 and 10 were approximately half the benzoic acid levels in other samples. Benzoic acid levels of kefir samples fluctuated approximately at 1-2 mg/kg between days 1 and 28 of storages. During the storage period, benzoic acid levels of samples 7, 8, 9, 10 did not show statistically significant changes (p>0.05). Particularly, benzoic acid levels of sample 10 produced using kefir grains hardly ever changed during the storage period. Hejtmankova et al. (2000) have reported that the mean benzoic acid levels of goat milk yogurt were 34.2 mg/kg.
Urbiene and Leskauskaite (2006) used different lactic acid bacteria in milk fermentation in their research. The researchers have stated that benzoic acid levels of fermented milk samples ranged from 14 to 23 mg/kg and benzoic acid levels were higher compared to the benzoic acid contents of raw milk. The researchers also determined that the content of benzoic acid during the storage period decreased in all samples. During the first three days of the storage, the decrease in benzoic acid was not significant whereas, during the following three days, benzoic acid content decreased significantly (p<0.05).
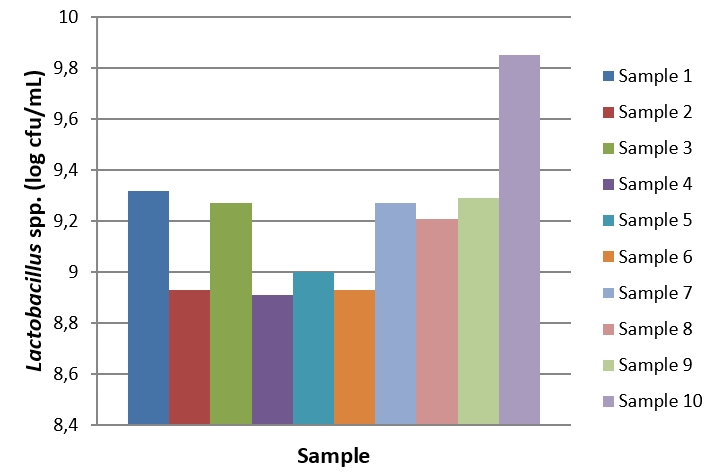
Figure 2. Lactobacillus spp. count of kefir samples during the storage period
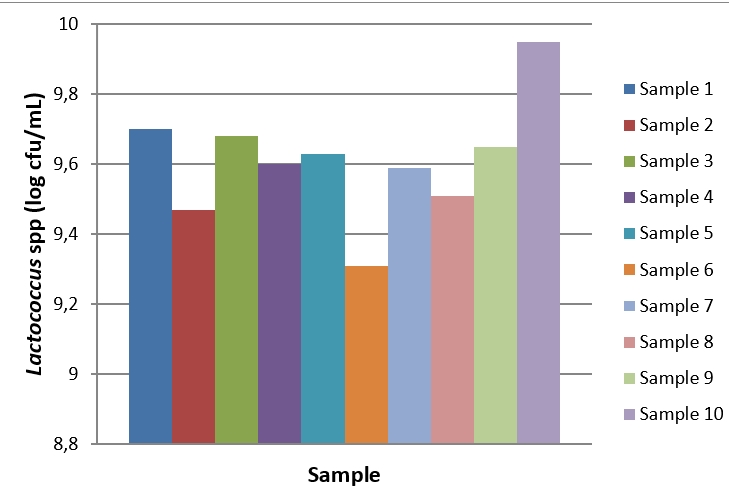
Figure 3. Lactococcus spp. count of kefir samples during the storage period
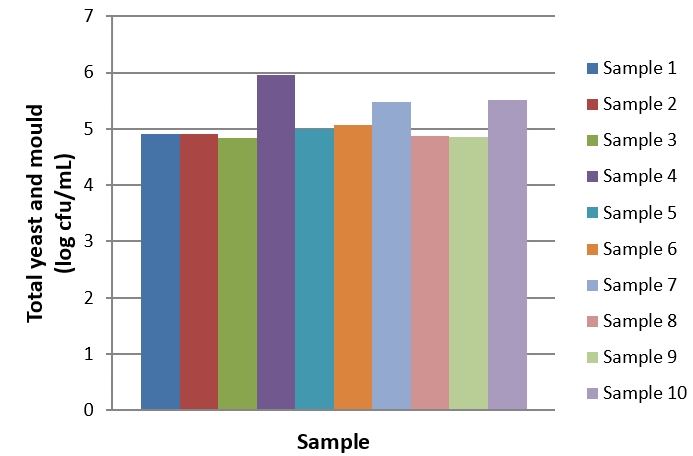
Figure 4. Total yeast and mould count of kefir samples during the storage period
Microbiological properties
During the 28-day storage period of kefir samples, Lactobacillus counts ranged from 5.85 to 10.14 log cfu/mL (Figure 2). The highest Lactobacillus count was determined in sample 10 produced using kefir grain at the baseline (day 1) and the end of the storage (day 28). Since the first day of storage, a general decrease was observed in the Lactobacillus count of kefir samples. The changes in Lactobacillus counts in kefir samples were significant during the storage period (p<0.05). During the 28-day storage period, Lactococcus counts ranged from 8.03 to 10.31 log cfu/mL (Figure 3). At the end of the storage, the highest Lactococcus count was determined in sample 10. The changes in Lactococcus counts were significant during the storage period (p<0.05). The highest and the lowest total yeast and mould counts were determined in sample 4 (6.09 log cfu/mL) on day 28 of storage and in sample 5 (4.64 log kob/mL) on day 1 of storage (Figure 4). The changes in total yeast and mould counts were significant during the storage period ( p<0.05). In this study, we determined that using different starter cultures had a significant effect on benzoic acid levels (p<0.05). Evaluating the research results, it is hard to correlate with benzoic acid levels and microorganism counts of kefir samples due to the complex microflora of kefir cultures. For example, during the storage period from day 1 to 28, the highest Lactobacillus and Lactococcus counts were observed in sample 10 whereas sample 10 was one of the samples containing the lowest (11.2 mg/kg) benzoic acid levels. Similarly, the highest yeast and mould counts were in samples 4 and 10 whereas these samples contained low levels of benzoic acid. Hornickova et al. (2014) evaluated benzoic acid levels of fermented goat milk drinks produced using different starter cultures. The researchers have stated that benzoic acid levels of these products ranged from 17.36 to 24.79 mg/kg. Unlike the results of the present study, the researchers have reported that using different starter cultures had no significant effects on benzoic acid levels of fermented drinks (p>0.05).
Mroueh et al. (2008) observed that benzoic acid content of yogurt samples using commercial starters MYE 95, MY900, CH1 and Lyofest 480F were 4.7, not detected, 14.7 and 8.5 µg/kg, respectively. The researchers have stated that the benzoic acid content differed depending on the type of starter culture and fermentation conditions and storage time, as was the case in the present study (Garmirene et al., 2010; Han et al., 2016). On the other hand, the level of benzoic acid in yogurts manufactured varied from 5.2 to 10.5 µg/kg in yogurts made from goat's milk and from 27.8 to 106.2 µg/kg in yogurt made from sheep milk. In the study by Mroueh et al. (2008), the correlation dependence between hippuric and benzoic acid in yogurts produced from goat’s milk was very similar to those obtained in the present study. In another study, benzoic acid levels in yogurts from cow's and goat's milk using different yogurt cultures were found to be 13.1-24.1 mg/kg and 24.2 mg/kg respectively (Hejtmenkova et al., 2000).
Some researchers found that Lactobacillus spp. produced higher levels of benzoic acid compared to those produced by Lactococcus/Streptococcus. Garmiene et al. (2010) found that the level of benzoic acids in yogurt samples sold in Italian markets was 15-20 µg/kg and there was no linear relation between the Lactobacillus spp. counts and benzoic acid levels. During fermentation, lactic acid bacteria reached counts of 9.19 log cfu/mL, and the highest benzoic acid content was 2.38 mg/kg (Park et al., 2017). Salomskiene et al. (2019) researched antimicrobial compounds produced by lactic acid bacteria and found that L. helveticus was the best producer of benzoic acid compared to other bacteria. Yu et al. (2016), evaluated benzoic acid production ability of S. thermophilus, L. acidophilus, L. delbrueckii subsp. bulgaricus L. rhamnosus, L. casei, L. paracasei, L. reuteri, L. plantarum, B. longum, B. lactis, B. bifidum, B. infantis, and B. breve in yoghurt. They found that L. rhamnosus and L. paracasei had the highest benzoic acid production ability.
According to the data obtained, LAB strains produced different levels of benzoic acid. And the common tendency was a slight increase in benzoic acid at the early stages of storage and then a decrease at the end. It can be argued that benzoic acid decreased with the LAB reaching the death phase after a stationary phase during lactic acid’s metabolic process, as also stated by Yıldız et al. (2012). Also, benzoic acid was naturally produced and the level of benzoic acid can change depending on the incubation time, temperature, and the type of starters (Han et al., 2016) and inoculation ratio.
Conclusion
In this study, we aimed to determine the effects of different starter cultures and kefir grain on hippuric acid and benzoic acid levels in goat milk kefir samples. The effect of using different starter cultures and kefir grain in goat milk kefir production on benzoic acid levels was statistically significant (p<0.05). In goat milk kefir samples, benzoic acid levels ranged from 8.5 to 26.6 mg/kg during the 28-day storage period. Hippuric acid determined in goat milk was not detected in kefir samples. Lactic acid bacteria and yeasts converted hippuric acid to benzoic acid and, thus, kefir samples did not contain hippuric acid. Also, the increase in lactic acid content as a result of lactic acid bacteria activity promoted the production of benzoic acid. It was also determined that kefir samples containing high lactic acid had high levels of benzoic acid. In this study, the results showed that it was hard to correlate with benzoic acid levels and microorganism counts of kefir samples due to the complex microflora of kefir cultures. For this correlation, kefir samples must be produced using mono-cultures and so it will be easier to correlate the microorganisms with a benzoic acid level of product.
Promjene u sadržaju benzojeve kiseline u kefiru od kozjeg mlijeka proizvedenom pomoću različitih kefirnih kultura
Sažetak
U ovom radu je ispitivan sadržaj hipurinske i benzojeve kiseline u uzorcima kefira od kojeg mlijeka proizvedenim pomoću različitih komercijalnih lifoliziranih starter kultura te kefirnih zrnaca. Devet komercijalnih starter kultura i jedna vrsta kefirnog zrna su pri tom korišteni za proizvodnji uzoraka kefira. Dobiveni rezultati su pokazali kako hipurinska kiselina nije bila prisutna niti u jednom ispitivanom uzorku tijekom cijelog perioda skladištenja, dok su ju uzorci ishodišnog mlijeka sadržavali (14,8 mg/kg). Sadržaj benzojeve kiseline u uzrocima kefira kretao se od 8,5 to 26,6 mg/kg tijekom 28 dana čuvanja. Najveći broj živih stanica vrsta Lactobacillus i Lactococcus utvrđen je u uzorku kefira proizvedenog pomoću kefirnog zrna, dok je isti taj uzorak sadržavao najniže koncentracije benzojeve kiseline (11,2 mg/kg). Iz svega navedenog može se zaključiti da su kefirne starter kulture i mikrobiota korištena za proizvodnju kefira te duljina čuvanja imali značajan utjecaj (p<0.05) na formiranje I koncentraciju benzojeve kiseline.
Ključne riječi: kozje mlijeko; kefir; hipurinska kiselina; benzojeva kiselina; kefirna kultura