
Introduction
Water buffalo (Bubalus bubalis) is a multipurpose animal that was domesticated approximately 7000 years ago in China. One of the subspecies of water buffalo is the river buffalo, which accounts for nearly 70 % of the global population of water buffaloes. A major proportion of buffalo milk produced in India and Pakistan is obtained from river buffaloes. These two nations produce over 90 % of the total world production of buffalo milk, which accounts for an amount of 126.731 million tonnes per year (El Debaky et al., 2019; FAOSTAT, 2019; Yang et al., 2008).
Buffalo milk has a higher nutritional value and a greater number of major constituents compared to cow milk. In general, buffalo milk contains approximately 6.6-6.8 % of fat, 3.4-4.5 % of protein, 0.71-0.90 % of ash, and 4.5-5.2 % of lactose. The calcium, magnesium and phosphorus contents are also approximately 1.5 times higher in buffalo milk compared to cow milk, while the cholesterol levels are slightly lower in the former (212-275 mg/100 g in buffalo milk versus 280-330 mg/100 g in cow milk). The protein efficiency ratio reported for buffalo milk proteins is 2.74, which is higher than that reported for cow milk (2.49). The microbiological load of buffalo milk is also lower than that of cow milk as the former has a higher content of lactoferrin as a minor protein (Arora et al., 2002; Murtaza et al., 2017a; Maneesh and Amandeep, 2015).
The higher content of the total dry matter of buffalo milk also renders it suitable as a raw material for the production of a wide range of dairy products with superior sensory characteristics in high yields. Buffalo milk also exhibits rapid coagulation and acceptable levels of renneting and churning owing to the structure of casein micelles, higher calcium content, and the larger fat globule size (Dimitreli et al., 2017; Murtaza et al., 2017b). Therefore, buffalo milk is used widely in the production of cheese and butter in several nations. Among the various buffalo milk products, the most famous buffalo milk cheese is the Mozzarella di Bufala Campana, which originates from southern Italy. This cheese has a rich, sweet, and lactic flavour with a unique fibrous texture. Ghee is another well-known buffalo milk product. Ghee is clarified butter with therapeutic properties and has been produced and consumed extensively in the Indian subcontinent since ancient times (Bhavaniramya et al., 2018; Pizzolongo et al., 2007).
As the production rate of buffalo milk increased worldwide due to its technological and nutritional properties, several studies were conducted on the use of buffalo milk in the production of various cow milk-derived cheeses, such as Cheddar and Emmental (Murtaza et al., 2017b; Murtaza et al., 2013, Ladkani and Srinivasan, 1990a, 1990b). For instance, Rekowsky et al. (2020) investigated the use of buffalo milk in the production of Minas Frescal cheese, which is a Brazilian soft white cheese prepared from cow milk through the enzymatic coagulation of milk using rennet, with or without starter cultures. Studies have reported that the fat content and total solids in the cheese prepared from buffalo milk were slightly higher than those in bovine milk. However, the cheese yield of bovine Minas Frescal cheese is reportedly higher than that of buffalo milk and that of the cheese derived from a mix of buffalo milk and bovine milk. This finding was attributed to the relatively higher percentage of water in bovine milk cheese (Rekowsky et al., 2020). Moreover, the textural sensory scores of bovine Minas Frescal cheese were reported to be lower than those of the buffalo milk cheese, while the cheese prepared from the mix of buffalo milk and bovine milk had higher sensory scores compared to the cow milk cheese in terms of aroma and overall acceptance (Rekowsky et al., 2020). In addition, higher sensory scores, including those for smooth and nutty aromas, sour and salty tastes, creamy flavour, firmness, crumbliness, and mouth counting, were reported for Cheddar cheese prepared from buffalo milk using indigenous starter cultures compared to the cheese produced from cow milk (Murtaza et al., 2013).
The term ‘probiotics’ collectively refers to a single strain or a mixture of different living microbial strains that exert several well-recognized health benefits, such as anticancer, antigenotoxic, antihypertensive, antioxidative, prophylactic, anti-osteoporotic, and antidiabetic potential, when received in adequate amounts by the gastrointestinal tract of the host. Lactobacilli, Bifidobacteria, and other lactic acid-producing bacteria isolated from fermented dairy products, and the infant fecal microbiome, have been commonly used as probiotics (Cunningham et al., 2021; Gao et al., 2021). Owing to the inherent low acidic nature, high buffering capacity, nutrient-density, and low-oxygen content of cheese, it is considered a suitable carrier matrix for probiotics during storage and in the gastrointestinal tract stages compared to other dairy products. The incorporation of probiotic cultures into cheese adds value to the cheese product and also enhances its sensorial and nutritional quality (Gao et al., 2021; Abensinghe et al., 2020; Sameer et al., 2020). Therefore, some researchers have studied the effect of the inclusion of probiotics into fresh cheeses prepared from buffalo milk, such as Ricotta, Dahi, and Minas Frescal (Sameer et al., 2020; Verruck et al., 2015a; Marcatti et al., 2009). In addition, probiotic Quark-like cheeses prepared from cow milk have been studied (Vitola et al., 2020; Soltanzadeh et al., 2019; Pereira et al., 2010).
The present study was aimed to evaluate the potential use of buffalo milk in the production of Quark-like cheese incorporated with probiotic cultures of Lactobacillus acidophilus and Lacticaseibacillus rhamnosus. The Quark-like probiotic cheese samples prepared from a mixture of buffalo milk and cow milk were characterized in terms of their compositional, physicochemical, textural, aromatic, and sensory attributes.
Materials and methods
Materials
The cow milk and buffalo milk used in the present study were purchased from a local producer in Usak and Afyonkarahisar, Turkey. Freeze-dried probiotic starter cultures of Lactobacillus acidophilus (nu-trish ® LA-5 ®) and Lacticaseibacillus rhamnosus (LGG ® Grade G) were obtained from Chr-Hansen (İstanbul, Turkey). Lyofast Sacco Y080 F (Sacco Srl, Italy) obtained from local dairy plants was utilized as a starter culture. All chemicals used were of analytical/chromatographic grade and purchased from Merck (Darmstadt, Germany) and Sigma-Aldrich (St. Louis, MO, USA).
Cheese production
The protocol for Quark-like fresh cheese production is illustrated in Figure 1. The cheese samples were prepared according to the standard procedure of Quark cheese production. Five different cheese formulations were produced from different ratios of cow milk and buffalo milk: buffalo milk cheese (BM, 100 % buffalo milk), mixture cheese 1 (BCM1, 75 % buffalo milk:25% cow milk), mixture cheese 2 (BCM2, 50 % buffalo milk:50% cow milk), mixture cheese 3 (BCM3, 25% buffalo milk:75% cow milk), and cow milk cheese (CM, 100 % cow milk). The produced cheese samples were placed in plastic cups (Polypropylene), covered with lids, and stored at 4 °C for 21 days. Each sample was produced in a duplicate.
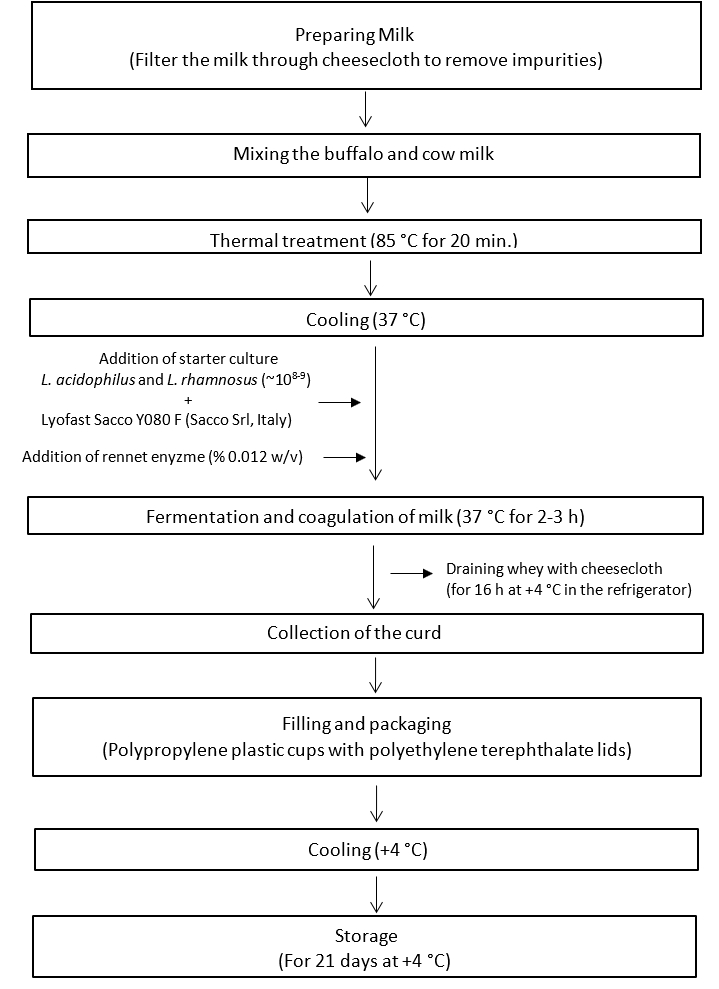
Figure 1. Schematic illustrating the steps for the production of Quark-like probiotic cheese
Titratable acidity (lactic acid %) and proximate composition
Titratable acidity (lactic acid %) and the contents of dry matter (%), fat (%), total protein (%), salt (%), and ash (%) in the cheese samples were determined using the respective methods described by Bradley et al. (1992). For this purpose, titratable acidity (lactic acid %) was determined by titrating of cheese solution with 0.1 N NaOH in presence of phenolphthalein indicator. Dry matter (%) of the cheese samples was determined by the oven-drying method at 102 °C. The ash (%) content was determined by ashing of the cheese samples in a muffle furnace at 550 °C. the fat (%) content of the cheese samples was determined by the Gerber-Van Gulik method using the Van Gulik butyrometer. Total protein (%) of the cheese samples were determined by the micro-Kjeldahl method. The Mohr's method was used for the determination of the content salt (%) in the cheese samples.
Colour analysis
colour parameters (L*-Lightness, a*-redness, and b*-yellowness) of the cheese samples were determined using a Minolta CR-400 colorimeter (Minolta, Osaka, Japan). Standard illuminate C and a standard observer angle (2°) were used as measurement conditions. Colour measurement was conducted using the method of ISO- CIE (2008). Hue and Chroma values were calculated from a* and b* values using equations 1 and 2 provided below. Hue describes the colour tone of the produced cheese, while Chroma indicates the degree of saturation of the cheese colour (Wrolstad and Smith, 2017).

Texture analysis
A compression test was conducted to determine the hardness and total work done properties of the cheese samples at 20 °C. The total work done property is associated with the consistency of the cheese samples. Brookfield CT3 Texture Analyzer (Brookfield, USA) was employed for texture measurements. The analysis condition was established by the authors based on the results of pre-experiments and Brookfield Labs, Food and Beverage Application Notes (Anonymous, 2019). The cheese sample was positioned in a glass cylinder load cell with a diameter of 4.5 cm. The analysis conditions were as follows: trigger load - 5 g; test and return speed - 1.5 mm/s and 1.5 mm/s, respectively; target type distance - 10 mm; probe - TA11/1000 (cylindrical probe, 25.4 mm D, 35 mm L). TexturePro CT V1.8 Build 31 Software ((Brookfield Labs, USA) was used for data processing. All texture measurements were conducted in a duplicate.
Water-soluble nitrogen content (WSN %)
Water-soluble nitrogen (WSN) content in the cheese samples was determined based on the method described by Kuchroo and Fox (1982). In brief, 10 g of cheese sample was mixed with 40 mL of distilled water. The mixture was blended using an electric hand-held homogenizer for 3 min and was maintained at 40 °C for 1 h in a waterbath. Afterward, the mixture was centrifuged at 3,000 × g for 30 min at 4 °C. The upper fat layer was removed from the mixture. The supernatant filtered through Whatman 42 filter paper. Ten millilitres of filtrate was taken and the nitrogen content was determined by the micro-Kjeldahl method. The WSN content was expressed as the percentage (%) of total nitrogen content.
Analysis of volatile compounds
The volatile compounds in the cheese samples were extracted using the solid-phase microextraction (SPME) method (Pawliszyn, 1999). Volatile compound profiles of the cheese samples were determined using a gas chromatography-mass spectrometer by following the method described by Sulejmani et al. (2014). In SPME method, about 5 g of cheese samples weighed into 40-mL amber screw vials with hole cap, and a PTFE/Silicone Septum (Supelco, Bellefonte, PA), and 10 µL internal standard which contains 55.2 µg of 2-methyl valeric acid and 0.8 µg of 2-methyl 3-heptanone, and 1 g NaCl were added into the vial. The vial were vortexed for 1 min and were maintained at 40 °C in a water bath for 20 min to equilibrate the volatile compounds in the headspace of the vial. Afterward, an SPME needle (2 cm–50/30 µm divinylbenzene/carboxen/polydimethylsiloxane stable flex, Bellafonte, USA) was inserted into vial, and the SPME fiber was exposed at a depth of 2 cm in the headspace of the vial for 20 min to extract the volatiles. The SPME needle was injected into the GC–MS (HP 6890 and 7895C MS, Agilent, USA) in the splitless mode; the desorption time was 3 min. The analysis conditions were as follows: Carrier gas: helium, Total flow: 1.2 mL/min, The column: HP5 MS (30-m 9 0.25-mm id 9 0.25-lm film thickness; J & W Scientific, Folsom, CA, USA), Mass spectra: electron impact mode, Ionisation voltage: 70 eV in 33–300 amu mass range. Oven temperature was programmed from 40 °C up to 230 °C at 10 °C/min, with initial and hold times of 5 and 20 min, respectively.
Microbiological analysis
The counts of lactic acid bacteria (LA) and probiotic starter cultures of Lactobacillus acidophilus and Lacticaseibacillus rhamnosus in the cheese samples were determined using the pour plate method (Maturin and Peeler, 2001). DeMan Rogosa Sharpe (MRS) agar, MRS agar with bromocresol green (0.04 %), and MRS agar with bile salt (0.15 %) were used for determining the counts of lactic acid bacteria, L. acidophilus , and L. rhamnosus, respectively. The plates with MRS agar were incubated at 30 °C for 48 h, while the plates containing MRS agar supplemented with bromocresol green and those with MRS agar supplemented with bile salt were incubated at 37 °C for 72 h under aerobic and anaerobic conditions, respectively (Buriti et al., 2005). The microbial counts were expressed as log CFU/g of cheese.
Sensory analysis
The sensory properties of the produced cheese samples were evaluated using the Spectrum™ method (Meilgaard et al., 1999). Six trained panellists (one female and five males, age range 26–45 years) conducted the sensory analyses. The sensory descriptors for the cheese samples were developed by these panellists. The panellists quantified the intensities of the attributes using a 15-point scale ranging from ‘not’ to ‘very’. Approximately 10 g of each cheese sample was presented in 3-digit-coded Styrofoam plates for the panellists. Water, unsalted crackers, and expectoration cups were used for cleansing the palate between samples (Meilgaard et al., 1999).
Statistical analysis
One-way analysis of variance (one-way ANOVA) was performed to determine the effect of supplementation of buffalo milk on the proximate composition of the produced cheese samples. Two-way analysis of variance (two-way ANOVA) was also performed to determine the differences between the cheeses samples in terms of total acidity, texture, color, WSN %, and microbiological properties during storage (Sheskin, 2004). Tukey’s test was conducted to compare the cheese samples and determine the statistically significant differences based on the significance threshold of p≤0.05. Non-parametric Welch and Games Howell tests were conducted on the sensory analysis data. All statistical analyses were conducted using Minitab 16.1 (Minitab Inc., State College, PA, USA) and SPSS for Windows 17.0 (SPSS Inc., Chicago, IL, USA).
Results and discussion
Proximate composition, titratable acidity (lactic acid %), and water-soluble nitrogen (WSN %) content in the produced cheese samples
The proximate composition of the cheese samples is provided in Table 1. Significant differences were observed between the cheese samples prepared using different ratios of cow milk and buffalo milk in terms of the dry matter, fat, and protein contents (p≤0.05). As reported in previous studies, buffalo milk has a higher composition of the above components compared to cow milk (Murtaza et al., 2017a; Maneesh and Amandeep, 2015). This was also reflected in the composition of the cheese produced from buffalo milk in the present study. The dry matter and fat contents in the produced cheese samples were in the ranges of 28.73-32.61 % and 41.91-55.55 %, respectively (Table 1). The BM cheese sample had the highest contents of dry matter, fat, and protein, as opposed to the CM cheese sample. In the case of ash content, no significant differences were observed between the cheese samples. The proximate composition of the produced cheese samples in the present study were consistent with those reported in previous studies (Chakraborty et al., 2021; Abd El-Aziz and Darwish, 2014; Valle et al., 2008). Valle et al. (2008) reported that the dry matter content of Minas type-fresh cheese produced from buffalo milk containing different types of probiotic cultures ranged between 35.75 % and 38.47 % during 28 days of refrigerated storage. Abd El-Aziz and Darwish (2014) reported that the Ricotta-like fresh cheese prepared from buffalo milk had higher dry matter, protein, and fat contents compared to the cheese produced from cow milk, which corresponds to the findings of the present study. Similarly, Rekowsky et al. (2020) determined that the Minas Frescal cheese prepared from buffalo milk and that produced from cow milk had 35.5 % and 27.1 % of dry matter, respectively, and fat content (in dry matter) of 46.1 % and 42.2 %, respectively. In a study by Chakraborty et al. (2021), the Chhana cheese (Indian cottage cheese) prepared from buffalo milk had 44.8 % dry matter, 50.24 % fat content (in dry matter), and 20.71 % protein, values which were higher than those observed in the present study.
Table 1. Proximate composition of the produced cheese samples
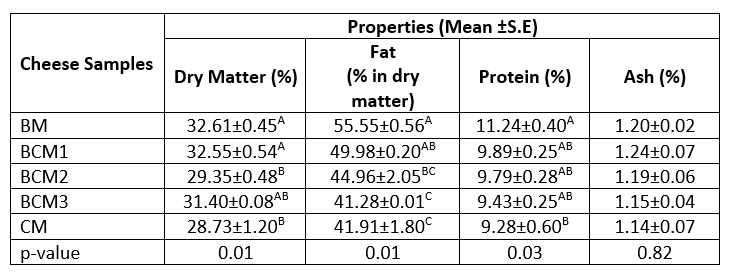
A-CMeans followed by different uppercase letters represent significant differences in the cheese samples for each property. BM: 100 %, buffalo milk, BCM1: 75 % buffalo milk : 25 % cow milk cheese, BCM2: 50 % buffalo milk : 50 % cow milk, BCM3: 25 % buffalo milk :75 % cow milk, CM: 100 % cow milk. S.E: Standard error
The variance analysis of the interaction effect of the source of milk and storage time revealed no significant effect on the titratable acidity and WSN content of the produced cheese samples. Only storage time was observed to have a significant effect on both attributes. In this regard, the titratable acidity and the WSN content increased significantly for all cheese samples during the 14 days of storage ( p≤0.05). After 14 days, no significant changes were observed in the titratable acidity and the WSN content in any of the cheese samples. The variations in the titratable acidity (lactic acid %) and water-soluble nitrogen content (WSN %) of the cheese samples during storage are presented in Table 2. The titratable acidity of the cheese samples ranged from 0.91 (lactic acid %) to 1.52 (lactic acid %), while the WSN % content varied between 7.88 % and 11.22 % during storage. The average titratable acidity of all the cheese samples was determined to be 1.01 %, and this value increased to 1.44 % by the end of the storage period. The titratable acidity of the cheese samples was lower than those reported previously for the Quark cheeses prepared from cow milk, kefir, and yayik buttermilk in the study by Ozturkoglu-Budak et al. (2021). Hamad (2011) reported a lower titratable acidity of 0.18 (lactic acid %) for the Quark-type Karish cheese prepared from fresh buffalo milk compared to that observed in the present study. In a study by Lepesioti et al. (2021), titratable acidity (lactic acid %) values in the range of 0.56-0.61 were observed for Quark-type cheeses prepared from unhomogenized and homogenized full-fat and reduced-fat cow milk heated under different conditions.
Table 2. The titratable acidity and water-soluble nitrogen (WSN %) values for the produced cheese samples
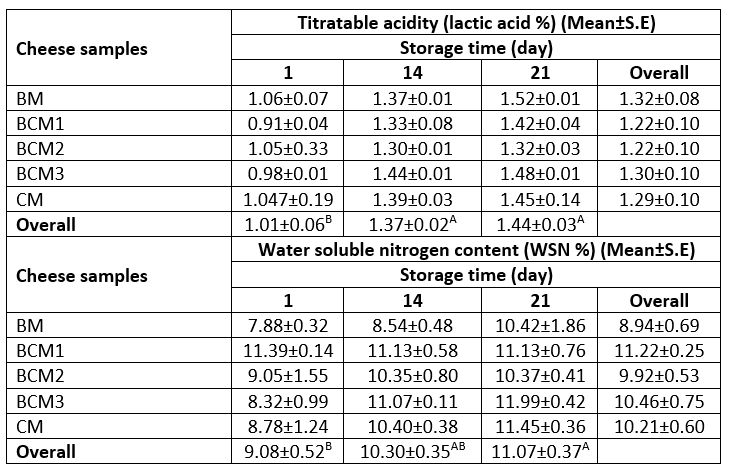
A-BMeans followed by different uppercase letters represent significant differences in the storage days for each property. BM: 100 %, buffalo milk, BCM1: 75 % buffalo milk : 25 % cow milk cheese, BCM2: 50 % buffalo milk : 50% cow milk, BCM3: 25 % buffalo milk : 75 % cow milk, CM: 100 % cow milk. S.E: Standard error
The WSN % values obtained in the present study were higher than those reported by El Zoghby et al. (2009), who observed that the soluble nitrogen content in the Queso Blanco cheese prepared from cow milk was in the range of 7.60-9.29 % during 21 days of storage at 5 °C, while the soluble nitrogen content in the cheese samples prepared from buffalo milk was in the range of 3.90-5.36 %. In a study by Buriti et al. (2005), the pH 4.6 soluble nitrogen content of Minas fresh cheese, which is a kind of rennet and lactic culture coagulated Brazilian cheese, was determined to be in the range of 14.89-23.28 % after 21 days of storage at 5 °C, and these values were higher than those obtained in the present study. Dimitreli et al. (2017) reported that the WSN content of white soft cheese stored for 3 months was not affected significantly by the type of milk used. However, the duration of the storage affected the WSN content significantly. Accordingly, the white soft cheese prepared from buffalo milk stored for 30 days had 13.5 % of WSN, while the white soft cheese prepared from a mixture of buffalo milk and cow milk (30:70) had a WSN of 13.6 %. Similarly, Mara and Kelly (1998) reported that the proteolysis step was affected by the type of process treatment used in Quark production rather than the compositional parameters of the type of milk used. In this regard, the Quark cheese prepared from the milk heated at high temperature or without rennet presented a lower increase in the WSN content during the 4-week-long storage compared to the Quark cheese prepared using rennet, glucono-δ-lactone, plasmin, and aprotinin. Overall, it may be concluded that the differences in the results of WSN % content for the different Quark-like probiotic cheese samples in the present study could be attributed to the differences in the varieties of starter cultures and enzymes used in the cheese production process and also to the storage duration. The increase in the WSN % content in the cheese samples during 21 days of storage may also be attributed to the action of residual rennet, which is primarily responsible for the initial hydrolysis of caseins (Fox and Law, 1991; Kondyli et al., 2008).
Colour parameters
Colour parameters of dairy products are significantly affected by several factors, including the structure of casein in the milk, the contents of fat and colour pigments (e.g., carotenoids and biliverdin) in the milk source, and the milk processing conditions (Milovanovic et al., 2020). In the present study, the L*, Hue, and Chroma values of the produced cheese samples during storage at 4 °C were determined (Table 3).
No significant effect of the interaction between storage duration and the source of milk was observed on the colour parameters (p≥0.05). However, the L* value of the cheese samples was affected significantly by the milk source alone, while the Hue and Chroma values were affected by the milk source and storage duration individually (p≤0.05). Accordingly, the increasing proportion of cow milk caused an increase in the L* and Hue values of the produced cheese samples. The CM cheese sample exhibited an L* value of 91.42, while the value was 90.72 for the BM cheese sample. The lower L* value observed for the BM sample could be related to its protein and fat contents, as protein particles and fat droplets are known to scatter or reflect light to different degrees in the visible spectrum (Milovanovic et al., 2020; Sameer et al., 2020). Moreover, the denaturation ratio of β-lactoglobulin and its conjugation to κ-casein present in cow milk could also have increased the L* value of the CM cheese sample (Milovanovic et al., 2020). The Hue values of the cheese samples ranged from 74.69 to 75.83 during storage, while the Chroma values ranged from 9.53 to 11.42. While no significant differences were observed among the BM, BCM1, and CM cheese samples in terms of the Hue value at the end of the storage period (p≥0.05), the BCM1 (75.73) sample presented a higher Hue value compared to BCM2 (74.69) and BCM3 (74.92) samples. The Chroma values of the cheese samples slightly increased during storage in all groups (Table 3). The CM cheese sample had a Chroma value of 10.91 at the end of the storage period, which was higher than that of the other cheese samples (Table 3). The differences in the Hue and Chroma values among the cheese samples could be attributed to the different proximate compositions (especially the fat and protein contents) and the different contents of natural colour pigments, such as riboflavin, carotenoid, and biliverdin, of cow milk and buffalo milk. Therefore, the coloured compounds formed in the Maillard reactions during the heating of milk could also have resulted in the differences in the Hue and Chroma values among the cheese samples (Milovanovic et al., 2020). Similar to the findings of the present study, Verruck et al. (2015b) reported Hue values of 74.16 and 74.19 for Minas Frescal cheese prepared from buffalo milk containing probiotic culture Bifidobacterium Bb-12 that was stored for 1 day and 30 days, respectively. The authors also reported L* and Chroma values of 89.66 and 7.33, respectively, for the same cheese after 30 days of storage, which are lower than the values obtained in the present study. In another study by Simões et al. (2013), significant differences were observed in the L*, a*, b*, and Hue values between the butter cheese prepared from Marajó manufactured with buffalo milk and that from cow milk. The butter cheese manufactured with 100 % buffalo milk had higher L* and Hue values compared to those prepared with 60 % buffalo milk and 40 % cow milk, which was different from the findings of the present study. Similarly, Chakraborty et al. (2021) reported that the Chhana cheese (Indian cottage cheese) prepared from buffalo milk had a higher L* value (93.9) compared to that obtained for cow milk cheese (87.2).
Table 3. Variation in the L*, Hue, and Chroma values of the produced cheese samples
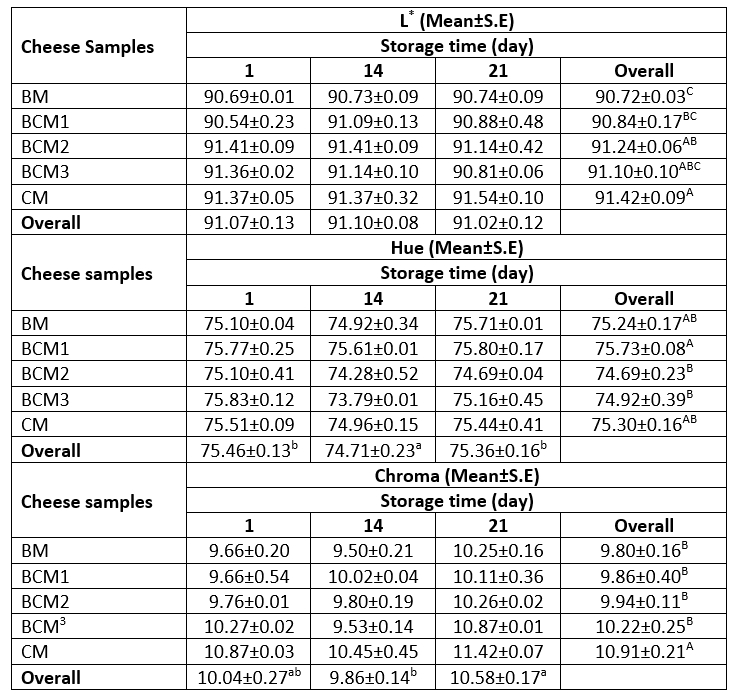
A–CMeans followed by different uppercase letters represent significant differences in the cheese samples for each property. a-cMeans followed by different lowercase letters represent significant differences in the storage days for each property. BM: 100 %, buffalo milk, BCM1: 75 % buffalo milk : 25 % cow milk cheese, BCM2: 50 % buffalo milk : 50 % cow milk, BCM3: 25 % buffalo milk : 75 % cow milk, CM: 100 % cow milk. S.E: Standard error
Textural properties
The variation in the hardness and total work done properties of the cheese samples during storage are presented in Table 4. The milk type used and the storage duration were observed to have a significant effect on the hardness of the cheese samples (p≤0.05). The BM cheese samples exhibited the highest hardness value of 432.62, while the lowest hardness value of 295.41 was exhibited by the CM cheese samples during storage. The BCM1, BCM2, and BCM3 cheese samples were similar in terms of hardness. The hardness values of the cheese samples increased significantly from storage day 1 to storage day 14 regardless of the milk source (Table 4).
The total work done values, which reflect the consistency of the cheese samples, were affected significantly by the milk type as well as by the storage duration (p≤0.05). The total work done values of the cheese samples increased significantly through the 14 days of storage, with the values ranging from 14.60 mJ to 27.80 mJ. The highest total work done value (25.57 mJ) was observed for the BM cheese sample, while the lowest value (16.23 mJ) was obtained for the CM cheese sample, which is consistent with the hardness results (Table 4).
The textural properties exhibited by different cheese types are diverse and distinctive for each type depending on the differences in the milk composition, the ingredients used for cheese production, and the cheese processing and ripening conditions. The hardness of the produced cheese is influenced mainly by its moisture content, changes in the pH, the concentration of calcium salts, and the interactions between casein micelles and other components present in cheese (Fox et al., 2017; Lucey et al., 2003). The dry matter content and the ratio of moisture to protein in cheese affect several textural characteristics of cheese, including its hardness, shreddability and meltability. In particular, higher dry matter content increases the hardness of cheese owing to the rigid structuration of the protein network with the increased protein concentration (Floury et al., 2009). The cheese structure is influenced by the fat content of cheese as well as the ratio of fat and the other components of cheese. For instance, an increase in the fat content was found to increase the instrumental hardness and spreadability of commercial US cream cheese samples containing fat in varying amounts (Brighenti et al., 2008). In addition, Lepesioti et al. (2021) reported that reduced-fat Quark cheeses exhibit greater hardness, gumminess, and chewiness compared to their full-fat counterparts.
The pH, the acidity values, and the mineral content of cheese also influence its textural characteristics. In general, lower pH responsible for causing the demineralization of the casein complex leads to a softer and further meltable and brittle cheese structure (Lucey et al., 2003; Pastorino et al., 2003). On the contrary, in the present study, the hardness and total work done values of the cheese samples during storage increased even with the increase in the total acidity. This increased hardness of the cheese samples could be related to the other physiochemical properties of cheese, such as milk composition, the amount of rennet, etc., as stated earlier, rather than the pH or acidity value (Lucey et al., 2003).
Numerous studies on the textural properties of different types of cheese produced from different milk types and under process conditions have reported diverse findings related to the textural parameters of cheese (Lepesioti et al., 2021; Seyed-Moslemi et al., 2021; Szkolnicka et al., 2021). For instance, Fangmeier et al. (2019) reported a higher hardness value (434.60 g) for the cream cheese prepared from buffalo milk compared to that prepared from cow milk (57.50 g). Marcatti et al. (2009) reported that the hardness value of the Minas-type fresh cheese prepared from buffalo milk containing L. acidophilus was 11.44 N (≈1166 g force), which is higher than the values obtained in the present study. Again different from the present findings, Buriti et al. (2005) reported a decrease in the hardness value of the Minas-type fresh cheese prepared from cow milk, lactic culture (L. lactis subsp. lactis + L. lactis subsp. cremoris), and L. acidophilus during 21 days of storage at 5 °C. The hardness value of the cheese samples was determined to be in the range of 2.46 N-1.37 N during storage.
Table 4. Variation in the hardness and total work done values of the produced cheese samples
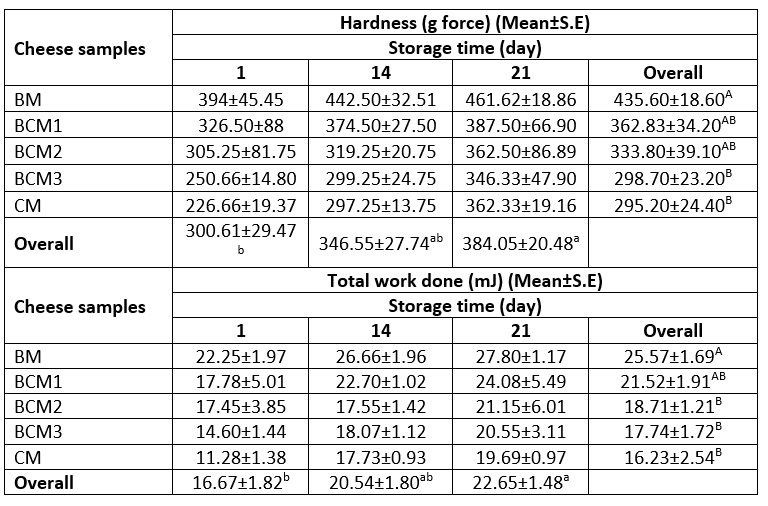
A–BMeans followed by different uppercase letters represent significant differences in the cheese samples for each property. a-bMeans followed by different lowercase letters represent significant differences in the storage days for each property. BM: 100 %, buffalo milk, BCM1: 75 % buffalo milk : 25 % cow milk cheese, BCM2: 50 % buffalo milk : 50 % cow milk, BCM3: 25 % buffalo milk : 75 % cow milk, CM: 100 % cow milk. S.E: Standard error
Volatile compounds
A total of 27 volatile compounds were identified in the cheese samples produced within this study. These volatile compounds included acids, alcohols, aldehydes, esters, ketones, and terpenic compounds (Table 5) and are recognized as major volatile compounds that contribute considerably to the flavour of several dairy products (Croissant et al., 2011; Nursten, 1997; Urbach, 1997).
In general, all cheese samples had relatively higher contents of acids, including acetic acid (vinegar), butanoic acid (cheesy), 3-methyl butanoic acid (pungent acidic), and hexanoic acid (sweaty), compared to other volatile compounds. The amount of all volatile compounds, except for acetoin, diacetyl, and hexanoic acids, was higher in the BM cheese sample compared to other samples (Table 5). The higher amount of acidic volatile compounds in the BM cheese samples could be attributed to the higher fat content and the hydrolysis of triglycerides in these cheese samples. Moreover, acidic volatile compounds are well recognized as free fatty acids that are formed through the chemical and enzymatic hydrolysis of milk fat, and α-keto acids such as 3-methyl butanoic acid may also be formed in cheese via the amino acid metabolism of lactic acid bacteria (Urbach, 1997).
Acetoin (creamy) and diacetyl (buttery) are responsible for the creamy flavour and sweet taste of dairy products. These two compounds were also determined in all cheese samples, although the respective amounts varied in different samples. While the BCM 1 cheese sample had the highest amount of diacetyl (38.45 µg/kg) and acetoin (104.80 µg/kg), the lowest amount of diacetyl (24.26 µg/kg) and acetoin (75.56 µg/kg) were observed in the BCM3 and CM cheese samples, respectively (Table 5). Homo/heterofermentative lactic acid bacteria produce diacetyl and acetoin, which are ketone-derived volatile compounds produced in citrate and lactose metabolism. Both compounds are related to each other, and diacetyl may convert to acetoin and 2-butanone (Demirkol et al., 2016; Cakmakci and Hayaloglu, 2011). Therefore, differences in the amounts of acetoin and diacetyl among different cheese samples could be due to the occurrence of the above-stated biochemical conversion reactions in the cheese samples.
Methyl ketones such as 2-nonanone (dirty) and 2-heptanone (waxy) were also detected in the cheese samples produced in the present study. The amounts of both the compounds increased as the proportion of cow milk increased in the cheese samples. Accordingly, the CM cheese samples contained 21.85 µg/kg of 2-heptanone and 13.57 µg/kg of 2-nonanone, higher than the values of these two compounds in the other cheese samples (Table 5). Methyl ketones are mainly formed upon the β-oxidation of fatty acids and decarboxylation of the β-keto acids produced from saturated fatty acids (Urbach, 1997). Therefore, the higher amounts of methyl ketones in the CM cheese samples could be related to these reactions and the associated differences in the saturated fatty acid composition between cow milk and buffalo milk. The biochemical activity of lactic acid bacteria (e.g., the β-ketoacyl Coenzyme A activity) could also have affected the formation of methyl ketones in the CM milk samples during the ‘draining of whey’ stage (Fox and Wallace, 1997).
Terpenes and sesquiterpenes are secondary metabolites occurring naturally in plants and are transferred directly from forage to dairy products (Mariaca et al., 1997). Among terpenes, d-limonene, α-pinene, γ-terpinene, and p-cymol were detected in different concentrations in the cheese samples in the present study, with the concentration of d-limonene being the highest among all terpenes detected. The amount of d-limonene in the cheese samples ranged from 27.98 to 44.33 µg/kg. The amounts of p-cymol and δ-terpinene were higher in the BM and BCM1 cheese samples, which had a higher proportion of buffalo milk compared to the other cheese samples. The amounts of p-cymol and γ-terpinene in the cheese samples were in the range of 3.87–2.73 µg/kg and 4.31-2.05 µg/kg, respectively.
While there are numerous studies on the variation in the volatile compounds present in several ripened or processed cheese types, studies on the evaluation of volatile compounds in fresh cheese produced from buffalo milk, except Mozzarella cheese, are scarce (Ozturkoglu-Budak et a., 2021; Seyed-Moslemi al., 2021). A review of the literature revealed that the results of the present study were in good agreement with those of previous studies that have reported the volatile profiles of Quark-like fresh cheese. In a recent study by Ozturkoglu-Budak et al. (2021), it was revealed that Quark cheese produced from kefir and buttermilk contained acetic acid, hexanoic acid, and octanoic acid in high amounts. In addition, it was reported that esters, including ethyl acetate, ethyl octanoate, and phenyl ethyl acetate were present in high quantities in the Quark cheese samples produced from kefir through yeast metabolism. Kondyli et al. (2013) reported that acetaldehyde was the most abundant aldehyde in Galotyri-type cheese, while acetone and ethanol were revealed as the major ketone and alcohol, respectively. In a study by Nogueira et al. (2005), 54 volatile compounds were detected in Minas cheese, among which butanoic acid and hexanoic acid were revealed as the major free fatty acids at the concentrations of 193 µg/g and 121 µg/g, respectively. In addition, 3-methyl-1-butanol (10.1 µg/g), 2-undecanone (3.44 µg/g), ethyl hexanoate (5.31 µg/g), phenyl ethyl alcohol (7.56 µg/g), and benzaldehyde (7.62 ethanol µg/g) were present in the high amounts. Also 121 µg/g of Copaene was identified as a feed-derived volatile compound in the Minas Cheese.
Table 5. Volatile compounds in the produced cheese samples
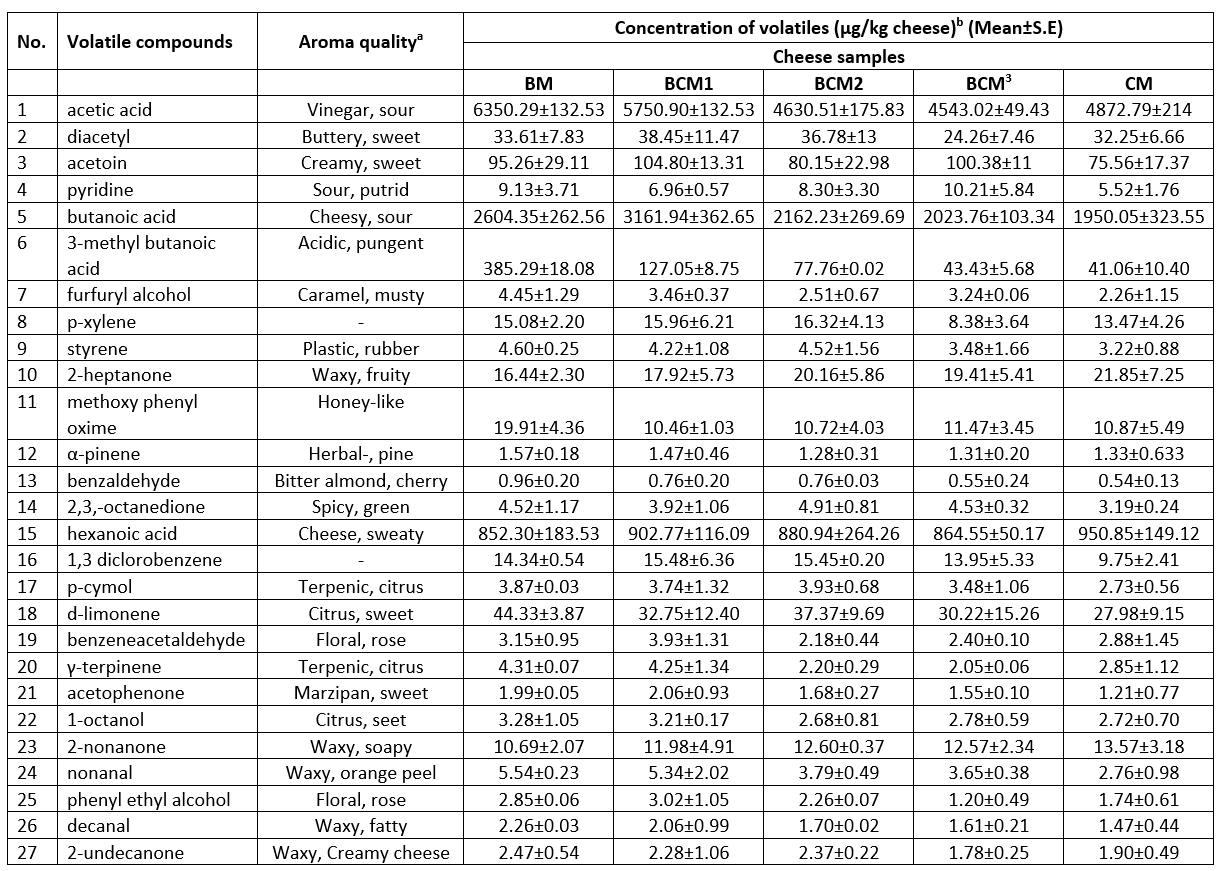
aFlavor descriptions based on The Goodscents Company information system (http://www.thegoodscentscompany.com/), bdetermined based mean relative abundance of the volatile. BM: 100%, buffalo milk, BCM1: 75 % buffalo milk : 25 % cow milk cheese, BCM2: 50 % buffalo milk : 50 % cow milk, BCM3: 25% buffalo milk :75% cow milk, CM: 100 % cow milk. S.E: Standard error.
Microbiological properties
In order to reveal the viability of probiotic cultures in the produced cheese samples, the counts of L. acidophilus, L. rhamnosus, Streptococcus spp., and Lactobacillus spp. were determined on the 14 th and 21 st days of storage. Table 6 presents the counts of the probiotic and yogurt cultures in the cheese samples. The variance analysis revealed that the counts of probiotic and yogurt bacteria were not affected by the interaction of the milk type and storage duration, while individually, both the parameters had a significant effect (p≥0.05). The counts for Streptococcus spp. and Lactobacillus spp. were in the range of 9.53-9.86 log CFU/g and 9.58-9.78 log CFU/g, respectively, while the counts for L. acidophilus and L. rhamnosus in the cheese samples were in the range of 9.02-9.18 log CFU/g and 9.12-9.30 log CFU/g, respectively. Since the viable probiotic bacteria count determined in each of the cheese samples was close to the recommended level for probiotic foods (9 log CFU per serving), it was inferred that all the produced cheese samples had similar microbial characteristics during storage, and the probiotic property was retained in all cheese samples throughout the 21 days of storage (Hill et al., 2014). These findings were consistent with those reported in previous studies (Pereira et al., 2010; Marcatti et al., 2009; Djurić et al., 2007). For instance, Marcatti et al. (2009) observed that the count of L. acidophilus decreased from 7.22 log CFU/g to 6.46 log CFU/g in Minas-type fresh cheese during 28 days of storage at 7 °C. On the other hand, Yalçın (2016) reported that the viabilities of Bifidobacterium bifidum and L. acidophilus were retained at the level of 5.49-7.4 log CFU/g and 7.12-7.79 log CFU/g, respectively, in salted (1%) and unsalted Lor cheese samples during 60 days of storage at 4 °C. Moreover, the viabilities of L. acidophilus La-5 and Bifidobacterium animalis subsp. lactis BL04 were retained at the highest level (7.0 log CFU/g and 8.0 log CFU/g, respectively) in fresh Petit-Suisse cheese during 28 days of storage at 4 °C (Pereira et al., 2010).
Table 6. Microbiological properties of the produced cheese samples
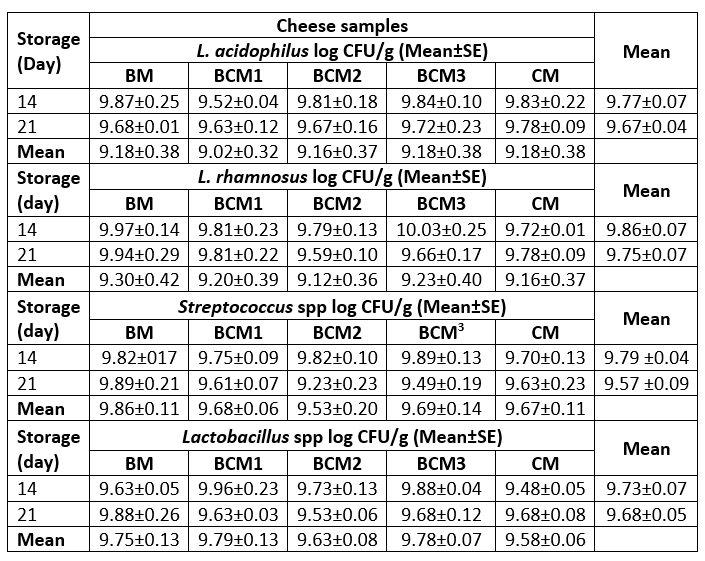
BM: 100 %, buffalo milk, BCM1: 75 % buffalo milk: 25 % cow milk cheese, BCM2: 50 % buffalo milk : 50 % cow milk, BCM3: 25 % buffalo milk : 75 % cow milk, CM: 100 % cow milk. S.E: standard error
Sensory properties
A total of 10 sensory descriptors were developed by the panellists for the produced cheese samples (Figure 2). The sour taste was determined at the highest intensities in all cheese samples, followed by the sweet taste. The higher sour taste scores could be related to the higher total acidity of the cheese samples (Table 2). The cheese samples were observed to be similar in terms of sweet and salty tastes and different in terms of the bitter taste. The BM cheese sample had a higher bitter taste compared to the CM cheese sample. This could be related to the differences in the hydrolysis of casein in Buffalo milk and cow milk due to the activity of rennet enzyme and proteolytic enzyme from lactic acid bacteria (Abd El-Salam and El-Shibiny, 2011). In addition, no significant differences were observed between the cheese samples in terms of fermented, cooked, fruity, animal-like, and whey flavours (p≥0.05). Creamy, cooked, and fermented flavours were the most prominent flavours in all cheese samples. As expected, the highest intensity for creamy flavour was exhibited by the BM cheese sample among all cheese samples (p≤0.05). This finding was expected as the BM cheese sample had the highest fat content.
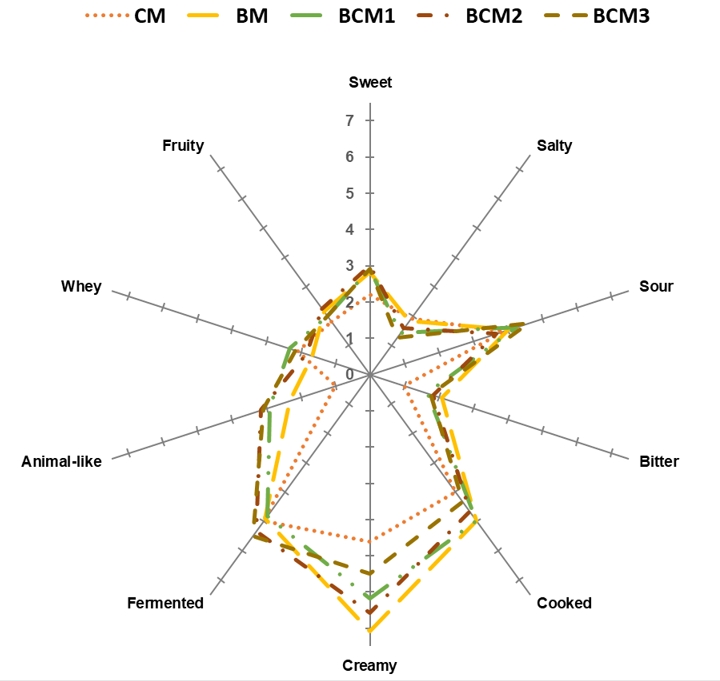
(BM: 100 %, buffalo milk; BCM1: 75 % buffalo milk: 25 % cow milk cheese; BCM2: 50 % buffalo milk : 50 % cow milk; BCM3: 25 % buffalo milk :75% cow milk; CM: 100 % cow milk)
Figure 2. Spider diagram of the sensory properties of the produced cheese samples
Similar taste and flavour attributes were reported for different types of fresh cheese in previous studies (Di Cairano et al., 2021; Sant’Ana et al., 2013). For instance, Di Cairano et al. (2021) characterized the sensory attributes of Stracchino cheese prepared from cow milk and buffalo milk and reported the presence of sour, sweet, salty, and bitter tastes, along with yogurt, yeast, and milk aromas. The quantitative descriptive analysis in that study revealed that the Stracchino cheese prepared from buffalo milk had higher intensities of sourness and oiliness compared to the cheese prepared from cow milk, similar to the findings of the present study. Conversely, the Stracchino cheese prepared from cow milk had higher intensities of milk aroma and sweet taste compared to the cheese prepared from Buffalo milk. Sant’Ana et al. (2013) reported acidic, salty, butter, and goat milk tastes, along with butter and goat milk aromas, for the Minas fresh cheeses prepared from cow milk or goat milk or a mixture of the two. The cheese samples prepared from cow milk had higher intensities of creamy flavour and butter taste and aroma, while the cheese prepared from goat milk had goat milk taste and flavours at high intensities as expected. No significant differences were determined between the cheese samples in terms of smooth appearance, soft and homogeneous texture, or salty and acidic tastes. Sameer et al. (2020) conducted the sensory descriptive analysis of probiotic buffalo milk Ricotta cheese and reported buttery, acidic, salty, Cheddar whey, yeasty, and mouldy/musty flavours. In addition, consistent with the present study findings, the average values determined for the intensities of acidic/sour taste and buttery and Cheddar whey flavours in the probiotic Buffalo milk Ricotta cheese were 3.8, 3.3, and 0.83, respectively.
Conclusion
The potential application of buffalo milk for the production of Quark-like probiotic cheese was investigated in the present study. It was revealed that the proximate composition, colour values, hardness, and volatile compound profiles of the cheese samples were affected by the proportion of buffalo milk used in the production process. While the acidity and water-soluble nitrogen content of the cheese samples were determined to be affected only by the storage duration, the interaction of milk source and storage duration did not affect the counts of probiotic and yogurt cultures in the cheese samples during 21 days of storage at 4 °C. Moreover, the viabilities of L. acidophilus and L. rhamnosus in the cheese samples were maintained above 9 log CFU/g during storage regardless of the milk source. Creamy flavour, bitter and sour tastes were determined as the characteristic sensory attributes in all cheese samples prepared from buffalo milk. Overall, buffalo milk was revealed as suitable for the production of Quark-like cheese with probiotic properties. According to the findings of the present study, it may be concluded that 25%–50% of buffalo milk should be used for producing fresh cheese products with higher sensorial and nutritional qualities. Further research is, however, required to fully explore the potential of using buffalo milk in the production of different types of fresh probiotic cheese, except Mozzarella cheese.
Acknowledgments
The authors thank Dr. Erman DUMAN for her help in obtaining buffalo milk from a local producer in Afyonkarahisar-Turkey.
Karakterizacija svježeg sira tipa Quark proizvedenog od mješavine mlijeka bivolice i kravljeg mlijeka
Sažetak
Cilj ovog istraživanja bio je ispitati mogućnost primjene mlijeka bivolice u proizvodnji svježeg sira tipa Quark obogaćenog dodatkom probiotičkih sojeva Lactobacillus acidophilus i Lacticaseibacillus rhamnosus. Pritom su proizvedeni uzorci sira od mješavine mlijeka bivolice i kravljeg mlijeka u različitim omjerima te su određivani sastav, fizikalno-kemijska i senzorska svojstva, parametri teksture i aromatski profil. Iz dobivenih rezultata vidljive su značajne razlike među proizvedenim uzorcima sireva s obzirom na udio suhe tvari, mliječne masti i proteina. Uzorci sireva koji su proizvedeni isključivo od mlijeka bivolice imali su veći udio suhe tvari i proteina u usporedbi s uzorcima proizvedenim isključivo od kravljeg mlijeka. Titracijska kiselost sireva kretala se u rasponu od 0,91 do 1,52 % mliječne kiseline, dok je udio topljivog dušika iznosio između 7,88 % i 11,22 % tijekom skladištenja. Povećanjem udjela kravljeg mlijeka rasle su i L* i Hue vrijednosti prilikom određivanja parametara boje. Određivanje parametara teksture pokazalo je kako su uzorci sireva proizvedeni isključivo od mlijeka bivolice bili najtvrđi, dok je suprotno utvrđeno za sireve proizvedene isključivo od kravljeg mlijeka. Najzastupljeniji hlapljivi aromatski spojevi u svim uzorcima bili su octena, butanska, 3-metil butanska i heksanska kiselina. Broj živih stanica probiotičkih sojeva L. acidophilus i L. rhamnosus tijekom skladištenja kretao se u rasponu 9,02-9,18 log CFU/g odnosno 9,12-9,30 log CFU/g. Senzorskom analizom utvrđeno je da su prije svega kiselo, a onda i slatko dominantni okusi u svim uzorcima sira. Osim toga, dominantnim su se također pokazale arome koje asociraju na kremasto, kuhano i fermentirano.
Ključne riječi: mlijeko bivolice; svježi sir; probiotičke kulture; hlapljivi spojevi; senzorska analiza
References
https://doi.org/10.3390/fermentation6040121
Arora, S., Sindhu, J.S., Khetra, Y. (2022): Buffalo Milk. In: P.L.H. McSweeney, J. McNamara (Eds.), Encyclopedia of Dairy Science (3rd ed) Academic Press. pp. 784-796. https://doi.org/https://doi.org/10.1016/B978–0–12–818766–1.00125–2
https://doi.org/10.1016/j.idairyj.2004.12.011
https://doi.org/10.1016/j.nfs.2021.02.002
Floury, J., Camier, B., Rousseau, F., Lopez, C., Tissier, J.P., Famelart, M.H. (2009): Reducing salt level in food: Part 1. Factors affecting the manufacture of model cheese systems and their structure-texture relationships. LWT-Food Science and Technology 42 (10), 1611-1620. https://doi.org/10.1016/j.lwt.2009.05.026
https://doi.org/10.3390/foods10010184
Meilgaard, M., Civille, G., Carr, B. (1999): Sensory evaluation techniques (3 rd ed.). CRC Press LLC.
Handbook of Milk of Non-Bovine Mammals, 2 nd edition, Wiley-Blackwell, p.284-342. https://doi.org/10.1002/9781119110316.ch4.2
Wrolstad, R.E., Smith, D.E. (2017): Color analysis. In S.S Nielsen (Ed.), Food Analysis, Cham: Springer International Publishing, pp. 545–555.
https://doi.org/10.1007/978-3-319-45776-5_31
Yang, D.Y., Liu, L., Chen, X., Speller, C.F. (2008): Wild or domesticated: DNA analysis of ancient water buffalo remains from north China. Journal of Archaeological Science 35 (10), 2778-2785. https://doi.org/10.1016/j.jas.2008.05.010