
Introduction
Cheese is an almost irreplaceable component of the human diet. From the nutritional point of view, cheese is a good source of high quality proteins, easy digestible fat, some vitamins and minerals. Furthermore, numerous studies (Pritchard et al., 2019; Abadia-Garcia et al., 2013; Erkaya and Şengul, 2015; Mushtaq et al., 2016; Bainbridge et al., 2016; Barać et al., 2019, 2021) conducted over the last twenty years have indicated that cheeses had a great potential as a source of bioactive compounds (including bioactive peptides, short-, odd- and branched-chain fatty acids, natural trans-fatty acids, CLA) which may significantly contribute to human health.
It is well known that numerous factors, including type and quality of milk, cheese processing method which in turn depends on cheese variety, significantly influence its properties. For the most of the cheese varieties, ripening is the major phase of cheese production, during which specific sensory and nutritive characteristics are formed. Ripening as a complex dynamic phase includes chemical, microbiological and biochemical changes of the major cheese compounds. Due to proteolysis, lipolysis, glycolysis, and further degradation of free amino acids or free fatty acids, appearance, texture, microstructure, and flavour of the final ripened cheese is formed (Hayaloglu et al., 2012; Tudor Kalit et al, 2020). Furthermore, some of the peptides released during ripening exhibit different bioactivities including immunomodulatory, antihypertensive, antimicrobial, antioxidant and opioid activity (López-Expósito et al., 2012; Baum et al., 2013; Pisanu et al.,2015; Barać et al., 2017; Fialho et al., 2018). These so called bioactive peptides are mainly derived from caseins and are the result of the action of rennet enzymes, proteinases and peptidases from starter bacteria, secondary microflora, indigenous milk enzymes and exogenous proteolytic enzymes, if used. Today, it is known that the level of these peptides as well as the other sensory and nutritive characteristics is determined by the cheese variety.
Kupres cheese is a full-fat hard cheese prepared from cow`s, sheep`s, goat`s milk and their mixture. It is produced in the Kupres area at an altitude 1200 meters, with unique conditions for livestock breeding and the production of milk and dairy products. According to our knowledge, except two studies conducted by Rizvanović et al. (2018, 2019), who characterized the production process and technological characteristics of Kupres cheese, in current literature there are no data related to the ripening changes, which closely determines its nutritive quality. Thus, the aim of this work was to investigate the change of protein and fatty acid profiles and mineral content during 3 months of ripening of Kupres cheese made from cow`s milk. Also, the influence of ripening on antioxidant potential of this variety of cheese was followed.
Materials and methods
Cheese making
The Kupres cheese was prepared at the local dairy "Kupres Milk" d.o.o., according to the procedure described in detail by Rizvanović et al. (2018). Briefly, cheese was manufactured from pasteurized (72-73 °C for 10-15 sec) cow`s milk using thermophilic starter culture (1.2 g/100 L, Christian Hansen, TCC - 20; Lactobacillus helveticus, Streptococcus thermophilus). Milk was coagulated during 30 min at 32 °C using commercial rennet (Christian Hansen, CHY-MAX® Powder Extra NB, 15g/1000 L milk). The curd was cut crossways into cubes of 1 cm3 and tempered at 48-49 ºC. The curd was pressed for 150 min (20 min at 0.5 bars, 20 min at 1 bars, 30 min at 1.5, 2.0 and 2.5 bars and finally 20 min at 3.0 bars), salted in brine (22/23 Bé°) for 48 hours and ripened at 14-16 °C with the relative humidity of 80-85 % in the ripening room for up to 3 months. Cheese making procedure was carried out on three consecutive days in three replicates. The cheese was sampled at the 1, 30 and 90 days of ripening.
Chemical analysis
The chemical composition of Kupres cheese was determined by using standard analytical methods. Dry matter of the cheeses was determined by the standard drying method at 102±2 °C (IDF, 1982) whereas fat content was determined according to the method of Van-Gulik (IDF, 1986). The fat content was expressed as fat in dry matter (FDM). Moisture on a fat-free basis (MFFB) was calculated according to the CODEX ALIMENTARIUS (1978). The nitrogen content was determined by the Kjeldahl method (Ardö and Polychroniadou, 1999), the protein content was calculated as the nitrogen content multiplied by 6.38 and expressed as percentage of dry matter (%TP/DM). The salt content was estimated by the potentiometric method using MK II chloride Analyzer 926 (Sherwood Scientific, UK) and expressed as salt content and salt in moisture content (S/M) as suggested by Spreer (1998). The pH of cheeses was measured by using a pH meter (Metrohm 632, Methrom, Switzerland) with WTW - SenTix Sp (Xylem Analytics, UK) electrode.
Assessment of proteolysis
The change of nitrogen compounds of Kupres cheese during ripening was followed by using water-soluble nitrogen (WSN) and nitrogen soluble in 12 % trichloracetic acid (TCA-SN) as suggested by Kuchroo and Fox (1982). Briefly, 10 g of previously homogenized cheese was extracted in 50 mL of deionized water for 60 min at 40 °C. After that, the extract was cooled at the room temperature, filtered through Whatman No1 and centrifuged at 4.000 g for 15 min. A quantity of 20 mL of clear supernatant was used to determine the content of water soluble nitrogen (WSN) by the Kjeldahl method (Ardö and Polychroniadou, 1999). A quantity of 10 mL of supernatant was treated with 10 mL of 24 % TCA, filtered and its nitrogen content was determined by the same method. Both parameters are calculated as a percentage of total protein content. Besides these parameters, proteolysis was also monitored by electrophoresis of Tris-HCl extracts of cheese proteins and water-soluble fractions under reducing conditions (SDS-PAGE) using the method of Fling and Gregerson (1978). Electrophoresis was performed on 5 % (w/v) stacking and 12.5 % (w/v) resolving gel (Gel electrophoresis apparatus, LKB-2001- 100, LKB, Uppsala, Sweden). Tris-HCl extract of cheese was prepared as suggested by Barać et al. (2021). Water-soluble fraction which was prepared by the method of Kuchroo and Fox (1982) was diluted with Tris-HCl buffer (0.055 M Tris–HCl, pH 6.8, 2 % SDS, 5 % β-mercaptoethanol (v/v), 7 % glycerol, 0.0025 % bromophenol blue) and filtered. Low molecular mass calibration kit (Pharmacia, Uppsala, Sweeden) was used to estimate molecular masses of the identified polypeptides and proteins. The scanned gels were analysed by SigmaGel software version 1.1 (Jandel Scientific, San Rafalel, CA). Caseins and polypeptides were quantitatively determined by integration of peak volumes. Intensity of casein bands was quantified from the gel on which 25 μL of the samples were applied. Each pattern was analysed in triplicate. Residual content of identified caseins was expressed as a percentage of their initial contents of 1- day- old cheese.
Fatty acid profiles
The fatty acid content of Kupres cheeses was determined as suggested by Barać et al. (2018). A quantity of 0.5 g of cheese was extracted in 10 mL of heptane in an ultrasonic water bath for 1 hour and then for 24 hours at the room temperature. The extract was filtered through Whatman No. 1 filter paper and evaporated under a stream of nitrogen. Fatty acids were dissolved in 1 mL of hexane and transformed into methyl esters (FAME`s) using 1 mL of 14 % Borontrifluoride-Methanol. The mixture was heated at 100 °C for 1 hour, cooled to the room temperature and metal esters were separated in the hexane phase after the addition of 1 mL of deionized water.
FAMEs were separated using capillary gas chromatography with flame ionization detector (GC/FID) The GC/FID (Agilent Technologies 6890, Santa Clara, CA, USA) was equipped with split/splitless injector and SP-2560 (length 100 m, i.d. 0.25 mm, film thickness 0.20 μm, Supelco, Bellefonte, USA). The obtained chromatographic peaks were identified by using Supelco 37 Component FAME mix standard (Supelco, Bellefonte, USA). Fatty acid content was calculated in mg/g of lipids and expressed in relative quantities as the mass percent of total fatty acids.
Indexes of lipid quality
Based on the fatty acid profile analysis, the unsaturated/saturated fatty acids (SFA/UFA) ratios, desirable fatty acids (DFA), the atherogenicity index (AI) and thrombogenicity indices (TI) of cheeses were calculated. DFA was calculated according to following equation:
DFA= ΣMUFA +ΣPUFA + C18:0
The AI and TI indices were calculated as proposed by Ulbricht and Southgate (1991) through the equations:
AI = [(4 × C14:0) + C16:0]/ΣMUFA +ΣPUFA (1)
TI=(C14:0+C16:0+C18:0)/(0.5MUFA+0.5PUFA-n6+3PUFAn3+PUFA-n3/PUFA-n6) (2)
AI indicates the relationship between the sum of the main saturated FAs (considered as pro-atherogenic) and the main classes of unsaturated FAs (considered as anti-atherogenic). TI reflects the tendency to form clots in the blood vessels and represents the relationship between the pro-thrombogenetic (saturated) and the anti-thrombogenetic fatty acids.
Mineral profiles
Prior to determination of the total content of elements, the homogenized sample (0.5 g) was placed in PTFE vessel, followed by addition of 7 mL 65 % HNO3 and 2 mL of 30 % H2O2. The mixture was digested in microwave oven (CEM Mars 6, US) at the temperature of 210 °C and pressure of 6 atmospheres. The sample was cooled to room temperature and made up to 25 ml with deionized water and conserved at 4 °C until its analysis with ICP.
The content of macro elements Na, K, Mg, Ca, S and P were determined by the method of Inductively coupled plasma - optical emission spectrometry (ICP-OES), model ICAP 6500 Duo (Thermo Scientific, United Kingdom). The calibration curves were constructed by dilution of the solution obtained by mixing standard PE-CAL4-ASL-1 for Na, K, Mg and Ca, ICP-41W-1 standard for S and ICP standard ICP-41W-1 for P.
The content of 13 micro and trace elements, including Fe, Zn, Cu, Mn, Mo, Co, Cr, Se, B, Al, Ni, Pb, Hg, Cd and As were determined by Inductively coupled plasma mass spectrometry (ICP-MS) (ICAP Q, Thermo Scientific, UK). The system was controlled with Qtegra Instrument Control software. For calibration ICP multi-element standard solution XXI for MS (MES-21-5) and Hg ICP standard suppl. to multi-element standard XXI for MS (MS MES-21-HG-1) were used.
Antioxidant properties
The effect of ripening on antioxidant properties of Kupres cheese is determined by using two parameters, total antioxidant capacity (TAC) and ferric reducing power (FRAP). TAC was assayed using so called QUENCHER (Quick, Easy, New, Cheap and Reproducible) according to Serpen et al. (2008) which is based on the direct measurement of the antioxidant activity of solid samples. As the stock solution 7 mM aqueous solution of ABTS (2,2-azino-bis / 3-ethyl-benothiazoline-6-sulfonic acid) with 2.45 mM potassium persufate was used. ABTS • + working solution was prepared by diluting the stock solution with water/ethanol (50:50, v/v). A quantity of 10 mg of grated cheese was mixed with 1 ml of working ABTS solution (absorbance was 0.7-0.8). The mixture was vigorously vortexed for 7 min, centrifuged at 17.000 g for 2 min. The absorbance of supernatant was read at 734 nm. The ability of cheese to neutralize free radicals was calculated using the following equation:
% of ABTS inhibition = ((Ac-As)/Ac) x 100 (3)
where:
Ac - absorbance of control
As - absorbance of control
Total antioxidant capacity was also calculated as the Trolox equivalent antioxidant capacity (TEAC) in mg of Trolox per kg of sample.
Ferric reducing power was measured according to Meira et al. (2012) slightly modified by Barac et al. (2019). Grated cheese was dissolved in potassium phosphate buffer (15 mg/mL) and stirred vigorously on a mechanical shaker for 2 h. Then, the extract was centrifuged at 3.000 x g for 10 min and the obtained supernatant was used for FRAP analysis. Briefly, 2.5 mL of the supernatant was mixed with 2.5 mL of potassium ferricyanide and incubated at 50 °C for 20 minutes. After that, 2.5 mL of TCA was added and the precipitate was separated by centrifugation at 3000 g for 10 min. The supernatant (2.5 mL) was mixed with 2.5 ml of deionized water and 0.5 mL of iron chloride. The mixture was vigorously vortexed and the absorbance was measured at 700 nm. An increase of the absorbance indicates better FRAP activity of the samples.
Results and discussion
Chemical composition of Kupres cheese
Table 1 shows the change of the chemical composition of the Kupres cheese that occurred during 90 days of ripening.
Table 1. The effect of ripening on chemical composition and relative content of the major caseins in Kupres cow's cheese
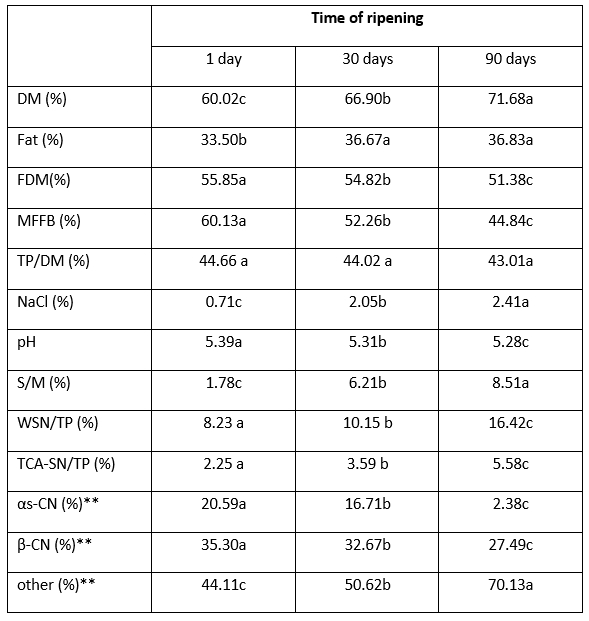
*values represent means; values with the same letter within the same row are not statistically significant at p<0.05; **relative content based on densitometric analysis of SDS-electrophoregrams
From the presented results it is evident that ripening significantly (p˂0.05) affects DM, FDM, MNFS and pH of Kupres cheese. On the contrary, no significant influence on the TP/DM content can be observed. Due to the continual loss of moisture through 90 days, the average DM content of Kupres cheese increased from 60.02 % to 71.68 %. This is followed by the reduction of FDM, MFFB and slow decrease of pH up to 5.28. Due to the reduction of moisture and increase of the NaCl content, after 90 days, salt in moisture increased to 8.51 % which corresponds to the value in Livno cheese after 8 weeks of ripening (8.45 %) as reported Matić (2012) but higher than in fungi cheese (6.00 %) or Emmental (4.00 %) (Spreer, 1998). According to FDM content, Kupres cheese belongs to the full-fat cheeses, which confirms findings of Rizvanović et al. (2018, 2019). Somewhat different from this, MFFB content of Kupres cheese after 30 and 90 days of ripening classifies it into the group of hard resp. extra hard cheeses, which is in line with results obtained by Rizvanović et al. (2018, 2019). The average pH of 90-day-old cheeses was in accordance with the value of several other hard-cheese varieties reported by Fox et al. (2000) and the pH of 100-day-old Kupres cheese reported by Rizvanović et al. (2018). However, the trend of pH observed in this study differed from that reported by Rizvanović et al. (2019). More precisely, these authors noticed a slow increase of pH during 100 days of ripening of Kupres cheese up to 5.33. Such disagreement can be attributed to different acidity of proteolytic products released during ripening.
Nitrogen fractions and proteolysis
Table 1 shows the change of water- and TCA- soluble fractions during ripening and Figure1 the results of SDS- electrophoresis.
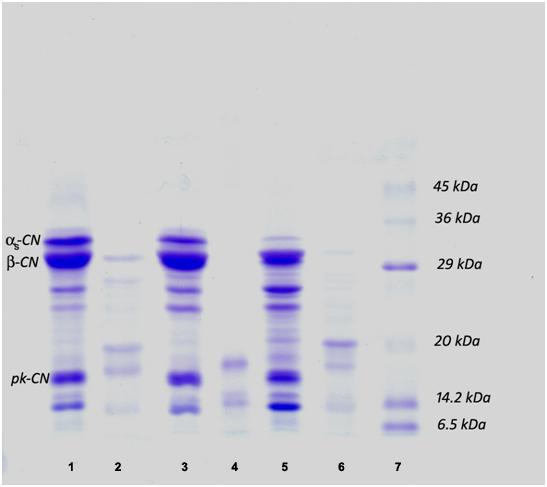
1, 3, 5 - Tris-HCl extracts of cheese ripened for 1, 30 and 90 days, respectively;
2, 4, 6 - WSN of cheese ripened during 1, 30 and 90 days, respectively; 7. Low molecular weight standard
Figure 1. SDS-profiles of Tris-HCl extracts and WSN fractions of Kupres cheese
It is well known that the content of WSN/TN reflects the level of proteolysis in general whereas TCA-SN/TN as a part of WSN fraction indicates the level of low molecular weight products formed during the secondary proteolysis (Kuchroo and Fox, 1982). The average content of WSN of one-day-old Kupres cheese was 8.23 %. As the TCA-SN/TN content was 2.25 %, the majority of WSN fraction represented high molecular weight peptides. Primary proteolysis occurs, mainly on αs-casein and β-casein thanks to the activity of chymosin, plasmin and other indigenous milk enzymes. The relatively high content of both nitrogen fractions in one-day-old cheese indicates intensive proteolysis that occurred during cheese making and initial day of ripening. This was supported by the SDS-profiles of WSN fraction and Tris-HCl extract of one-day-old cheese which contained numerous high molecular weight products (Figure 1, Lines 2 and 1). Similar values of WSN/TN and TCA-SN/TN were observed by Kalit et al. (2016) at the beginning of the ripening of traditional cheese from Livno. During the first month of ripening, relatively slow proteolytic changes were induced; after 30 days of ripening WSN/TN content increased up to 10.15 % mainly due to the degradation of previously formed proteolytic products and the increase of TCN-SN/TN up to 3.59 % (Table 1). This was supported by the fact that after 30 days, high molecular weight products (m.w. > 18.2 kDa) were hydrolysed completely (Figure 1). Further ripening up to 3 months caused a more intensive increase of WSN/TN (up to 16.42 %) but a slow increase of TCA-SN/TN (up to 5.58 %). This reflects in the low bacterial activity mainly responsible for low molecular weight products (TCA-SN) probably due to the unfavourable conditions such as the loss of moisture and the increase of salt and salt in moisture content reported in Table 1. It seems that proteolysis occurring between 30-90 days is mainly based on the activity of residual coagulant and bacterial enzymes and to a less extent of plasmin. This was confirmed by the SDS-PAGE. The SDS-profile of WSN of 90 day-old-cheese contains several high molecular weight peptides within the range of 20 kDa - 31 kDa (Fig 1, Line 6).
Ripening also affected the distribution of the major caseins, αs-CN and β-CN of Kupres cheese (Figure 1, Table 1). Ripening reduced the content of both caseins, but to the different extent. Furthermore, the level of residual αs-CN and β-CN in Kupres cheese greatly depends on time of ripening (Figure 2). After 30 days of ripening, the relative contents of αs-CN and β-CN of one-day-old cheese (20.59 % and 35.30 %) decreased to 16.71 % and 32.67 % (Table 1). Simultaneously, the residual levels of these caseins were 80.93 % (αs-CN) and 92.27 % (β-CN). More intensive proteolysis of both caseins occurred during next 60 days. Residual level of αs-CN and β-CN in 90-day-old cheese was 12.02 % and 80.96 %, respectively (Figure 2). Consequently, they represented 2.38 % (αs-CN) and 27.49 % (β-CN, Table 1) of extractable peptides and proteins of the 90-day-old cheese. Different susceptibility of the major caseins to proteolytic enzymes is well documented. Several authors ((Viser and de Groot-Moster, 1977; Hayaloglu et al., 2002; Sarantinopoulos et al., 2002, Barać et al., 2016) highlighted higher resistance of β-CN compared to αs-CN in the case of ripening of different cheese varieties.
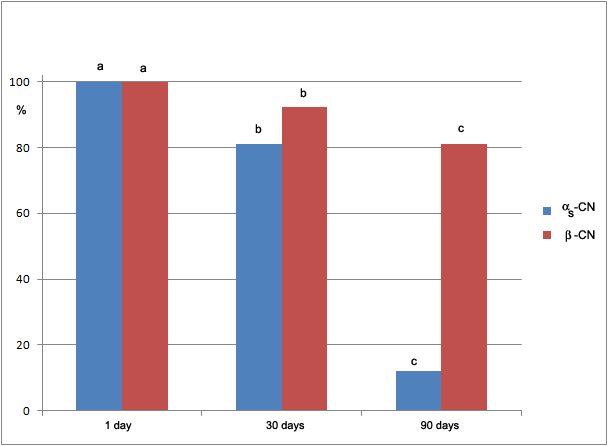
*data marked with different letter within the same casein are significantly different at p<0.05
Figure 2. Changes of the residual content (%) of αs-CN and β-CN during 90 days of ripening of Kupres cheese*
Fatty acid profiles
The change of fatty acid profiles of Kupres cheese during ripening is shown in Table 2, whereas the health lipid indices are presented in Table 3.
Table 2. Changes in the fatty acid profile during 90 days of ripening of Kupres cheese*
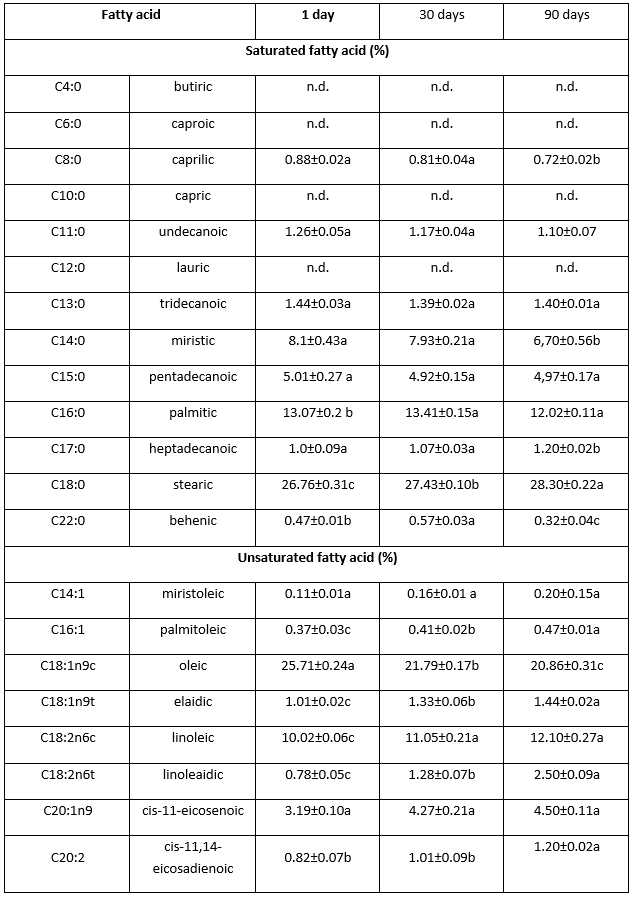
*values represent means; values with the same letter within the same row are not statistically significant at p<0.05
Under conditions used in this study, in Kupres cheeses, 17 fatty acids were detected; nine of them were saturated (SFA), whereas eight were unsaturated, monounsaturated (MUFA) and polyunsaturated (PUFA) fatty acids. According to data presented in Table 2, no qualitative differences between fatty acid profiles of analysed cheeses were detected. However, ripening induced the change of fatty acid contents. SFAs were dominant in all analysed cheeses, and they represented 57.99 % (one-day-old) and 56.63 % (90-day-old cheese) of all identified fatty acids (Table 2). The observed ratios of SFAs are in a good agreement with data reported for several hard cow`s cheese varieties reported by Paszczyk and Łuczynska (2020) and Domagala et al. (2010). The most abundant saturated fatty acids in all of the samples were myristic (C14:0), palmitic (C16:0) and stearic (C18:0), which represented 8.10-6.70 %, 13.07-12.02 % and 26.76-28.30 % of identified fatty acids, respectively. Furthermore, it is interesting to note that analysed cheeses did not contain short-chain fatty acids (C4-C6, SCFA). Also, lauric acid (C12:0) and capric acid (C10:0) were not detected, while myristic acid (C14:0) was the most abundant medium-chain fatty acid (C8:0 - C14:0).
Table 3. Changes in health indices of Kupres cheese during 90 days of ripening*
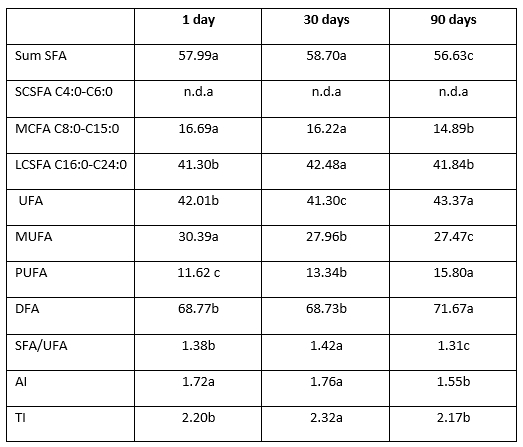
*data were presented as average values; values with the same letter within the same row are not statistically significant at p<0.05; AI - atherogenicity index; TI - thrombogenicity index
In general, SFAs are considered as compounds that may have a negative effect on blood lipids, although there is no clear evidence that cheese lipids contribute to any disease. In addition, it is also known that individual SFAs have different effects on blood cholesterol levels (Legrand and Ryok, 2010). Medium-chain length saturated fatty acids, such as lauric and myristic acid, generally have a greater total plasma cholesterol raising effects than those with longer chain length (palmitic and stearic acid) (German and Dillard, 2006). Also, lauric acid, which is not detected in Kupres cheeses, is more potent than myristic or palmitic acid (Parodi, 2009). Furthermore, from the Table 1, it is evident that the most abundant SFA in Kupres cheeses is stearic acid (C18:0). This saturated fatty acid can be rapidly converted into C18:1 (oleic acid) fatty acid (Jakobsen et al., 2009). Thus, it is considered as healthier than other SFAs and is not associated with cardiovascular risk.
Fatty acid profiles of Kupres cheese also contained C15:0 and C17:0, their content depending on time of ripening was in the range of 5.01-4.92 % and 1.0-1.20 %, respectively. These fatty acids originated from milk and are the result of microbial fermentation in rumen. For a long time, they were considered to have no biological function. Today, they are positively associated with the improvement of insulin sensitivity (Pedersen et al., 2016) and the reduction of risk of developing diabetes type II (Forohi et al., 2014). High content of these fatty acids is related to organic production of milk (Kuche et al., 2015). Thus, they are generally accepted as biomarkers of milk fat intake (Yakoob et al., 2014).
The content of UFAs in Kupres cheese was found to be in the range of 41.30-43.37 % (Table 3). MUFAs were dominant and represented 27.47-39.39 % of identified fatty acids whereas the content of PUFAs was 11.62-15.80 %. The most common unsaturated fatty acids were oleic (C18:1n9c) and linoleic (C18:2n6c) (Table 2). The observed range of UFAs content of Kupres cheese was inconsistent with data reported by Damagala et al. (2010) and Paszczyk and Łuczynska (2020), mainly due to the higher content of PUFAs. High content of unsaturated fatty acids of Kupres cheese could be attributed to grazing of cows on mountain pastures. It was established that the milk fat composition and grazing of cows on mountain pastures were related (De Noni and Battelli, 2008). It was also shown that grazing of cows on mountains increased the level of unsaturated acids, especially PUFAs (Romazin et al. 2013). Moneeb et al. (2019) also showed that an intensive silvopastoral system of grazing of cows induced high levels of saturated acids (lauric, myristic and palmitic) and high content of stearic, linoleic and γ-linolenic acid in milk and in fresh Domiati cheese.
As is evident from the Table 2 and Table 3, 30 days of ripening did not affect fatty acid profiles of Kupres cheese in general. Further ripening slightly reduced the content of saturated fatty acids as well as the content of MUFAs. As a result, 90-day-old cheese had an increased level of PUFAs; PUFAs made up 15.80 % of identified fatty acids. It seems that longer ripening induced bioconversion of a part of MUFAs into PUFAs. This is supported with the fact that the ratio of oleic acid as the major monounsaturated fatty acid decreased (up to 20.86 %) which was followed by the increase of linoleic acid content. It is known that oleic acid is a precursor of linoleic acid biosynthesis (Chamberlin et al., 2014).
As a result of the observed trends of SFAs, MUFAs and PUFAs, ripening longer than 30 days improved health indices of Kupres cheese fat (Table 3). The 90-day-old Kupres cheese had lower values of SFA/UFA and AI index (1.31 and 1.55) related to 1-day-old cheese (1.38 and 1.72), whereas no significant (p<0.05) differences between TI indexes were detected. Similar value of AI (1.68) of hard cow’s cheese was reported by Paszczyk and Łuczynska (2020), but due to the lower content of UFAs, this cheese had less favourable TI (3.13) than Kupres cheese (2.17). In addition, Hirigoyen et al. (2018) reported higher AI and TI values (2.21 AI and 2.84 TI) of traditional Brazilian hard cheese Colonia compared to the Kupres cheese. It is known that AI and TI characterize atherogenic and thrombogenic potential. Thus, lower values of these parameters indicate that the consumption of Kupres cheese can contribute to the reduction of the risk of coronary heart disease.
Mineral profiles of Kupres cheese
Table 4 shows the content of macroelements (calcium, phosphorus, magnesium, potassium, sodium and sulphur) and microelements (iron, zinc, copper, manganese, cobalt and boron) detected in Kupres cheeses ripened up to three months.
Table 4. Mineral profiles of Kupres cow’s cheese
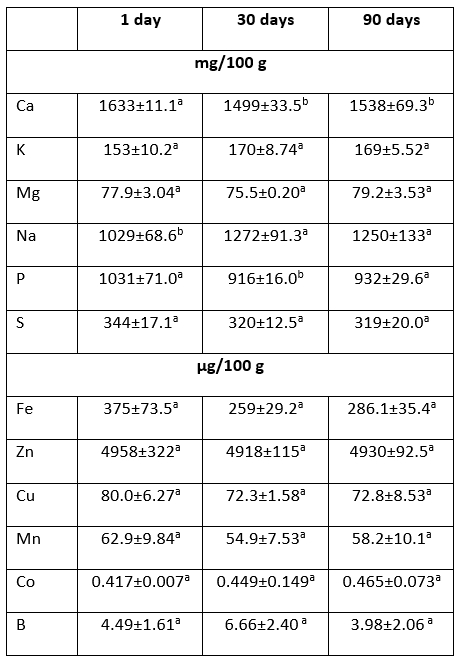
*values represent means ± standard deviation; values with the same letter within the same row are not statistically significant at p<0.05
As it could have been expected, three macroelements, Ca, P, and Na were the most abundant ones. The content of Ca and P was in the range of 1633-1499 mg/100 g and 916-931 mg/100 g, respectively. Numerous factors, such as type and quality of milk (genetic characteristics, the stage of lactation, environmental conditions, the type of pasture, soil contamination etc.) and cheese processing, particularly ripening, influence mineral content of cheese. Thus, in current literature, different data related to mineral contented of hard type of cheeses are presented. However, the observed ranges of Ca and P were in accordance with the average values for different cow`s hard-type of cheeses reported by Manuelian et al. (2017). Furthermore, the ratio Ca/P was 1.58-1.65, which is in the range that is considered to be normal (Jennes, 1980).
Mineral content profiles of Kupres cheese were similar. Except for Ca, Na and P, no significant (p<0.05) differences in mineral contents were observed. After the first month of ripening, a significant decrease in Ca and P contents was detected, which was accompanied by the increase in Na content. Further ripening did not significantly affect their contents. It is known that some of the mineral salts may migrate from the central part towards the external layer of the cheese block or vice versa (Gambelli et al., 1999; González-Martín et al., 2009). It seems that during the initial 30 days of ripening, a part of Ca and P from water phase diffused out the cheese while NaCl penetrated from the surface of the cheese. This is in accordance with the change of water and NaCl contents (Table 1). Further ripening did not significantly affect the change of Ca, P and Na contents, probably due to the much slower diffusion.
According to Table 4, the ripening did not significantly influence the content of the other macroelements (K, Mg and S) and trace elements. This suggests that they are firmly incorporated into the Kupres cheese matrix. The major microelement of Kupres cheese was Zn. Its content was around 4900 µg/100 g; this agreed with the data reported for other cheese varieties (Barać et al., 2018; González-Martín et al., 2009; Manuelian et al., 2017). It is also interesting to note that microelements that may be harmful and indicators of environmental or cheese making process contamination such as Cr, Ni and Cd were out of the limit of detection.
Antioxidant properties of Kupres cheese
The effect of ripening on antioxidant properties of Kupres cheese is shown in Table 5. These properties are expressed as a total antioxidant capacity (as % of inhibition of ABTS radicals and as the Trolox equivalent antioxidant capacity) and ferric reducing power.
Table 5. The change of antioxidant properties of Kupres cheese during 3 months of ripening
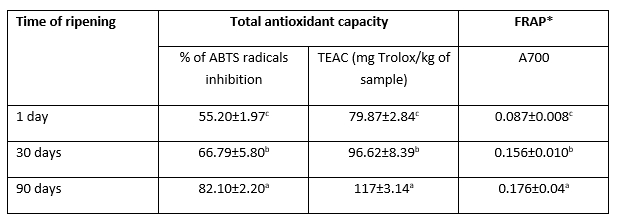
*FRAP - ferric reducing power; TEAC- Trolox equivalent antioxidant capacity; data marked with different letter are significantly different at p<0.05
According to the results presented in Table 5, it is obvious that the ripening process greatly determines the level of antioxidant characteristics of Kupres cheese. Thus, all detected values of TEAC and FRAP were significantly different (p<0.05). The one-day old Kupres cheese had a relatively high ability to scavenge free radicals (55.20±1.97 %) and moderate ferric reducing power (0,087±0,008). The major compounds of cheese responsible for free radicals scavenging and antioxidant properties of cheeses in general are free amino acids, low- and high molecular peptides as well as proteins (Barać et al., 2017). The antioxidant properties of peptides are related to the several abilities: to scavenging or quenching of reactive oxygen species and/or free radicals, to chelate the transition of metal ions, to reduce ferric ions and their ability to inhibit oxidation of lipids, proteins and DNA. These abilities depend of numerous factors including their amino acid sequences, correct position of individual amino acid residues, molecular weight and physical structure, the level of amino acid residues that contain sulfhydryl groups (cysteine and methionine), the level of aromatic residues of tryptophan, tyrosine and phenylalanine, the level of histidine and their hydrophobicity (Yates et al., 2010; Lorenzo et al., 2018; Esfandi et al., 2019).
As it might be expected, both antioxidant properties increased during 3 months of ripening; after three months, the average value of the percentage of ABTS radical’s inhibition increased up to 82.10 % whereas FRAP reached the value of 0.176. In other words, after 3 months of ripening, the total antioxidant capacity increased by 48.73 % and the reducing potential by 102.30 %. Such trends of the analysed antioxidant properties are in a good agreement with the results related to different cheese varieties reported by several authors (Gupta et al., 2007, Meira et al., 2012; Barać et al., 2019, , 2021, Vučić et al.,2020).
The improvement of antioxidant properties of Kupres cheese can be related to the increase of both, WSN and TCA contents (Table 1) and the increased level of peptides with molecular weight higher than 10 kDa, which are characterized with medium antioxidant activity (Pritchard et al. 2010). According to Sbroggio et al. (2016) the improvement of the ABTS free radical scavenging activity of proteins at a higher degree of proteolysis could be attributed to the increase in the electron donating properties of the active peptides. These peptides could react with free radicals to convert them to more stable products and stop the radical chain reaction (Pazzinato et al., 2013). According to SDS-PAGE and densitometric analysis (Figure1 and Figure 2, Table 1) αs-CN has undergone the greatest proteolysis during 90 days. This casein is a good precursor of bioactive peptides including those with antioxidant activity (Barać et al., 2017; Pisanu et al., 2015). Thus, high antioxidant properties of the 90-day-old cheese can be mainly attributed to the products of its degradation.
The detected antioxidant properties of Kupres cheeses must be considered as potential. Namely, antioxidant peptides have to be resistant to further proteolysis during cheese storage, especially during gastrointestinal digestion. In this regard, further studies of in vitro and in vivo stability should be conducted.
Conclusion
The results of this research show that ripening greatly affects protein profiles, fatty acid composition, health lipid indices and antioxidant potential of Kupres cow`s cheese. Ripening of Kupres cheese during three months is characterized by relatively slow proteolysis (especially during first month), by the increase of desirable fatty acid content and other health lipid indices. Three months of ripening reduced the residual level αs-CN and β-CN to 12.02% and 80.96%, respectively. Three-month-old cheese had improved indexes of lipid quality, reducing power and ability to scavenge free radicals. Ripening significantly affected the content of Ca, P and Na, but had no effect on the other macro- and microelements of Kupres cheese.
Acknowledgment
The present work was funded by the Serbian Ministry of Education, Science and Technological Development (Grant no. 451-03-68/2022-14/200116).
Proteinski, masno-kiselinski i mineralni profili te antioksidacijski kapacitet Kupreškog sira u različitim fazama zrenja
Sažetak
Kupreški sir je tradicionalni bosanski punomasni tvrdi sir. U ovom istraživanju praćene su promjene profila proteina i masnih kiselina, udjela mineralnih tvari i antioksidacijskog potencijala tijekom tri mjeseca njegovog zrenja. Proteoliza je praćena elektroforezom ukupnih ekstrakata i frakcija topljivih u vodi u redukcijskim uvjetima, dok su profili masnih kiselina određivani plinskom kromatografijom. Udjel mineralnih tvari u zrelim sirevima određen je metodom induktivno spregnute plazme i optičke emisijske spektrometrije (ICP-OES) koja je korištena za makroelementie, kao i spektrometrijom masa uz induktivno spregnutu plazmu (ICP-MS) koja je korištena za mikroelemente. Zrenje kupreškog sira karakterizira relativno spora proteoliza tijekom prvog mjeseca, povećanje udjela poželjnih masnih kiselina i poboljšanje ostalih zdravstvenih indeksa masnih kiselina. Zrenje također poboljšava ukupni antioksidacijski kapacitet i reducirajuću sposobnost sira. Nakon 30 dana zrenja udjel VSN/TN i TCA/TN raste s 8,23 % i 2,25 % na 10,15 % i 3,59 %. Daljnje je zrenje uzrokovalo intenzivnije povećanje ovih parametara i intenzivniju degradaciju glavnih kazeina, posebno αs-CN. Nakon tri mjeseca zrenja rezidualni nivo αs-CN i β-CN iznosio je 12,02 %, odnosno 80,96 %. Sir koji je dozrijevao tri mjeseca imao je poboljšane indekse kvalitete lipida, kao i poboljšanu redukcijsku moć i sposobnost uklanjanja slobodnih radikala. Zrenje je izazvalo značajne promjene udjela Ca, P i Na, ali nije utjecalo na udjele ostalih makro- i mikroelemenata kupreškog sira.
Ključne riječi: Kupreški sir; zrenje; proteoliza; profil masnih kiselina; mineralne tvari; antioksidacijski kapacitet
References
Gupta, A., Mann, B., Kumar, R., Sangwan, R. (2009). Antioxidant activity of Cheddar cheeses at different stages of ripening. International Journal of Dairy Technology 62, 339-347. https://doi.org/10.1111/j.1471-0307.2009.00509.x
quality indices in hard cow, sheep, and goat cheeses. Foods 9, 1667. https://doi.org/10.3390/foods11010006