
Introduction
Thebiological diversity of an ecosystem is defined by the total number and composition of taxa, genotypes, functional groups and landscape units present (Diaz and Cabido 2001). Favourable relationships among the taxa that make up the ecosystem improve its stability and ability to recover from disturbances. Changes in environmental conditions such as negative anthropogenic impacts (excessive mowing, over-fertilization, deforestation, urbanization, etc.), global warming and succession all lead to biodiversity loss (Perrings et al. 1995, Alhamad 2006). To conserve biodiversity, it is necessary to understand natural processes and sources of stability and the resilience of the communities to these disturbances (Alhamad 2006). One of the problems that arises is the multidimensionality of biodiversity because diversity among taxa can be functional, phylogenetic, genetic and taxonomic. Biodiversity is determined not only by the number of taxa but also by other factors such as species uniformity, diversity and rarity; macroclimate; amount of water and nutrients in the soil; functional diversity and human activity (Willig 2011, Grace et al. 2016).
The most studied pattern is the relationship between biodiversityand plant biomass because these are key factors in predicting the impact of species loss on ecosystem functions and services. These relationships are not yet completely clear and vary depending on the spatial scale of the research, the number of woody plants, the competition among taxa, etc. (Guo and Berry 1998).
The model that claims that biodiversity of herbaceous planttaxa can be predicted based on plant biomass is called the “hump-backed model” (HBM) and it predicts maximum biodiversity at the mean values of biomass. According to this model, the data are presented by quadratic regression (Fraser et al. 2014). At low biomass, the number of taxa is limited by disturbances and stress (extremes in temperature, water or nutrient concentrations in the soil), conditions that only some taxa can tolerate. At high biomass, the number of taxa is limited by mutual competition so only a small number of highly competitive taxa will survive (Fraser et al. 2015).
Previously,there have been only few studies on biomass and functional diversity in European temperate grasslands. Fraser et al. (2015) recorded the biomass of natural grasslands worldwide, showing that it varies from 1 up to 5711 g m-2. Hector et al. (1999) recorded biomass for experimental grasslands in several European countries where average biomass values vary from 336.5 g m-2 in Greece to 802.2 g m-2 in Germany. Schumacher and Roscher (2009) measured biomass in Arrhenatheretalia type grasslands in Germany (Thuringia) ranging from 182 to 592 g m-2. Grace et al. (2016) studied the relationship between biomass and functional diversity at a global scale but did not provide biomass values. On experimental savannah-grasslands, Tilman et al. (1997) recorded biomass ranging from approximately 20 to 180 g m-2.In a study conducted by Grace et al. (2016) the relationship between dry biomass and the number of taxa is negatively correlated, whereas in a study by Fraser et al. (2015) the number of taxa increases until a biomass of about 100 g m-2 is reached, after which, in most cases, it decreases withany further increase in biomass. In contrast, on experimental grasslands (Tilman et al. 1997, Hector et al. 1999) the number of taxa and dry biomass are positively correlated.
Recently, research into the effect of biomass and the numberof taxa on biodiversity is less frequent in published papers, whereas a growing importance is attributed to the dominant taxa and the composition of functional traits and functional diversity in determining species richness, community productivity and processes of ecosystem (Diaz and Cabido 2001, Tredennick et al. 2016). Some scientists claim that the value and range of functional traits define the interactions of taxa and the functioning of an ecosystem better than the actual richness of species (Tilman et al. 1997, Lepš et al. 2006, Cadotte et al. 2009, Van’t Veen et al. 2020).
Functional traits are the morphological, physiological and phenological attributes of plants measured at the level of cells, organs, or organism (Violle et al. 2007). They develop as an adaptation to environmental conditions, and, because of their ability to absorb the resources provided by the ecosystem, enable successful survival and reproduction of plants (Lepš et al. 2006). Functional traits of individual taxa are similar, but vary depending on environmental conditions, which makes them good indicators of the state of the ecosystem (Lepš et al. 2006). Functional diversity is defined by the range and value of functional traits. It is one of the components of biodiversity and as such affects the balance of nutrients in the soil, vegetation resistance and dynamics, stability and productivity of the ecosystem. In cases of f luctuations and disturbances greater functional diversity increases ecosystem stability because more numerous taxa provide a greater range of functional traits, which vary in their responses to different environmental conditions, thus making resource use more efficient (Diaz and Cabido 2001, Tilman 2001). The relationship between species richness and functional diversity of natural grasslands is still quite unexplored. The assumption is that the more favourable the habitat conditions for plant growth, the more plantswill be present because they will differ in adaptations for absorbing available resources, and these adaptations are quantified by functional trait values. Therefore, greater diversity of functional traits generally implies a larger number of taxa in the community and vice versa (Diaz and Cabido 2001).
Grassland productivity/biomass research is scarce for Croatia, and has mostly been conducted from the agricultural perspectives and so focused only on yield, i.e., biomass. The aim of this research was to determine the relationship between plant biomass, functional diversity and taxonomic diversity using quantitative analysis and floristic data.
Material and methods
The research area was the city of Zagreb, which is in the northwestern part of Croatia. Although surrounded by hills, most of the area of the city is located in the valley of the Sava river where the soil is dominated by sand, clay and loam (Anonymous 2008). The climate of the Zagreb area belongs to the Cfa climate type, according to Köppen’s climate classification. It is a moderately warm humid climate with relatively mild winters, warm summers and no extremely dry periods. Maximum precipitation occurs at the beginning of the warm part of the year and during late autumn (Šegota and Filipčić 2003). The average annual temperature is 11.4 °C and the average annual precipitation is 844 mm/m2 (Nikolić and Kovačić2008).
The climazonal vegetation of the entire northwestern part of Croatia is forest, but, due to vegetation clearing to obtain pastures and arable land, forest now makes up only a third of the area. Forests now predominate in elevated areas where agricultural development was not possible due to steep terrain (Stančić 2000). Grassland communities occupy a third of the area of northwestern Croatia and are used for mowing and grazing. Most grasslands at low and midaltitudes, along watercourses and on fertile, deep and mostly moist soils developed into communities of the Molinio-Arrhenatheretea Tx. 1937 class. A smaller number of grasslands consist of dry grasslands of the Festuco-Brometea Br.-Bl. et Tx. ex Soo 1947 class which develop only on dry upland basophilic ground (Stančić 2000, Nikolić 2020).
The research was conducted at the peak of the vegetation season in June and July 2020 at eight different sites within the city of Zagreb (Tab. 1,Fig. 1). Criteria for locality selection were presence of grassland vegetation, homogenous vegetation cover on an area between 25 and 100 m2 and peak biomass of vegetation. Methodology used was adapted according to Alhamad (2006) and Schumacher and Roscher (2009). On each locality two 1 m2 plots were randomly selected and divided into four equal smaller squares of 0.25 m2. Biomass was collected within two diagonally placed smaller squares, therefore, on a total of 0.5 m2 area due to the small capacity of the dryer in the laboratory. We collected the biomass by cutting the above ground vegetation and storing it in paper bags. Biomass was weighed before and after drying at 70 °C for 72 hours.

All vascular plant taxa present at the locality within the plots and outside the plots were recorded. The number of taxa within a 1 m2 plot is expressed as the number of taxa perplot. The number of taxa within both plots of one locality and outside the plots, but within the existing grassland vegetation, is expressed as the number of taxa per locality. Some of the taxa were identified in the field, and some were collected, pressed and dried in order to be identified or additionally confirmed. To avoid reduction in the final measure of biomass, subsequently identified individuals were collected either within the plot from smaller squares on which biomass was not collected or from the nearby area surrounding the plot. For plant taxa identification Excursion Flora by Nikolić (2019) was used, sometimes supplemented with additional identification keys and iconographies (Jávorka and Csapody 1991, Domac 2002, Eggenberg and Möhl 2007, Rothmaler and Jäger 2007). Nomenclature was given according to Flora Croatica Database (Nikolić 2020). The vegetation type was determined according to Stančić (2000) and Nikolić (2020).
Taxa determined at the genus level are not included in the analyses due to the impossibility of associating accompanying floristic data. Life-form, origin, Ellenberg ecological indicator values and functional trait values were attributed to each species of the checklist. Data used in the preparation of the life-form spectrum were given according to the LEDA database (Kleyer et al. 2008) and Flora Indicativa (Landolt et al. 2010), and for doubtful taxa according to the Flora Croatica Database (Nikolić 2020). Species origin was standardized according to BiolFlor (Klotz et al. 2002) database and Flora Indicativa (Landolt et al. 2010), while the invasiveness status in Croatia was given according to Flora Croatica Database (Nikolić 2020). Origin data were divided into the following four categories: Au – autochthonous taxa, Ar – archeophytes, Ne – neophytes, and In – invasive alien taxa. Data on ecological indicator values were obtained from Ellenberg et al. (1992), Borhidi (1995), Pignatti et al. (2005) and Landolt et al. (2010). For each locality and plot the most frequent values were calculated for the following environmental variables: L – light, M – moisture, N – nutrients, R – reaction, S – salinity and T – temperature. Functional trait values were given according to the LEDA database (Kleyer et al. 2008) for seed mass, leaf dry matter content (LDMC), specific leaf area (SLA) and plant height.
The functional trait values distribution test was performed in the Statistica 13.3.0 (TIBCO Software Inc. 2017). In the case of the non-normal distribution, a logarithmic transformation was performed followed by another distribution test. Using normally distributed functional traits the functional diversity index was calculated in the program CANOCO 5 (Šmilauer and Lepš 2014), defined as (Lepš et al. 2006):
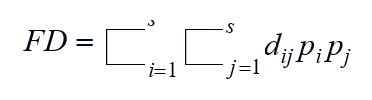
where s is the number of species in the community, pi and pj are the relative abundance of species i and j, and dij describes the functional dissimilarity between species i and j.
The weighed values of fresh and dried biomass were doubled to represent the biomass per 1 m2 inorder to enable a straightforward comparison with the literature, in which it is usually expressed per 1 m2. Using weighed values, the percentage of dry biomass in the individual plots was calculated as well. The linear correlation between the measured variables was tested using the Pearson correlation coefficient (with the significance level P < 0.05). Correlation analysis was performed and graphically represented in Statistica 13.3.0 (TIBCO Software Inc. 2017).
Results
Altogether 100 taxa (seven identified to the genus level, 92 species and one subspecies) were recorded in the flora of researched area (Tab. 2). Based on the recorded taxa, two classes of grassland vegetation were identified. Taxonomic composition at locality 1 indicates the presence of Bromion erectiKoch 1926 alliance belonging to the Festuco-Brometea class, while at all other localities’ vegetation belongs to the Arrhenatheretum elatioris association belonging to the Molinio-Arrhenathereteaclass.
Regarding life-form spectrum, hemicryptophytes dominate on every locality, while other life-forms vary depending on the locality and plot. At locality 5, only hemicryptophytes were recorded. An increased share of chamaephytes was recorded on the plots of site 1, and of therophytes on the plots of site 3. Phanerophytes are represented by only two species, both present with a small number of individuals (Fig. 2).

Vegetation consists largely of autochthonous plants. Among the 13 allochthonous taxa recorded, he most frequent are archaeophytes. Neophytes are represented by two species: Anthyllis vulneraria L. and Loliummultiflorum Lam. with L. multiflorum Lam. comprising a significant part of the vegetation of both plots on the site 3. Invasive alien taxa are also represented by two species: Erigeron annuus(L.) Desf. which was recorded on both plots of sites 3, 6 and 8 and on one plot of site 4 and Echinocystislobata outside the plots at site 2 (Fig. 3).
Accordingto the analysis of Ellenberg ecological indicator values most of the studied area is dominated by half-light plants. Locality 1 differs from others given the lower indicator values for moisture and nutrients and higher values for reaction. Other localities have higher values for moisture or nutrients, and the reaction is lower, corresponding to the more acidic soil in the Sava valley (Tab. 3).

The highest functional diversity index was calculated for localities 1, 2 and 8 and for plots 7.1, 8.1 and 8.2; while the lowest functional diversity was recorded for locality 5 and its associated plot 5.2 (Tab. 4).
The highest values of fresh biomass were recorded on localities 3 and 5, and of dry biomass on locality 6. Fresh biomass is the lowest on plots of localities 1 and 4, while the minimum of dry biomass was recorded on plots of locality 4. The largest dry biomass share belongs to the vegetation oflocality 1, whereas the lowest share is in the vegetation of locality 3. The taxonomically richest grasslands were on localities 2 and 4, while the poorest was recorded on locality 5 (Tab. 4).
Our results show that fresh biomass and the number of taxa are negatively correlated, while the correlations of dry biomass and percentages of dry biomass with the number of taxa are not shown as they are not statistically significant. A statistically significant positive correlation between the number of taxa and functional diversity was recorded. Therefore, the greater the number of taxa, the greater the functional diversity. Functional diversity is negatively correlated with fresh biomass and positively with the percentage of dry biomass, but it is not correlated with dry biomass. Although neither dry nor fresh biomass correlated with the mean values of functional traits, the calculation proved a statistically significant positive correlation between the percentage of dry biomass and LDMC. Also, there is a positive correlation between the mean values of LDMC and the number of taxa (r = 0.5617, P = 0.024) and a negative correlation between the mean values of SLA and the number of taxa (Fig. 4).

Discussion
Plantbiomass is associated to grassland vegetation type. Grasslands of the Molinio-Arrhenatheretea class develop at low to medium altitudes, and near watercourses, which is why they are the most productive grasslands of temperate Europe. For this reason, they are used as fodder for cattle, and, to additionally increase their biomass, are often fertilized. The plant biomass of dry grassland of the Festuco-Brometea class at locality 1 is lower due to more extreme conditions such as nutrient low substrate and lower temperatures.
The dominance of hemicryptophytes in the vegetation cover was expected given the temperate climate of the study area (Horvat 1949). The main cause for the high share of chamaephytes at locality 1 is the vegetation type (Festuco-Brometea) since low shrubs, which better tolerate cold, drought and a small amount of nutrients in the soil thrive better in such communities (Horvat 1949). The presence of phanerophytes is most likely due to dispersion from the nearby forests. It is expected that locality 3, which is closest to the city centre, is under the greatest anthropogenic influence. Anthropogenic activity is a cause of disturbances and in such conditions annual plants with high seed productivity, such as therophytes, thrive best.
The high share of autochthonous taxa in the study area indicatesa still relatively weak anthropogenic influence and habitat stability. Even though they make up a relatively small share in the composition of taxa, the presence of neophytes Lolium multiflorum Lam. and the invasive Erigeron annuus (L.) Desf. should be emphasized because, in addition to being quite numerous they are robust plants and therefore make up a significant part of the plant biomass. In addition, due to their exceptional ability of colonization they represent a potential threat to future ecosystem stability.
Ecological indicator values for light indicate most plants recorded at the localities grow in habitats frequently exposed to sunlight, for the researched area consists of open habitats such as grasslands. Other values such as moisture, nutrients and reaction vary according to different management type, soil type, geographical position, slope, proximity to water and so on. Therefore, the observed variations in plant indicator values reflect the environmental conditions of the different types of grasslands. At locality 1, the ecological indicator values of the belonging taxa indicate the presence of dry and basophilic grassland of the Festuco-Brometea class. Values calculated for other localities are characteristic for grasslands of Molinio-Arrhenatheretea class which grow at medium to low altitudes on more acidic soils near watercourses.
Planttaxa were recorded only once, in the fieldwork before the vegetation was cut, thus those taxa that appear earlier or later in the growing season are not included in the research. This resulted in a smaller number than the expected approximate amount of 37 taxa per locality as found by Stančić (2000), who used the relevé method, which can include multiple field visits during the season.
In this research, a statistically significant negative correlationbetween biomass and the number of taxa coincided with the results of Fraser et al. (2015) and Grace et al. (2016) but was obtained only with fresh biomass. The reason for this is the much larger range of fresh biomass values compared to the values of dry biomass, while the small range of dry biomass values is a consequence of one dominant grassland type with uniform life forms. For the results to coincide with those of Fraser et al. (2015) and Grace et al. (2016), the research should be further extended to different types of grasslands, which would increase the range of values of both species and dry biomass.
A positive correlation between the number of taxa and drybiomass on experimental grasslands in a study conducted by Tilman et al. (1997) is most probably a consequence of the low biomass which, according to the “hump-backed” model by Fraser et al. (2014), at these values, increases with increasing number of taxa. A positive correlation was also obtained in a research by Hector et al. (1999) where the values of biomass are higher. A possible explanation for such results is a different composition of vegetation on experimental grasslands as it was created by random selection of taxa while the impact on them is minimal because environmental factors are uniform. That means that the vegetation composition on experimental grasslands is not conditioned by long-term impact of abiotic and biotic factors. Such research should be re-conducted in the context of natural grassland ecosystems so, for each community, the characteristic environmental factors influencing the vegetation and the properties of the vegetation influencing the environmental factors could be considered.
In this research, the number of taxa is generally lower on localities with higher biomass. This may be due to disturbances such as human activities because anthropogenic habitats usually have more fertile soils which enable faster growth and higher habitus of plants. Larger plants overshadow the smaller ones and thus prevent their germination resulting in dominance of several larger taxa (Grace et al. 2016). The plots of locality 5 are dominated by few large plant taxa that overshadow the smaller plants, resulting in a reduction of the number of taxa to only 8 and 12 per plot. Furthermore, the invasive taxon Erigeronannuus (L.) Desf. on localities 3, 6 and 8 is a possible cause of high biomass and a small number of taxa due to its large habitus and the ability successfully to colonize disturbed habitats. Habitats exposed to constant disturbance are less stable and more susceptible to colonization by invasive species which also modify habitat conditions by increasing the amount of nutrients in the soil (Wu et al. 2018). The highest biomass recorded on the plots of locality 3 could be a possible consequence of the large number of legumes (Fabaceae) which enrich the soil with nutrients by fixing atmospheric nitrogen, which then increases the growth of all plants on a locality.
The positive correlation between the number of taxa and the functional diversity coincides with the theory that in favourable conditions plant species differ more from each other according to their functional traits that allow them to make better use of the available resources. Therefore, a greater diversity of functional traits, in most cases, including grasslands, means a greater number of taxa in the community.
The relationship found here between fresh biomass and functional diversity is expected given the previously presented results because the number of taxa decreases as biomass increases and is positively correlated with functional diversity. Thus, functional diversity also decreases as biomass increases. The reason is that biomass is generally higher in habitats with a few dominant taxa possessing a greater number of similar functional traits. However, the results of other research do not coincide with our results. Tilman et al. (1997) and Zhang et al. (2016) investigated dry grasslands, savannah, and Mongolian steppes, respectively. Drought conditions are better tolerated by grassland plants with a greater number of similar functional trait values (e.g. lower SLA reduces transpiration, lower plant height due to insufficient water), which means that the functional diversity on dry grasslands is lower than on mesic and wet grasslands. Also, dry grasslands have a lower biomass, so, given the “hump-backed” model, it is to be expected that the increase in biomass will be accompanied by an increase in the number of taxa, and accordingly by an increase in the value of functional diversity. A study on European grasslands conducted by Petchey et al. (2004) is not comparable because it took as its subject an experimental grassland with a manipulated composition of taxa. This means that the vegetation composition was not a result of natural processes and that the functional traits of the associated taxa did not develop as a result of long-term effects of biotic and abiotic factors on the habitat.
Positive correlations of the percentage of dry biomass with functional diversity and LDMC are associated, given that both the percentage of dry biomass and LDMC express the ratio of the mass of dry and fresh (water-saturated), plant material. The percentage of dry biomass expresses the average density of plant tissue which indicates higher soil fertility, i. e. high concentrations of nitrogen in the soil (Hodgson et al. 2011). Therefore, the more favourable the habitat conditions, the greater the functional and taxonomic diversity. The reciprocal function of LDMC is the SLA (Hodgson et al. 2011). Thus, as the number of taxa increases with increasing LDMC then it is to be expected that the number of taxa will decrease with increasing SLA. The reason for this is that leaves with a large surface area overshadow the plants growing beneath them and in this way prevent their growth and germination. Such a situation was recorded at locality 5, where the highest value of SLA and the lowest number of taxa were recorded.
The most stable habitat in this research is locality 2 because it has one of the highest functional diversity indices and the highest taxonomic diversity, composed of exclusively autochthonous taxa. Also, the ecological indicator values reflect the environmental conditions of the area and do not show any extremes. Localities 1 and 7 also emerge as some of the more stable grasslands whose composition of life-forms and ecological indicator values describe well the characteristics of the belonging vegetation communities. Th high functional and taxonomic diversity at both localities confirm that these are undisturbed habitats without the dominance of a few aggressive taxa.
Themost unstable habitat is locality 3, which, despite its high taxonomic diversity, has one of the lowest values of functional diversity. It also has the smallest share of autochthonous taxaand the maximum share of allochthonous taxa with invasive alien taxa on both plots, which, together with a large share of therophytes indicate a ruderal habitat. Unlike locality 3, locality 5 is yet unstable because of its low both taxonomic and functional diversity. Even though it does not contain any invasive alien taxa, the anthropogenic impact on the habitat is expressed in the larger proportion of thermophilic plants, which is due to the proximity of the city and the increased anthropogenic impact. Such an impact resulted in the dominance of several competitive taxa (Centaurea macroptilon Borbás, Lolium perenne L., Medicagosativa L., Trifolium pratense L.), which caused the biomass of plot 5 to be one of the highest measured.
The sampled grasslands contain a relatively large number of taxa and a high share of indigenous plants, indicating their favourable status. However, the consequences of anthropogenic impact and colonization by invasive taxa due to expansion of urban areas and habitat fragmentation are noticed. Hence, more extensive sampling should be done in order to be able to fully evaluate grasslands of the Zagreb area in terms of their condition with respect to their habitat preservation status. Biodiversity and biomass have been proved to be good indicators of grassland conditions, although their relationships are not fully defined yet and differ according to different research areas. Therefore, it is necessary to conduct this type of research in other grassland communities in Croatia to obtain more general insights into the relations of these parameters.