
Introduction
Many scientists agree that we are currently living in the Anthropocene era, a new geological epoch brought about by human activity. Climate changes have led to a deterioration of the hydrological characteristics of aquatic ecosystems due to global temperature increase and a decrease in precipitation and runoff, especially in the Mediterranean region (Cudennec et al. 2007). Agricultural intensification and urbanization contribute to excessive nutrient inputs to aquatic ecosystems, triggering the phenomenon of eutrophication. Anthropogenic phosphorus and nitrogen inputs induce a series of biological processes such as proliferation of primary producers, toxicity and/or anoxia, and biodiversity loss (Hupfer and Hilt 2008). The primary producer compartment is the first to be affected in the eutrophication process. Enhancedprimary producer biomass has an effect on each element of the trophic network with consequences for biogeochemical cycles, community dynamics, ultimately impacting the evolution of aquatic ecosystems (Pinay et al. 2017). Phytoplankton are dominant primary producers responsible for organic matter production in lakes, especially in the pelagic zone, and the basis of the food web. The effects of eutrophication occur as an increasing abundance in phytoplankton biomass and greater turbidity in the water column. Further changes in the phytoplankton assemblage include a change in the taxonomic composition, excessive development of filamentous and aggregate-forming algal taxa, which leads to reduced depth of colonization by macrophytes and even their complete withdrawal when light becomes the limiting factor. Karst lakes are particularly sensitive to the elements that enhance eutrophication such as excess of nutrient inputs, prolongued water residence time, sufficient light, and favorable temperatures (Wiik et al. 2014). Therefore, a targeted use of suitable water quality indices and eutrophication indicators in monitoring purposes (e.g., Hanžek et al. 2021) is of great importance for the future conservation and management of karst habitats.
TheWater Framework Directive (WFD 2000/60/EC) introduced a comprehensive ecological status assessment of all surface waters based on biological, hydromorphological, chemical and physico-chemical quality elements. Following the requirements of WFD, each member state has established methods for assessing ecological status based on biological quality element phytoplankton taking into account biomass or abundance, composition, frequency and intensity of blooms (Søndergaard et al. 2011). As a means of ensuring all member states implement the Directive in a consistent manner, the WFD made the employment of intercalibration exercises a condition, with the goal of harmonising divergent national approaches. These exercises would then ensure a consistent approach in harmonising ecological assessment systems and a consistent level of ambition in the protection and restoration of surface water bodies across the EU (Kelly et al. 2014). Situated in the Dinaric Ecoregion, all natural lakes in Croatia are classified according to a national typology (Official Gazette 2019), in which each lake is considered a distinct type due to various climatic, hydrological, morphological and geological specificities. Since there are no common intercalibration types for natural lakes in the Eastern Continental Geographical Intercalibration Group (EC-GIG) and Mediterranean Geographical Intercalibration Group (MED-GIG), the implementation of an intercalibration exercise for Croatian lakes was not feasible. However, in 2019 the Croatian water management agency and partners decided to classify the ecological quality of natural lakes using the Hungarian classification method for lake phytoplankton assessment, which was intercalibrated for the lakes within the EC-GIG (Borics et al. 2018), with some adaptations from the MED-GIG (de Hoyos et al. 2014). The outcome of this process was the official report on the Croatian lake phytoplankton classification, which declared that the present Croatian assessment method of the ecological status of lakes based on phytoplankton is compliant with the WFD normative definitions and has good pressure-impact relationship.
Theaims of this paper are to assess: 1) the ecological status of a karst lake using phytoplankton and supportive physico-chemical parameters, 2) trophic status based on eutrophication status and impact indicators, and 3) the viability of proposed metrics to be used in the standard regulatory monitoring procedure. We also aim to revise the use of chlorophyll-a (Chl-a) concentration as an adequate bioindicator in highly sensitive karst aquatic systems.
Material and methods
Study area
The Krka River is a 72.5 km long karstic river situated in the central part of the eastern Adriatic coast in Croatia. It rises near the town of Knin, at the base of Dinara Mountain (South Croatia). The course of the Krka River is characterized by tufa deposits forming barrages and cascades, which cause the water to change flow and speed with alternating lotic and lentic parts. Lake Visovac is the largest lake (volume of 103 × 106 m3,area of 5.72 km2,mean depth 18 m, max. depth 28 m) belonging to the lentic part of the Krka River hydrosystem. It was formed in the post-Würm period with the formation of Skradinski Buk, the final and the largest tufa barrier. According to the national typology it is a lowland lake of medium size and medium depth on carbonate substrate, belonging to lake type HR-J_5 (Official Gazette 2019). Krka was mostly studied in the past in the context of the exploitation of its hydropower potential, water supply, aquaculture and irrigation.
Sampling
Samplingwas conducted during the years 2016 and 2019 on a monthly basis from April to September. Samples were collected at a designated monitoring site in the limnetic zone of the Lake. Physical and chemical parameters including water temperature, pH, conductivity and oxygen concentration were measured in situ with WTW MultiLine P4 (WTW, Germany) and Hach HQ40d (HACH, United States) multimeters in 2016, and a YSI EXO2 (Xylem Inc., United States) multimeter in 2019. Water column transparency (ZSD) was determined with a Secchi disc and used for the calculation of euphotic zone depth (Zeu) with a standardized factor (2.5 × Secchi depth) for Mediterranean geographical region. The vertical Hydro-bios sampler (Hydro-Bios Apparatebau Gmbh, Germany) was used to collect integrated water samples from the calculated euphotic zone. Samples for chemical analysis of water were collected with the phytoplankton samples and stored at -20 °C until laboratory processing. Chemical analysis of the water included quantification of total phosphorus (TP), nitrite (NO -), nitrate (NO -), ammonium (NH4+) and total nitrogen (TN) using the ISO (International Organization for Standardization) standardized methods(HRN EN ISO/IEC 17025: 2017). Immediately after being taken, samples for Chl-a analysis (1 L) were filtered through 0.45 µm pore Whatman GF/F filters (Sigma Aldrich, UK) and frozen at –80 °C until further processing. From the samples in 2016, Chl-a was extracted with aqueous acetone solution and measured by the Prominence-i LC-2030C highperformance liquid chromatograph (Shimadzu, Japan), whereas in 2019 the extraction was done using 96% ethanol and measurements by Specord 40 UV-VIS spectrophotometer (Analytik Jena Gmbh, Germany).
Phytoplanktonsamples were placed into 250 mL volume plastic bottles and preserved in a 2% final concentration formaldehyde solution (samples from 2016) or with the addition of 13 to 15 drops of Lugol’s solution (samples from 2019) and were stored in the dark at 4 °C. Phytoplankton biomass was determined according to Utermöhl method (Utermöhl 1958) using a Zeiss AxioVert inverted microscope equipped with an AxioCam MRc camera (Carl Zeiss Microscopy Gmbh, Germany). Species identification was performed using relevant taxonomic literature. Nomenclature and classification of taxa were according to AlgaeBase (Guiry and Guiry 2022).
Images of species were processed using the program AxioVision LE 4.8 (Carl Zeiss Microscopy Gmbh, Germany). The species were allocated into appropriate functional groups (FGs or coda) following the relevant literature (Reynolds et al. 2002, Padisák et al. 2009).
Statistical analyses, assessment of ecological status and trophic status
Ecological status was evaluated using the Hungarian LakePhytoplankton Index (HLPI) (Borics et al. 2018). HLPI is a combination of normalized Ecological Quality Ratio (EQR) values of two metric indices using the following formula
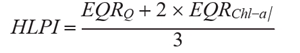
where: EQRQ – normalized EQR of the composition metric based on functional groups,
EQRChl-a – normalized EQR of the biomass (Chl-a metric).
In order to convert Chl-a into normalized EQRChl-athe following formula was used:
Chl-a ≤ 5.3; EQRChl-a = 0.0074x2 – 0.1149x + 1
Chl-a > 5.3; EQRChl-a = 0.00005x2 – 0.0118x + 0.6617
where: x – Chl-a concentration (µg L-1).
The applied HLPI is based on the Q index or “Assemblage index” (Padisák et al. 2006). The factor numbers were assigned according to the operational list of taxa included in the national methodology (Croatian Waters 2016). Qk index is calculated using following formula:
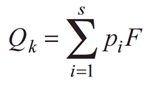
where:
pi– relativecontribution of the i-th functional group to the total biomass,
F – factor number established for the i-th functional group in the given lake type.
Qk index is then standardized (Qk_stand) by dividing the given value with maximum value of the index (9). This value was normalized by a following 3rd order polynomial regression formula for this lake group (Hanžek et al. 2021):
y = -2e-13x3 – 9e-14x2 + 0.9756x – 8e-14
where:
x – Qk_stand.
We used water transparency, expressed as Secchi depth, and nutrient concentrations as supportive physico-chemical parameters to assess ecological status following class boundaries prescribed in the national legislation (Official Gazette 2019), shown in On-line Suppl. Tab. 1. Assessment of the trophic status was based on eutrophication indicators adapted from Ibisch et al. (2016). We applied status indicators (nutrient concentrations) and impact indicators (Secchi depth, Chl-a concentration and phytoplankton biomass). We used widely accepted boundary values suggested by the Organization for Economic Cooperation and Development (OECD 1982) and class boundaries for phytoplankton biomass (Brettum 1989), which are shown in On-line Suppl. Tab. 2.
We compared the ecological and trophic status of Lake Visovac based on the analysis of phytoplankton community and the response of HLPI index to environmental variables. The computer program PRIMER v7 for Windows (Clarke and Gorley 2015) was utilised for the calculation of the principal component analysis (PCA). Statistica 13 (TIBCO Software Inc., USA) was used to calculate Spearman’s rank correlation between physical and chemical parameters, HLPI and Chl-a. The relationship between the phytoplankton assemblages and environmental variables was explored using canonical correspondence analysis (CCA) in Canoco 5 (Šmilauer and Lepš 2014). Graphical charts were created in Microsoft Excel for Microsoft 365 (Microsoft Corporation, USA).
Results
Physico-chemical parameters
The environmental variables of water measured at the designated monitoring site are presented in On-line Suppl. Tab. 3. The highest O2was recorded in April 2016 (11.00 mg L-1) andthe lowest in August 2019 and September 2019 (6.85 and 5.35 mg L-1, respectively). Minimum water temperature was 13.8 °C (April 2019) and maximum 24 °C (July 2016). Secchi depth ranged from 3 m to 9 m (in July 2019 and May 2019, respectively). The lowest pH (7.79) was recorded in June 2019, and the highest (8.51) in April 2016. The electrical conductivity of water ranged from a minimum of 413 µS cm-1 inJune 2019 to a maximum of 558 µS cm-1 inSeptember 2016. TP ranged from the lowest in September 2016 (0.001 mg L-1) tothe highest in April 2019 (0.072 mg L-1). The highest NO3- was measured in May 2016 (0.302 mg L-1) and the lowest in July 2019 (0.034 mg L-1). NO2 ranged from 0.001 mg L-1 (in April,May and June 2019) to 0.137 mg L-1(September 2016). The concentration of NH4+ varied from the lowest in June 2019 (0.004 mg L-1) tothe highest in May 2016 (0.809 mg L-1). The highest TN (0.753 mg L-1) was measured in June 2016, and the lowest (0.180 mg L-1) in July2019.
Principal component analysis (PCA) performed for the 10 environmental variables explained 67.2% of the total variance on the first two PC axes (On-line Suppl. Tab. 4). The most important parameters for the PCA axis 1 were electrical conductivity and NO2 (intra-set correlations: -0.466 and -0.436, respectively). Regarding axis 2, O2, Secchi depth and temperature were the variables that weighted most for ordination (intra-set correlations: 0.476, 0.474 and -0.433, respectively). PCAarranged samples (Fig. 1) into two groups: the first group consisted of samples from 2016 and the second group included samples from 2019. Within each year, samples were further distributed into spring (April, May and June) and summer (June, July and September).

Phytoplankton community
The main descriptive phytoplankton species from the samples of 2016 was the centric diatom Pantocsekiella ocellata (Pantocsek) K.T.Kiss& E.Ács. Otherdescriptivespecies included the pennate diatom Asterionella formosa Hassall, cryptophyte Plagioselmis nannoplanctica (H.Skuja) G.Novarino, I.A.N.Lucas & S.Morrall, chlorophytes Ankistrodesmus spiralis (W.B.Turner) Lemmermann, Tetraselmis cordiformis (N.Carter) Stein and Tetrastrum triangulare (Chodat) Komárek, as well as Ceratium hirundinella (O.F.Müller) Dujardin and Parvodinium inconspicuum (Lemmermann) Carty from the group Miozoa. April 2016 was characterized by the absolute dominance of Bacillariophyta with 97% of the total phytoplankton biomass (Fig. 2A). In May 2016 Bacillariophyta continued to dominate the phytoplankton biomass (71%) with Chlorophyta emerging as a subdominant group (27%). The biomass proportion of Bacillariophyta sharply decreased during June 2016 (to 26%), making this group subdominant to Ochrophyta (36%) and Chlorophyta (33%). During July 2016 Miozoa (46%) and Bacillariophyta (29%) were the main groups characterizing the community. In August 2016 Bacillariophyta was again the most dominant group (56%), with Chlorophyta (20%) and Ochrophyta (19%) as subdominant. Miozoa (44%) and Bacillariophyta (32%) dominated in September 2016.
The main descriptive species in 2019 were Ceratium hirundinellafrom the group Miozoa and the centric diatom Pantocsekiellaocellata. Other descriptive species were cryptophytes Cryptomonassp. and Plagioselmisnannoplanctica, pennate diatom Asterionella formosa and Parvodinium inconspicuum from the group Miozoa. In April 2019 Bacillariophyta dominated the assemblage with 86% of the total phytoplankton biomass (Fig. 2A). May 2019 was characterized by a switch in dominance from Bacillariophyta (20%) to Miozoa (66%). Miozoa continued to dominate during June 2019 with Cryptophyta supplanting diatoms as a subdominant group (with 59% and 31% of the total phytoplankton biomass, respectively). Bacillariophyta (47%) and Cryptophyta (35%) were the most represented groups during July 2019. During August and September 2019, Miozoa contributed most to the total phytoplankton biomass (at 55% and 64%, respectively), whilst Bacillariophyta remained subdominant (at 27% and 21%, respectively).
Apriland May 2016 were characterized by the functional group C, which clearly dominated the assemblage with 82% and 61% of the total phytoplankton biomass, respectively (Fig. 2B). Codon MPappeared as a subdominant during April (12%), further declining in May (8%) and being replaced by associations X2 and F as subdominant groups (with 18% and 11% of the total phytoplankton biomass, respectively). DuringJune 2016 the functional group X2 demonstrated the highest biomass increase and assumed domination (55%), the codon C becoming subdominant (33%). During July 2016 it was replaced by the associations LOand C (with 49% and 23% of the total phytoplankton biomass, respectively). Functional group C again became the most dominant (59%) in August 2016, followed by codon X2 (27%). The descriptive functional groups in September 2016 were LOand C (46% and 30% of the total phytoplankton biomass, respectively).

During April 2019 functional group C dominated the assemblage with 78% of the total phytoplankton biomass (Fig. 2B). Relative biomass of codon C considerably decreased during May 2019 (to 17%), whilst codon LOappeared as dominant (66%). Functional group LOcontinued to dominate during June 2019 (59%) followed by codon X2 (32%). During July 2019 group Cagain became the most dominant, whilst codon X2 remained subdominant (with 46% and 38% of the total phytoplankton biomass, respectively). In August and September 2019 the functional group LOtook over domination (with 55% and 64% of the total phytoplankton biomass, respectively), whilst functional group C became subdominant (with 25% and 18% of the total phytoplankton biomass, respectively).
The correlation between measured environmental variables and biomass of phytoplankton functional groups was explored using CCA (Fig. 3, On-line Suppl. Tab. 5). Total variation was 0.3188, explanatory variables accounted for 97.7% (adjusted explained variation was 74.6%). Monte Carlo permutation test confirmed the significance of CCA model (pseudo-F = 4.2, P = 0.026). The eigenvalues of Axes 1 and 2 were 0.1044 and 0.0695, and accounted for 32.76% and 54.55% of explained variation, respectively (On-line Suppl. Tab. 5). The first axis was mostly explained by Secchi depth, TN and NO2-. The second axis was mainly described by O2, NO3- and NH4+ and TP (Fig. 3). Most of the coda were positioned in the center of CCA ordination. Group N, which occured only in June 2016, was singled out. Coda E, LO, X1and X3correlated mainly to temperature and NO2-. Associations PandKwere located together with samples from September 2016, August 2019 and September 2019 and related negatively to Secchi disc and O2. Functional group Jcorrelated negatively to O2. Codon D and the sample from April 2016 were related to pH and electrical conductivity. Groups C and MP correlated to TP. Samples from April 2019 and May 2016 were related to NO3-. Codon F and samples from July 2016, August 2016 and May 2019 mainly correlated to O2, NO3- and NH4+. Group X2 and samples from June 2019 and July 2019 were related to Secchi depth and TN.

Lake ecological status based on HLPI index and nitrate concentration
In 2016 the HLPI index ranged from 0.69 (September) to 0.80 (June) and in 2019 from 0.70 (September) to 0.82 (May). Based on the HLPI metric, Lake Visovac was in Good ecological status, except in June 2016 and May 2019 when it was High (Fig. 4). Mean annual NO3- varied from 0.21 mg L-1 in 2016 to 0.13 mg L-1 in 2019. According to nitrates, the ecological status of Lake Visovac was High, except in May and August 2016 when its status was assessed as Good (Fig. 4).

Lake trophic status based on eutrophication status indicators
Themean annual TP in 2016 was 0.008 mg L-1,whilst in 2019 it was 0.033 mg L-1. In 2016 Lake Visovac was mostly within the limits of mesotrophic status, except in May and September, when it was classified as ultra-oligotrophic (Fig. 5). During 2019, the lake trophic status was characterized as mesotrophic, except for April when it was assessed as eutrophic. The ecological status of Lake Visovac in 2016 was High, whilst in 2019 it was mostly in Good ecological status apart from April when the lake inclined towards Moderate ecological status.

Eutrophication impact indicators
The mean annual Secchi depth in 2016 was 5.50 m, whilst in 2019 it was 5.70 m. During 2016 Lake Visovac was mostly within the limits of mesotrophic status, except for oligotrophic conditions recorded in June (Fig. 6). The trophic status of Visovac during 2019 shifted from oligotrophic (April and May) towards mesotrophic (June, August and September), reaching eutrophic condition only in July (Fig. 6). According to Secchi depth, Lake Visovac was mostly in High ecological status, except in September 2016 and July 2019 when it was in Good ecological status.
Thelowest Chl-ain Lake Visovac was measured in April 2016 and 2019, and the highest values were detected in September 2016 and 2019 (Fig. 7). During the spring months of bothinvestigated years (April, May and June) Lake Visovac was in the limits of oligotrophic status, whilst in summer period (from July to September) it was in mesotrophic status. Total phytoplankton biomass in 2016 (Fig. 7) ranged from 0.18 mg L-1 to 0.71 mg L-1(in June and July, respectively). During 2019 the lowest recorded biomass was in April (0.16 mg L-1), whilst the highest was in June (0.74 mg L-1). During April, May and June of 2016 Lake Visovac was oligotrophic, turning to mesotrophic status during July and September, while it was oligo-mesotrophic in August. As for the year 2019, Lake Visovac was characterized as oligotrophic during April and May, mesotrophic during June and September, and oligo-mesotrophic during July and August.
Spearman’srank correlation coefficient was used to test the significance level of interrelation between Chl-a and HLPI index with physico-chemical parameters (On-line Suppl. Tab. 6). Chl-a showed a statistically significant positive correlation with temperature and negative correlation with oxygen concentration and Secchi depth. HLPI was positively correlated with O2 and Secchi depth.
Comparison of lake trophic and ecological status
The ecological status of Lake Visovac during 2016 was characterized as High 16 times and as Good 8 times (Online Suppl. Tab. 7). During 2019 the ecological status of the Lake was High in 12 cases, Good in 11 cases and Moderate only in April. Depending on the metric used, the assessment of ecological status varied particularly for samples from April 2019. The results of the trophic status assessment were more heterogeneous. During 2016 Lake Visovac was characterized as mesotrophic 14 times, oligo-mesotrophic once, oligotrophic 7 times and ultra-oligotrophic 2 times. As for the 2019, the trophic status was assessed as mesotrophic 13 times, oligo-mesotrophic 2 times, oligotrophic 7 times and eutrophic 2 times.


Discussion
Physico-chemical parameters in Lake Visovac
The environmental variables mostly corresponded to the values reported during earlier studies in Lake Visovac (Gligora Udovič et al. 2011, 2015, Ciglenečki-Jušić et al. 2013). During spring overturn the warmer oxygen-rich water from the epilimnion pervades the hypolimnion, thus replenishing deep layers with oxygen but also allowing the transfer of nutrients from the hypolimnion upwards (Best et al. 2007, Salmaso et al. 2012). This event enabled the proliferation of phytoplankton, resulting in initial O2 increase in Lake Visovac during spring of both years. Conversely, summer months in the lake were characterized by a decrease in O2, mainly by decomposition of organic matter accumulated by primary producers (Sommer et al. 2012). Lakes on the carbonate waterbed are characterized by relatively high water pH as a consequence of dissolution of the substrate (Wetzel 2001). The highest pH was recorded during springtime in both years, thus clearly indicating an intensive photosynthetic activity.
Availability of nutrients is one of the key factors that control eutrophication and determine phytoplankton dynamics. Since the majority of nitrogen in lakes usually comes from direct terrestrial runoff, even minor variation innitrogen inputs can provoke considerable changes in productivity and nitrogen cycling in lakes (Sheibley et al. 2014). NO2- have a significant role as an indicator of redox condition change in water column and hypoxia (Ciglenečki-Jušić et al. 2013). Very low NO2-in2019 was previously attributed to natural within-lake processes (Gligora Udovič et al. 2015), but substantially higher values in 2016 could be primarily ascribed to the wastewater/sewage system from the city of Knin containing organic nitrogen and the agricultural runoff containing inorganic nitrogen, both of which can be decomposed to give ammonia and then oxidized to nitrite (WHO 2011). NO3- and NH4+, the most important nitrogen sources for phytoplankton growth (Domingues et al. 2011), were consistent with the previous studies on Lake Visovac (Gligora Udovič et al. 2011). Lower TN and NO3- in the summer of both years can be interpreted as a consequence of increased phytoplankton consumption during vertical water column stability as well as the increased sinking loss rate, whilst higher spring values suggest high oxygenation of the water column via vertical mixing and possible bacterial nitrification processes (Kunz 2005). NH4+ values were mostly low, except in May and June 2016, thus suggesting higher content of organic matter and increased microbiological decomposition (Wetzel 2001). Low TP in Lake Visovac was demonstrated previously (Gligora Udovič et al. 2011, 2015) and could be generally attributed to hydrological dilution during transport through karst drainage combined with a potentially high capacity for net P retention (Jarvie et al. 2014). Compared to its relatively small volume, Lake Visovac receives large amounts of freshwater yields enriched with nutrients (Ciglenečki-Jušić et al. 2013). Lakes tend to be more productive systems and it is necessary to regularly evaluate eutrophication impact based on competent practices founded on the best available technologies and high quality knowledge. It is also important to take into account the effects of warmer temperatures on stronger stratification since the climate change is already having, and will continue to have, profound influences on aquatic biota in lakes (Woolway and Merchant 2019).
Phytoplankton community
Pantocsekiella ocellata is a codon B species with highly variable phenotypic plasticity (Duleba et al. 2015) and a wide tolerance to various environmental parameters, including adaptation to high lake stability and low light availability (Reynolds et al. 2002). The ecological adaptations, coupled with correspoding environmental conditions, allowed this centric diatom to easily dominate mesotrophic ecosystems (Hu et al. 2012), such as Lake Visovac during the entire investigated period. This result was in accordance with the previous studies designating P. ocellata as one of the principal descriptors of the phytoplankton assemblage (Gligora Udovič et al. 2011, 2015). Asterionella formosa assorted into group C, is usually described from temperate habitats with high nutrient concentrations (Salmaso 2003), as its growth is sensitive to phosphorus and nitrogen depletion (Bertrand et al. 2003). The development of A. formosa in Lake Visovac can likely be linked to increased availability of silica concentration during spring overturn (Gligora Udovič et al. 2011). Besides diatoms, the phytoplankton assemblages of karst lakes are often distinguished by Ochrophyta (Žutinić et al. 2014, Gligora Udovič et al. 2015). Although recorded in Lake Visovac throughout the studied period, Ochrophyte species of the genus Dinobryon didn’t show high abundance or biomass. Dinobryon species are known mixotrophs capable of bacterivory in nutrient depleted conditions (Kamjunke et al. 2007), documented on previous occasion (Gligora Udovič et al. 2015). Although their assortment into group Edesignated for small, shallow, base-poor lakes, or heterotrophic ponds (Reynolds et al. 2002, Padisák et al. 2009) does not completely conform to ecological characteristics of this karst lake, taxa belonging to this association are commonly recorded components of the spring-early summer plankton in oligo–mesotrophic karst lakes (Žutinić et al. 2014). Cryptomonas sp., Plagioselmis nannoplanctica and Tetraselmis cordiformis belonging to coda X2 were positioned in the center of CCA ordination (Fig. 3), which confirms their wide range of tolerance to the changes of ecological conditions in Lake Visovac, as well as their meso-eutrophic character (Reynolds et al. 2002). Codon MP, which appeared subdominantly during spring, comprises mainly benthic diatoms that are kept in plankton during spring mixing of the water column (Padisák et al. 2006). As the stratification progressed, species from group MP declined further and were succeeded by the functional group LO, which dominated during the summer period of 2019 with Ceratiumhirundinella, known for its motility and mixotrophy, as the main descriptor. According to Reynolds et al. (2002), species from codon LOare affected by temperature conditions and usually flourish in the summer epilimnia of mesotrophic lakes. The CCA analysis further confirmed their correlation to the prolonged stratifying period in deep Mediterranean lakes due to the extension of the summer season (Pérez-Martínez and Sánchez-Castillo 2002). The negative correlation of samples from September 2016, August 2019 and September 2019 to Secchi disc and O2 on the CCA was clearly linked to ecological preferences of associated coda Pand K. The low oxygen and nitrate concentrations recorded in these months led to development of cyanobacterium Anathece smithii belonging to codon K, typical in nutrient rich columns (Reynolds et al. 2002), and codon P diatoms Aulacoseira granulata and Fragilaria crotonensis usually present in eutrophic epilimnia (Reynolds et al. 2002). The suggested A–B (C) – E– LOsuccession of Reynolds’ functional groups in this natural, oligo- to meso- trophic karst deep lake system (Gligora Udovič et al. 2015) was also confirmed by this study. The presence of selected and coexisting phytoplankton functional groups can be used to indicate current lake conditions and serve as an ac- curate descriptor of natural communities. Knowledge about natural succession of phytoplankton assemblages is crucial in order to understand and predict the community response to increased environmental changes as a result of anthropogenic pressure.
Comparison of lake trophic and ecological status
Prior to being successfully intercalibrated in 2019, the Croatian methodology (Croatian Waters 2016) for the ecological status assessment of lakes included a trophic module based on Chl-a, total biomass and proportion of taxonomic phytoplankton groups. The current methodology (Official Gazette 2019) uses the HLPI index, which takes into account Chl-aand phytoplankton composition. It is calculated using the relative abundance of Reynolds functional groups of phytoplankton and the factor values assigned to each codon considering the relationship with nutrient enrichment loadings (Borics et al. 2018).
According to the eutrophication status indicators, namely the TP, Lake Visovac was mostly assigned oligoto mesotrophic status. However, the currently official Good/ Moderate boundary for this lake type set at the TP of 0.05 mg L-1 is in discordance with the equivalent border setting of the OECD (see On-line Suppl. Tabs. 1, 2), which could result in a negative tendency in lake quality. The identification of a target nutrient concentration corresponding to the Good/Moderate boundary is critical for effective lake management (Poikane et al. 2019). Therefore, in the case of Lake Visovac the current setting should be revised so as to fit the first lower boundary (Moderate/Poor), equaling the Poor ecological status with the Eutrophic status delineated by the OECD.
According to the phytoplankton community composition, structure and biomass, its response to environmental pressures and the ecological status we proposed class boundaries for trophic status assessment by matching the correspoding eutrophication assessment using Chl-a (Tab. 1). The differences between proposed class boundaries and OECD boundaries (OECD 1982) in the oligotrophic and mesotrophic status class (On-line Suppl. Tab. 2) arise from the measurements conducted in this study, which indicated the requirement of adjusting thresholds for Lake Visovac. When we applied the suggested Chl-aclass boundaries, the trophic status shifted from oligotrophic to mesotrophic in June of both sampled years. Spearman’s rank correlation coefficient (On-line Suppl. Tab. 6) indicated significant positive correlation between Chl-aand temperature, and negative correlation with O2 and Secchi depth. Considering Chl-aas a proxy for phytoplankton, we should bear in mind that it is related to phytoplankton biomass and not abundance. Chl-ashould be used as a predictor of phytoplankton biomass with caution, taking into account its variable proportions per unit phytoplankton biomass. The quantity of Chl-a in phytoplankton cells is dependent on cellular requirements for carbon and light, as well as the resource limitationsof the major nutrients, nitrogen and phosphorus (Reynolds 2006).
HLPI was compliant with the propositions of the WFD as the most detailed metric giving the comprehensive insight into phytoplankton assemblage and directly indicating the ecological status. Contrary to Chl-a, Spearman’s rank correlation indicated a positive correlation of HLPI to O2 and Secchi depth (On-line Suppl. Tab. 6). We suggest using Chl-a metric for rapid assessment on a weekly basis as an early warning indicator of potential ecosystem deterioration. The use of the more complex and detailed HLPI metric is recommended on a monthly basis; this was also stipulated in the official Croatian national multiannual monitoring assessment program. Moreover, both metrics should be regularly applied during the vegetation period from April to September.
| Trophic status | Chlorophyll-a (µg L-1) |
| Ultra-oligotrophic | < 1 |
| Oligotrophic | 1 - < 2 |
| Mesotrophic | 2 - < 7 |
| Eutrophic | 7 - < 25 |
| Hypereutrophic | ≥ 25 |
In conclusion, the ecological status of Lake Visovac was assessed as Good and its trophic status was evaluated as mesotrophic. The Krka River is a highly sensitive karst aquatic system that requires constant targeted monitoring in order to prevent the possible risk of deterioration, especially in its lacustrine segments like Lake Visovac. In order to achieve that, we strongly emphasize a need for further improvement of confidence level in the metrics for ecological status assessment, along with a prompt comprehensive revision of boundaries for the indicators included.