
Introduction
Whey is a major byproduct of the dairy industry. Due to its valuable nutrients, such as soluble proteins, lactose and minerals (Prazeres et al., 2012), it is not only a by-product but also a valuable substance. Apart from the dairy industry, whey is used in the production of many different products such as meat, bakery and confectionery products, adding value to these products (Królczyk et al., 2016). However, the main application is still dairy products, and it can even be used as a raw material for some products such as cheese, beverages, whey powder, whey protein isolate, and whey protein concentrate.
Whey cheese is consumed all over the world, although the nomenclature varies depending on the region. The most commonly known derivative is probably "ricotta", a term that has its roots in Italy. Nevertheless, there are a variety of alternative names for this cheese in different geographic regions. For example, it is known as 'Myzithra' in Greece, 'Lor' in Turkey, 'Requesón' in Spain, 'Requeijão' in Portugal, and 'Primost' in Norway (Pires et al., 2021). Whey cheese is obtained by the aggregation of whey proteins due to the preservation of whey at high temperatures (above 80 °C) without the addition of enzymes (Božanić et al., 2014). The main commercial concern in whey cheese production is yield. The relatively low yield of whey cheese is attributed to the low dry matter and acidic nature of the curd, which results in small denatured protein particles floating on the surface during production (Bintsis and Papademas, 2023). Increasing cheese yield is a topic of ongoing study for both the dairy industry and numerous scientific research initiatives. Membrane technology (Riera et al., 2016), addition of polysaccharide gums (Kailasapathy, 1996), and feeding goats with enzyme extracts (Trejo-Lopez et al., 2021) have been investigated in various studies. Besides yield, one of the major challenges in whey cheese production is its short shelf life. Studies focusing on extending the shelf life of this type of cheese have increased in recent years. Some of these studies have reported that applications such as storage under hyperbaric conditions (Duarte et al., 2017), pulsed light treatment (Ricciardi et al., 2021), and plasma treatment (Ricciardi et al., 2022) could effectively extend the shelf life of whey cheese.
Transglutaminase (mTG) is primarily used in yogurt production because it increases the firmness of yogurts in stick form (Şanlıdere Aloğlu and Oener, 2013; Tsevdou et al., 2013) Hovjecki et al., 2021 and increases the viscosity of yogurts in stirred form (Hovjecki et al., 2021; Jaros et al., 2007). However, in recent years, the effects on cheese yield have been studied in addition to textural properties (Cadavid et al., 2020; Darwish, 2022; Topcu et al., 2020). The most critical factor limiting the use of mTG in cheese making is its possible inhibitory effect on rennet activity. This negative effect could prevent coagulation and prolong clotting time (Bönisch et al., 2008; D'Alessandro et al., 2021). Since there is no rennet activity in the production of whey cheese, there are no such concerns with whey cheese. However, several negative effects of the enzyme have been noted in other products. For example, some studies have shown that it negatively affects the solubility of Kashar cheese (Topcu et al., 2020) or reduces the amount of acetaldehyde in yogurt (Ozer et al., 2007). To the best of our knowledge, there is no study on the use of mTG in whey cheese production, except for goat whey cheese by Karzan et al. (2016). Thus, there is no information on the effect of mTG on whey cheese produced from cow's milk.
Therefore, the aim of this study was to investigate the effects of mTG enzyme in different ratios, which has been shown to be effective in different products, on the yield and textural properties of whey cheese. In addition, to show whether the use of mTG has a positive or negative effect on the main properties of the final product. Therefore, the effect of the addition of mTG on whey cheese samples obtained from cow's milk was investigated.
Materials and methods
Production of whey cheese
Whey (containing 6.63±0.15 % total solids, 0.33±0.02 % ash, 1.11±0.01 % protein, 0.7±0.1 % fat, 4.75±0.21 pH, and 9.50±0.7 LA %) from Kashar cheese production was obtained from the Ankara University Dairy Factory (Ankara, Turkey) and separated into three batches. Two of the samples were heated to 40 °C and mTG enzyme (EC 2.3.2.13, Activa®MP, Ajinomoto, Malaysia) was added in two different amounts (2 U/g protein - sample S2U and 5 U/g protein - sample S5U). Then, two samples waited for enzyme activity for one hour at 40 °C. All three samples were slowly heated to 80 °C with stirring. Temperatures were then increased to 95 °C for 15 minutes. The coagulum was collected from the surface and drained for 12 h. The coagulum was removed from the surface. Subsequently, all samples were vacuum packed in polyethylene/polypropylene. Preparation and analysis were performed in duplicate. Whey cheese samples were analysed on days 1, 10, and 20 of storage.
Gross composition and cheese yield
The total solids (IDF, 1982) and ash (IDF, 1964) of whey cheese were analysed by the gravimetric method at 102 °C and 550 °C, respectively. Fat content was determined by the Gerber-Van Gulik method, and total protein was determined by the micro-Kjeldahl method as described by Kuchroo and Fox (1982).
The actual cheese yield was calculated as the ratio between the weight of fresh cheese after pressing and the amount of whey, as given below (Fox et al., 2017).
Actual Cheese yield (ACY %) = The amount of cheese (g) / The amount of whey (g) x 100
The dry matter cheese yield (DMY) of the samples was calculated as given below (Ong et al., 2012).
Dry matter yield (DMY %) = ACY (100-Moisture content of cheese)/100
In addition to yields, solids recovery from whey was also calculated as follows:

Acidity of whey cheese
The pH of whey cheeses was determined by a pH-meter (Apera Instruments PH800, China). Titratable acidity was determined according to AOAC (1995).
Water holding capacity of whey cheese
The water holding capacity (WHC) of samples was determined by the centrifugation (Sigma 3-18K, Sartorius AG, Göttingen, Germany) of 10 g of whey cheese at 4 500 × g for 30 min at 4 °C. The water-holding capacity was calculated as given below.
The water-holding capacity (%) = (1 − W c/W i) × 100
where W c is the weight of whey after centrifugation and W i is the initial weight of the sample.
Ripening index
To calculate the ripening index (RI), total nitrogen (TN) and water soluble nitrogen (WSN) were determined by the micro-Kjeldahl method as described by Kuchroo and Fox (1982). The ripening index was calculated as below.
RI = TN/WSN
Microbiological analysis
Cheese samples were weighed at 10 g and mixed with 90 mL of sterile Ringer's solution, then homogenized for two minutes in a laboratory mixer (Bag Mixer 400 VW, Interscience, France). Serial dilutions were prepared and plated out in duplicate. Total aerobic mesophilic bacteria (TAMB) were determined on plate count agar at 30 °C for 48 h. Lactococcus and Lactobacillus species were counted on M17 and MRS agar, respectively. They were then incubated at 37 °C for 48 h. For determination of lactobacilli on MRS agar, they were incubated under anaerobic incubation.
Texture profile analysis
Texture profile analysis (TPA) of whey cheeses was studied using TA-XT Plus Texture Analyzer (Stable Micro System, UK) with 25 kg load cell and cylindrical probe P /20. The pre-test velocity was 1.0 mm/s, the test velocity was 5.0 mm/s, the post-test velocity was 5.0 mm/s, and the time between two compressions was 5 s. Hardness, adhesiveness, springiness, cohesiveness, gumminess, chewability and elasticity were determined as TPA parameters on days 1, 10 and 20 of storage.
Electrophoretic analysis
Changes in protein fractions of whey in samples were studied by sodium dodecyl sulfate-polyacrylamide gel electrophoresis (SDS-PAGE) (Bulat and Topcu, 2019; Laemmli, 1970). Samples with a final protein concentration of 50 μg/μL were mixed in 2X sample buffer (1:1), and 15 μL of the sample was passed through the separation gel (with 12.5 % monomer concentration) and the stacking gel (with 4% monomer concentration) at 200 mV after a 40 min run-up.
Sensory analysis
This analysis was performed by seven trained panelists (4 women-3 men, aged 36-61 years) according to the scoring card described by Clark and Costello (2016) on days 1, 10, and 20 of storage. Panelists were asked to rate the samples on appearance, body, taste, and overall acceptability.
Statistical analysis
Analysis of variance (ANOVA) was performed on data obtained from cheeses on days 1, 10, and 20 using the Minitab statistical package (version Minitab®20.4, Minitab Inc., State College, PA). One-way ANOVA and Tukey’s multiple comparison tests were used to compare the data based on different significance levels of p<0.05.
Gross composition and cheese yield
Table 1 summarizes the significance of the effects of mTG level and storage time on whey cheese properties. The results of the gross composition and yield of the whey cheese are shown in Table 2.
Table 1. The significance of effects of mTG level and storage time on characteristics of whey cheese
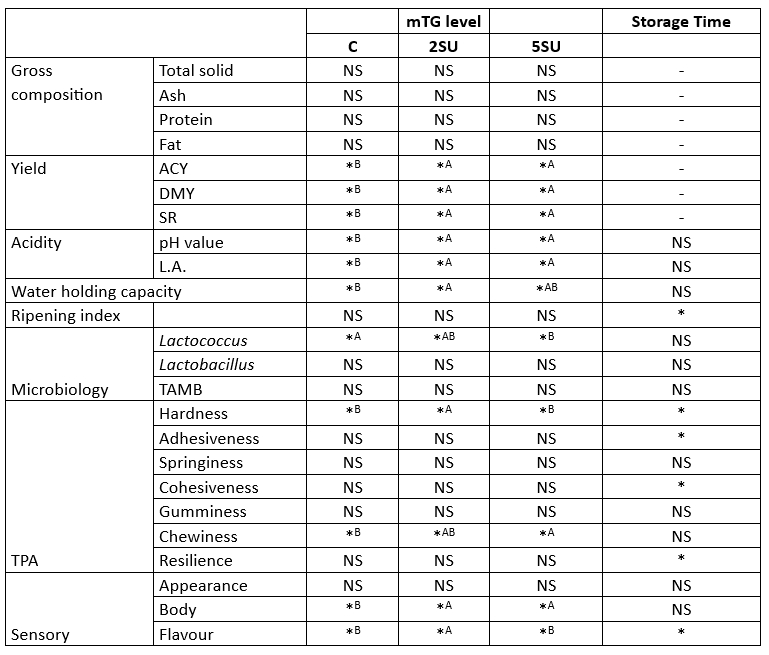
* Significant as a level of p<0.05; NS, not significant. No interaction was observed in any of the parameters.
Table 2. Gross composition and yield of whey cheese samples (n=2)
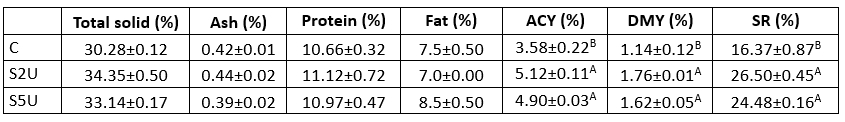
C is the control sample without mTG; S2U is the sample with 2 U/g protein mTG; S5U is the sample with 5 U/g protein mTG.
*Non-lettering columns indicates the differences between scores are not found significant (p>0.05)
**Different uppercase letters indicate that the difference between the samples is significant (p<0.05)
The total solids, ash, protein, and fat content of the samples with mTG added was higher than that of the control sample, but these changes were not individually significant (p>0.05). However, the difference in yield and solids utilisation is noteworthy. The results of ACY, DMY and SR showed that the yield values of the samples with mTG addition were significantly higher than those of the control sample (p<0.05) (Table 1 and Table 2). Increases of 1.54 %, 0.62 % and 10.13% ACY, DMY and SR, respectively, were observed in the sample containing 2 U/g mTG protein (S2U) compared to the control sample. Thus, the use of mTG in the production of whey cheese leads to a significant increase in yield and solid yield.
The main function of mTG is to cross-link casein, but several studies have shown that it also affects whey proteins (Eissa et al., 2004; Gauche et al., 2008). In this study, mTG caused a significant increase in the yield of whey cheese derived from whey and containing a high percentage of whey protein. Both ACY and DMY ratios indicated a positive enzyme effect. Although the values of ACY are expected to increase due to the increase in the water holding capacity of the proteins, the DMY ratios and the results of SR also showed an increase in efficiency in terms of total solids. This study has shown that the use of mTG in the production of whey cheese leads to more whey protein in the curd, effectively increasing the yield.
Acidity, water holding capacity, and ripening index values of whey cheese
The acidity, water holding capacity, and ripening index of whey cheese are shown in Table 3. Regarding pH values, no significant differences were observed between samples (p<0.05), although a slightly lower pH was observed in the control sample, which did not contain mTG. It was also found that the lactic acid levels were significantly higher than the control sample (p<0.05). During the one-hour waiting period for mTG activity in the production process, it was observed that the acidity of the samples with enzyme addition (S2U and S5U) was different from that of the control sample. This suggests that the difference in acidity is due to the production method rather than the enzyme itself. Previous research offers mixed findings on the effects of mTG on acidity. Several studies have reported that the addition of mTG to yoghurt samples resulted in a decrease in acidity (Al-Shawk et al., 2021; García-Gómez et al., 2020; Ozer et al., 2007). This effect was attributed to the reduction of low molecular weight peptides, which are essential for the growth of starter bacteria as a result of enzymatic activity (Dmytrów et al., 2010). On the other hand, opposite results have been documented, where mTG had no effect on the acidity of the samples (Marhons et al., 2023; Ziarno and Zaręba, 2020). Our study agrees with the latter results and confirms the assumption that mTG does not necessarily alter acidity.
The acidity values of whey cheese samples remained stable during storage (p>0.05). Since no fermentation occurred, no change in acidity was expected during storage. The average pH of the samples was determined to be 4.67. Similarly, Faccia et al. (2018) reported an average pH of 4.69 in traditional whey cheese samples.
Table 3. Acidity, water holding capacity (WHC), and ripening index (RI) of whey cheese samples (n=2)
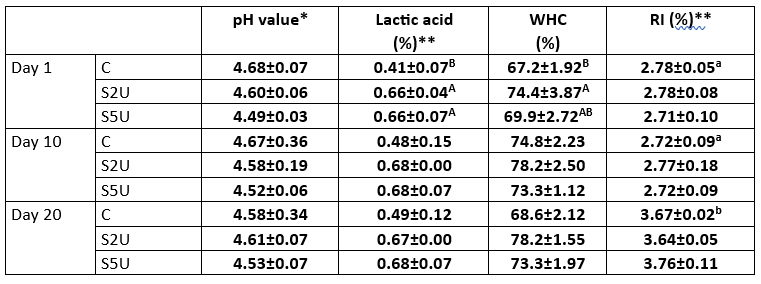
C is the control sample without mTG; S2U is the sample with 2 U/g protein mTG; S5U is the sample with 5 U/g protein mTG.
*Non-lettering columns indicates the differences between values are not found significant (p>0.05)
**Different uppercase letters indicate that the difference between the samples is significant (p<0.05)
***Different lowercase letters indicate that the difference between storage days is significant (p<0.05).
It is well known that cross-linking of whey proteins with mTG creates a continuous network structure that effectively binds water (Li et al., 2022). Consistent with this understanding, our results showed that cross-linked whey proteins had better water-holding capacity compared to the control sample (p<0.05). In particular, the WHC values of the sample treated with 2 U/g mTG protein were significantly higher than those of the other samples throughout the storage period. Interestingly, the WHC values of the sample treated with 5 U/g protein mTG were comparable to those of the control sample, suggesting that the effectiveness of mTG in increasing WHC is concentration dependent. Similarly, Ziarno and Zaręba (2020) and Pham et al. (2021) reported an increase in WHC values upon addition of mTG. WHC values of whey cheese samples increased slightly during the storage period, but this increase was not statistically significant (p>0.05). Thus, our studies confirm the evidence that the addition of mTG at an optimal concentration can improve the WHC value of whey cheese, an important characteristic for its texture and shelf life.
RI values changed significantly during the 20-day storage period (p<0.05). RI was stable during the first 10 days of storage, but increased on the 20th day. However, there was no significant difference between samples (p>0.05), indicating that the addition of mTG did not cause a change in RI values. The average RI values in different studies with similar cheeses were 1.79, 2.11, and 2.63 (Kalaycı et al., 2022; Kavaz and Arslaner, 2012). These results suggest differences in the composition and characteristics of different whey cheese samples, which could be due to factors such as milk source, processing techniques, or ripening conditions. However, the RI value could be much higher in other aged cheeses (>10 %) (Miloradovic et al., 2018; Shahab Lavasani, 2021). The relatively low RI value in the whey cheese samples is probably due to the fact that no microorganisms or enzymes are used in the production process and the enzymatic activity of the natural microbiota is reduced due to the heating process during production.
Microbiological analysis
The Lactococcus sp, Lactococcus spp, and TAMB viable counts of the whey cheese samples are shown in Fig. 1. The addition of mTG did not significantly affect Lactobacillus sp. or TAMB results (p>0.05). However, the addition of mTG caused a decrease in the number of Lactococcus spp. (p<0.05). The number of Lactococcus spp. decreased significantly, especially in samples with high enzyme content (S5U). Addition of mTG at a ratio of 2 U/g protein did not significantly decrease the Lactococcus population (p>0.05). Conversely, increasing the enzyme ratio to 5 U/g protein resulted in a dramatic decrease in Lactococcus numbers. This observation highlights the concentration-dependent effect of mTG on the Lactococcus population in the cheese matrix. The higher mTG concentration at 5 U/g protein could therefore potentially have a negative impact on the presence of lactococci in whey cheese production, an aspect that requires careful consideration. The numbers of other bacteria were also lower in the S5U samples, although only slightly (p>0.05). The observed changes in bacterial populations in response to the addition of mTG have implications for the quality and safety of whey cheese. Lactococcus spp. play a critical role in fermentation and flavor development, and their decline may affect acidification and flavor profile during ripening. A balance between the functional benefits of mTG and its effects on bacterial numbers is important for optimal cheese production.
In other studies, mTG was found not to affect the growth of lactic acid bacteria in many different fermented dairy products (Akal et al., 2022; Hovjecki et al., 2021; Ozer et al., 2007). However, in a study of yogurt with added mTG similar to our research, the use of mTG did not affect Lactobacillus species but caused a decrease in the number of Streptococcus species (Ziarno and Zaręba, 2020). In addition, a study that found that the addition of mTG to fresh cheese reduced the number of Streptococcus thermophilus reported that the reason for this is the cross-linking of peptides required for the growth of Streptococcus due to enzyme activity, and therefore may affect the growth of this strain (Pham et al., 2021).
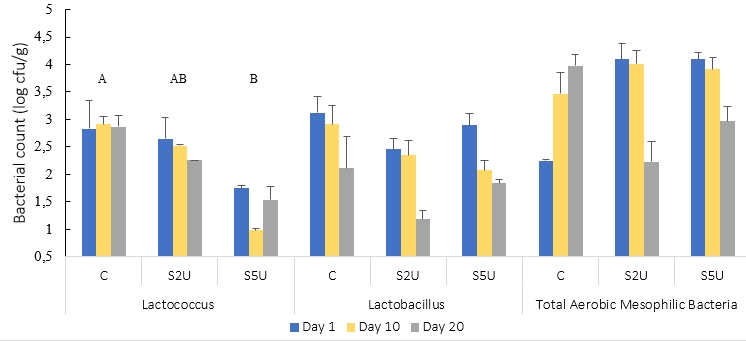
C is the control sample without mTG; S2U is the sample with 2 U/g protein mTG; S5U is the sample with 5 U/g protein mTG.
*Non-lettering graphs indicates the differences between values are not found significant (p>0.05)
**Different uppercase letters indicate that the difference between the samples is significant (p<0.05)
Figure 1 Microbiological results of whey cheese samples (n=2)
No change was observed in any of the bacterial species during the storage period (p>0.05). The storage period of 20 days had no effect on the number of bacteria in vacuum-packed cheese samples under refrigerator conditions.
Texture profile analysis
The results of the texture profile analysis of the whey cheese samples are shown in Table 4. A significant difference was found between the hardness values of the whey cheese samples depending on the enzyme ratio (p<0.05). Although the sample with an enzyme ratio of 5 U/g protein was relatively close to the control sample (p>0.05), a significantly higher value was found for the sample with an mTG ratio of 2 U/g protein (p<0.05). The mTG enzyme cross-links proteins in the cheese network and forms isopeptide bonds (Torabi et al., 2021). Accordingly, the cheese texture becomes more compact and harder (Oezer et al., 2013). In this study, the addition of 2 U/g mTG protein resulted in an increase in hardness. The cross-linking of the proteins provided more stiffness in the whey cheese samples. Similarly, Imm and Lian (2000) reported that the addition of mTG increased the hardness of heat-induced milk gels, and Sayadi et al. (2013) indicated the same effect of mTG on fresh cheese fortified with whey protein isolate. The increase in the resistance of the gel matrix to deformation forces could be due to more protein contact points. However, increasing the enzyme ratio to 5 U/g protein did not further increase the hardness value and even reversed the hardness increase. Although the S5U sample contains more mTG, it has a lower hardness value than the S2U sample. This could be due to the fact that too high mTG ratios above the optimal value prevent the formation of a well-structured protein network (Cadavid et al., 2020; Imm and Lian, 2000).
Table 4. Texture profile analysis of whey cheese samples
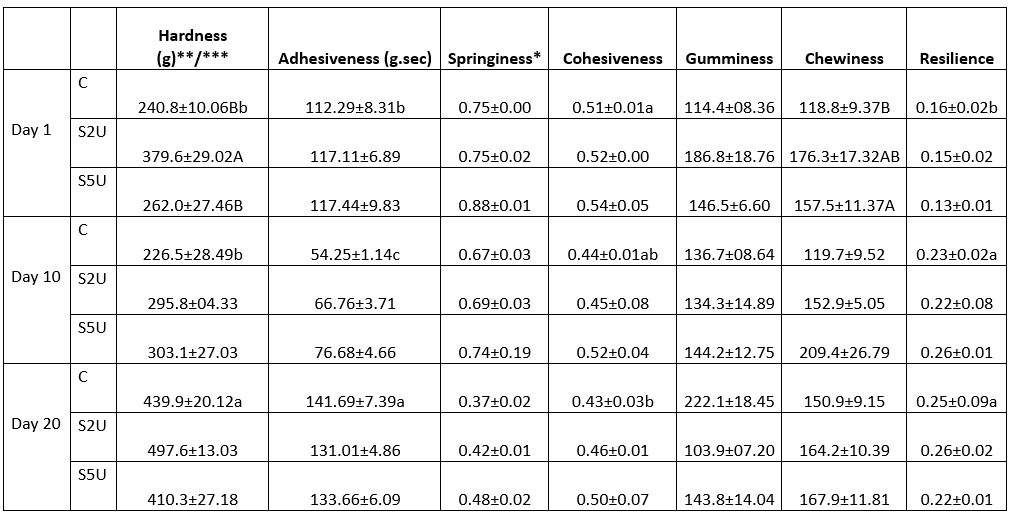
C is the control sample without mTG; S2U is the sample with 2 U/g protein mTG; S5U is the sample with 5 U/g protein mTG.
*Non-lettering columns indicates the differences between values are not found significant (p>0.05)
**Different uppercase letters indicate that the difference between the samples is significant(p<0.05)
***Different lowercase letters indicate that the difference between storage days is significant (p<0.05).
In addition to hardness, the elasticity, cohesion, and bite strength values of whey cheeses with mTG were also higher than those of control cheeses throughout storage. These trends in texture profile results were similar to other studies on Gouda cheese (Domagała et al., 2022), Kashar cheese (Topcu et al., 2020), and Trappist cheese (Darnay et al., 2017) with mTG. As mentioned earlier, the increased texture values are believed to be due to inter- and intramolecular cross-links induced by mTG. In the whey cheese samples, the mastication values showed a parallel trend with hardness. It is noteworthy that the S2U sample, which exhibited the highest hardness value, also showed increased mastication values. This observation suggests a direct relationship between the hardness of the cheese and the effort required during chewing. In agreement with our results, another study (Kaminarides et al., 2020) found lower chewing values in softer cheeses, which was attributed to the lower force required for chewing when the texture of the cheese becomes softer. The relationship between chewing force and cheese strength underscores the importance of texture to the sensory experience during consumption.
These results highlight the role of hardness in shaping the textural properties of whey cheese and its potential impact on the eating experience. By understanding the interplay between hardness, gumminess, and chewiness, cheese makers can tailor the texture of the product to consumer preferences and ensure a pleasant sensory journey with each bite. Further studies could explore the underlying mechanisms behind these texture relationships to improve our understanding and refine cheese-making processes.
Significant changes were found in hardness, cohesion, and adhesion values during storage (p<0.05). In general, the degree of hardness of cheese increases as a function of the increase in pH during storage (Guerra-Martínez et al., 2012). In our study, there was no pH change because it was an unripened fresh cheese with limited bacterial activity. However, the degree of hardness increased during storage. It is believed that moisture loss due to the properties of the packaging material during storage caused this increase. While there was no difference between samples (p>0.05), both cohesion and adhesion values differed during storage (p<0.05). Cohesiveness decreased steadily during storage, while adhesiveness fluctuated. Whey cheese adhesion values decreased for all samples during the first 10 days and then increased significantly on the 20th day of storage (p<0.05). Although resilience is not a textual expression, it has a meaning that can be considered textual. Since it refers to the force required for a sample to return to its original state, it gives an impression of the resilience of cheese samples. Although there was no significant difference between the samples, the elasticity values increased significantly during storage (p<0.05).
The comprehensive study of texture properties showed that the use of mTG, a texture enhancing agent commonly used in the food industry, significantly improved the texture of the whey cheese samples. However, it's important to note that the extent of these improvements depended on the enzyme concentration. The finding that the addition of 2 U/g protein mTG resulted in the most favorable texture properties during the 20-day storage period indicates an optimal dosage that balances desirable texture properties with potential drawbacks. This concentration allowed the formation of a well-structured protein network, resulting in increased hardness and overall improvement in spring strength, cohesion, and chewing properties.
Electrophoretic analysis
The results of electrophoretic analysis clearly showed the effects of cross-linking mTG and protein band density (Fig. 2). The results of SDS -page analysis showed that the band density of whey cheese samples did not change with storage time and the protein contents of all samples remained similar over the storage period of 20 days.
However, certain proteins such as anthine dehydrogenase, butyrophilin, and lactadherin, which are commonly found in the membranes of milk fat globules (Salvatore et al., 2014), were not detected in the whey cheeses. It is suggested that the production processes, particularly mechanical action, may have damaged the fat globule membrane so that these proteins could not be detected.
During preparation, whey proteins in the samples were heated to high temperatures, which led to their denaturation. As a result of thiol-disulfide reactions with casein, the denatured whey proteins formed micelle-bound complexes, resulting in low color intensity of the β-lactoglobulin and α-lactalbumin bands (Donato and Guyomarc’h, 2009). The newly formed complex had a high molecular weight of approximately ∼3.5 × 10⁶ (Guyomarc'h et al., 2003) to 2 × 10⁷ g/mol (Jean et al., 2006) (3500-20000 kDa). Because of this high molecular weight, the casein-whey protein complex was not visible on the gel. In addition, the electrophotogram showed that whey proteins were almost absent in the samples with enzyme addition and the casein bands had much lower color intensity compared to the control sample. This indicates the presence of a complex formed by mTG crosslinking between proteins. The different enzyme ratios showed that no αs-casein or whey proteins were present in either enzyme concentration. However, when comparing the two enzyme ratios, the S2U sample exhibited lower color intensity than the S5U sample, indicating greater protein involvement in crosslinking. This finding explains the higher hardness and yield of the S2U sample.
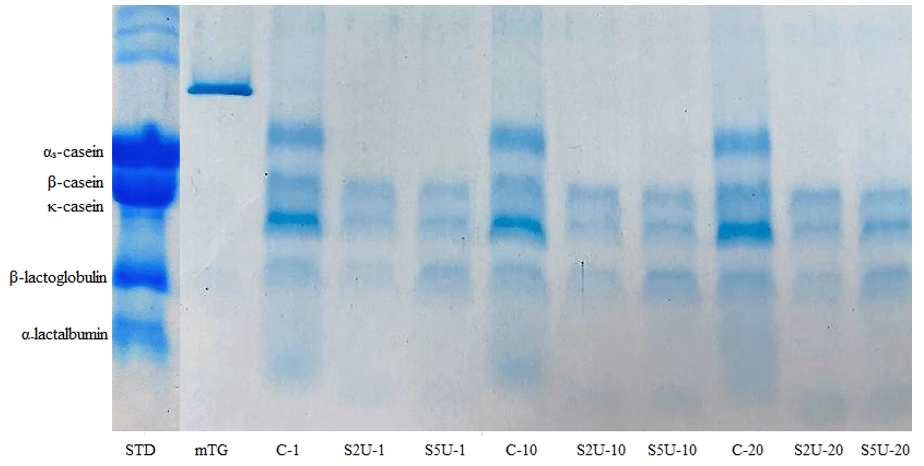
*C is the control sample without mTG; S2U is the sample with 2 U/g protein mTG; S5U is the sample with 5 U/g protein mTG
Figure 2. SDS-PAGE separation of proteins in whey cheese samples*
Sensory properties
The sensory characteristics of the whey cheese samples are shown in Fig. 3. The appearance ratings of the whey cheese samples increased with the addition of mTG. The samples added with mTG were rated better than the whey cheese without mTG. This is likely due to the fact that the mTG enzyme brings small proteins together through the cross-linking effect, resulting in more uniform and smaller gaps in the structure (Pham et al., 2021). This effect resulted in a smoother and straighter appearance of the cheese.
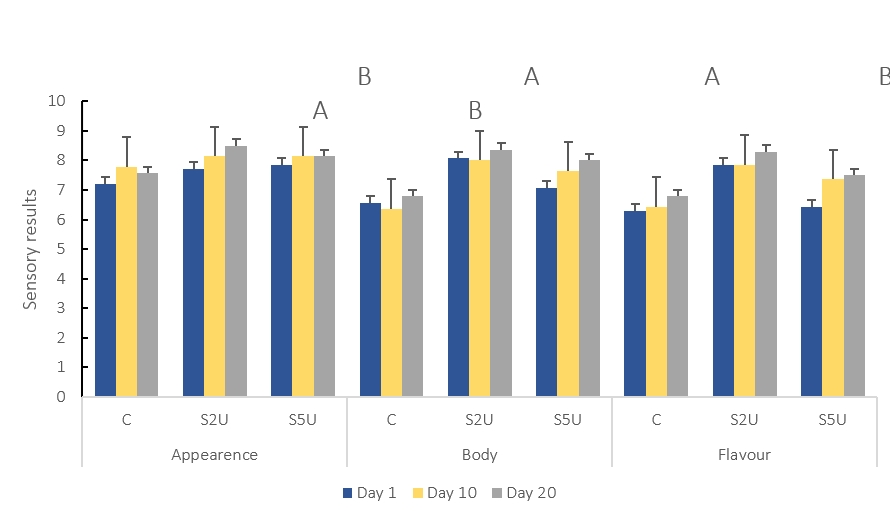
C is the control sample without mTG; S2U is the sample with 2 U/g protein mTG; S5U is the sample with 5 U/g protein mTG.
*Non-lettering columns indicates the differences between values are not found significant (p>0.05)
**Different uppercase letters indicate that the difference between the samples is significant(p<0.05)
Figure 3. Sensory results of whey cheese samples (n=2)
One of the main expectations of the addition of mTG to whey cheese was the improvement of cheese texture, which would increase consumer preference. As expected, the addition of mTG significantly improved the texture of whey cheeses (p<0.05) (Table 1). The studies on different cheeses showed that the addition of mTG improved the sensory properties of bodyand texture (Darwish, 2022; Darwish et al., 2019; Razeghi and Yazdanpanah, 2020).
The taste results of whey cheeses with mTG are remarkable. The taste scores of cheeses containing mTG at a ratio of 2 U/g protein were significantly higher than those of the other cheeses (p<0.05). Enzyme addition made a difference in whey cheese production depending on the ratio. The high enzyme addition (5 U/g protein) decreased the preference of the testers due to the chemical bitter taste, while there was no difference in the control sample. In agreement with the microbiological results, the lower number of Lactococcus spp. in the S5U sample also had a negative effect on taste development. The enzymatic activity of Lactococcus spp. contributes to the formation of aromatic compounds through proteolysis and lipolysis processes. When the presence of Lactococcus spp. is reduced, these enzymatic reactions could be impaired, hindering the formation of specific flavor compounds that are critical to the unique sensory characteristics of whey cheese. The S2U sample was highly appreciated by the investigators. Garcia-Gomez et al. (2020) reported that the mTG affected the flavor of the cheese in addition to improving texture. In addition, the authors pointed out that the addition of mTG provided greater intensity of milk and cheese flavor than the control cheeses without mTG (Garcia-Gomez et al., 2020).
Conclusion
In this study, the effect of different ratios of mTG on the properties of whey cheese was investigated. The results showed that mTG had a significant effect on yield, WHC, Lactococcus count, texture, and sensory properties, but no effect on gross composition, acidity, or Lactobacillus or TAMB counts of whey cheese.
The mTG had a significant concentration-dependent effect on whey cheese production. Cross-linking by mTG increased hardness, yield and improved sensory properties of whey cheese in a ratio-dependent manner. The whey cheese with 2 U/g protein mTG had the highest hardness, yield and sensory values and had no effect on the other properties. The addition of a higher amount of mTG resulted in a decrease in the positive effects of mTG. Yield, WHC, hardness, and sensory values were lower for the whey cheese with 5 U/g mTG protein than for the sample with 2 U/g mTG protein. In addition, high mTG content significantly decreased the number of Lactococcus. This was confirmed by electrophoretic data, where the S2U samples had a lower intensity, indicating a higher proportion of cross-linked proteins than in the S5U samples. This observation not only underlines the concentration-dependent effect of mTG, but also highlights the importance of an optimal ratio to achieve the desired properties of whey cheese.
Consequently, this study confirms that the use of mTG to modify the cheese matrix is a viable technique for whey cheese production. The results show that the optimal ratio is 2 U/g mTG protein, which not only contributes to a more sensory satisfying product but also increases the production yield. However, the effectiveness of mTG is highly dependent on its concentration, which highlights the importance of regulating its use.
Proizvodnja sira od sirutke primjenom transglutaminazom - utjecaj dodane količine na prinos, teksturu i senzorska svojstva
Sažetak
Prinos u proizvodnji sireva od sirutke često je nizak, a tekstura mu je uglavnom mekana. Stoga je cilj ovog istraživanja bio bio ispitati učinak dodatka različitih količina (2 U/g proteina i 5 U/g proteina) mikrobne transglutaminaze (mTG) na sastav (suha tvar, pepeo, protein i mast), prinos, kiselost (pH vrijednost i mliječne kiseline), mikrobiološka svojstva (Broj Lactococcus, Lactobacillus i ukupni broj aerobnih mezofilnih bakterija), profil teksture, elektroforetska svojstva (SDS-PAGE) i senzorska svojstva (izgled, tekstura i okus) sira od sirutke. Uzorci proizvedeni dodatkom 2 U/g proteina mTG imali pokazali su bolje rezultate u pogledu prinosa, tvrdoće i senzorskih vrijednosti. Rezultati SDS-PAGE također su pokazali da je uzorak koji je sadržavao 2 U/g proteina mTG imao veći postotak umrežavanja od uzorka koji je sadržavao 5 U/g proteina mTG. Za usporedbu, uzorak s 5 U/g proteina mTG imao je smanjen broj bakterija mliječne kiseline i lošija senzorska svojstva. Dobiveni rezultati sugeriraju da dodavanje odgovarajuće količine (2 U/g proteina) mTG-a može poboljšati prinos, profil teksture i senzorska svojstva sira od sirutke, dok dodavanje prekomjernih količina mTG-a može negativno utjecati na navedena svojstva.
Ključne riječi: sir od sirutke; transglutaminaza; umrežavanje; prinos