
1. Introduction
During wheat breeding aimed at food quality, the content of proteins and their technological quality in terms of rheological properties are one of the major goals. Concerning the prevailing final transformation of wheat flour into yeasted bakery products, food wheat is sorted into four quality classes. These categories of wheat varieties are: E – Elite (improving), A – Quality, processable separately, B – Bread varieties and C – Other, suitable for biscuit production (ČSN 461100-2:1992, or ISO 7970:2000). Among other qualitative parameters, the mandatory protein content is at least 11.5% for both bakery and biscuit varieties of food wheat. From a technological point of view, a more important feature is the content of the so-called wet gluten, which oscillates approximately around a triple when compared to the protein content. It signifies the water absorption potential of the flour–developed gluten and the future yield of the dough in cases when sourdough is not incorporated. The traditional laboratory procedure involves extracting gluten manually from a standard flour sample under a stream of tap water, which is not very precise and requires a skilled laboratory worker. The instrumental mechanical method is included in the international standard ISO 21415-2:2015, when the apparatus called Glutomatic is employed, using a 2% aqueous solution of sodium chloride. Primarily, the quality of wheat protein is also estimated as a volume of wheat proteins precipitated in a solution of lactic acid and isopropyl alcohol after 10 min of shaking and 5 min of sedimentation (ISO 5529:2007). The mandatory bakery quality of wheat flour is expressed as a sediment volume of at least 30 mL. However, to sort a newly-bred food wheat variety into elite class E, the limit is elevated to min. 40 mL.
As gluten does not exist in dry flour, another important quality proof is the measurement of water absorption during standardized dough preparation using a farinograph (ISO 5530-1:2013, ICC 115/1, AACC 2010 method 54-21). With the supply of mechanical energy, water molecules are incorporated into protein chains, which swell and in such a way form the supporting skeleton of the dough. The method is quite material- and time-consuming and is usually performed in the laboratories of wheat industrial mills and bakeries as a final control and immediately after the goods income, respectively. Among the mentioned food industry subjects, wheat flour types of predefined quality are a subject of contract, influencing processing conditions and a production portfolio. Wheat flour proteins, present in amounts of 10-15%, are thus responsible for water absorption during dough development. As noted by Schneeweiß (2018), “ the proteins bind water in a weight ratio of 2:1 to 1:10”. However, a partial role in wheat dough development can be assigned to cereal fibre (earlier called dietary fibre), especially to its soluble fraction. These non-starch biopolymers are disposed by a multiple higher retention capacity of water than wheat gluten, but their content in plain or bread wheat flour is commonly between 1-2% (Popper et al., 2006). However, in less-used wholegrain flour (also called wholemeal), the fibre may represent approximately one-tenth of its mass. Moreover, fibre in wheat flour is accompanied by mineral substances (ash). The ash content serves as a control of the disintegration process in an industrial mill, and it is used for sorting several commercial flour types.
Using the rheometer Farinograph, the reference method is the determination of the water absorption of white wheat and bread wheat flour, or rye bread flour. In practice, water absorption could be appended to a basic calibration packet of the NIR spectrometers for an operational evaluation of wheat flour quality in terms of contents of moisture, protein, wet gluten, and minerals (ash) plus the Zeleny value (method ISO 5529:2007 noted above). Such NIR spectrometers are used in the reception laboratory of the industrial mills, where they facilitate the decision to accept or reject actual grain delivery. The second alternation of the standard approach is referred to as gravimetric basis – a flour sample is homogenised into suspension with the predefined volume of solvent, and immediately or after a specific resting time, a swelled solid mass is weighed after centrifugation (Sosulski, 1962). The described course is a principle of the methods Water Absorption Index (WAI) and the Solvent Retention Capacity profile (SRC, AACC 2010 method 56-11-01), namely the Water retention capacity (common abbreviation WASRC, or WA-SRC). If the mass of the centrifuged gel is dried, the Water Solubility Index (WSI) expresses the quotient of the mass of the dried residue to the mass of the sample in percentages.
The present study aims to compare the preciseness of the prediction of the farinograph water absorption using the NIR technique and the centrifugation method. For this purpose, a set of standard wheat flour including 44 independent samples were processed statistically in terms of correlation analysis, analysis of variance and linear regression.
2. Materials and methods
Wheat flour samples
A set of 44 wheat samples of food wheat was harvested in August 2021 from the locality Stupice within the Central Bohemia Region in the Czech Republic. Namely, 23 samples could be described as the standard maturity collection and the remaining 21 as early maturity collection (hereinafter ‘SM2’ and ‘EM2’, respectively). Flour samples were prepared in the National Reference Laboratory of the Central Institute for Supervising and Testing in Agriculture in Brno, Czech Republic, and they were characterised as finely milled wheat flour. In correspondence with the Decree 18/2020 Coll. of the Ministry of the Agriculture of the Czech Republic, granulation of such flour type is defined as underflow on sieves of 257 and 162 microns. Further, there is a definition within the Decree of the bright and semi-bright subtype of the finely milled wheat flour; the max. ash content is up to 0.60 and 0.75%, respectively.
Methods
All flour samples were analysed in terms of moisture, ash and protein contents according to the norms ČSN ISO 712, ČSN ISO 2171 and ČSN 46 1011-18 (the Kjeldahl’s method), respectively. Farinograph water absorption (coded as WA-FAR) was determined directly using the Farinograph-E (Brabender, GER), following the international ICC norm mentioned above. The first indirect estimation of the water absorption using the spectrometer InfratecTM 1241 (FOSS Group, Denmark), equipped by the Flour module and using the original company’s calibration was conducted (abbreviation WA-NIR). The second method, based on hydration and centrifugation, was carried out in agreement with Unbehend et al. (2006), and the parameter was coded ‘WA-CTF’. Briefly, the procedure was carried out with a flour dose of 5.00 g and five-time higher amount of distilled water (weighed directly into a centrifuge tube), manual transformation into homogenous suspension, centrifugation at 5,000 g for 5 min, draining for a further 5 min and weighing the centrifuge tube with gel. Since this is a pilot study and there are more 20 samples in both SM2 and EM2 subgroups, measurement was repeated once.
Statistical analysis of data was carried out using the software Statistica 13 (TIBCO software, USA), including analysis of variance (ANOVA, p = 95%), correlation analysis ( p = 95%, 99%, and 99.9%) and linear regression. For two-way ANOVA, factor Wheat assortment with categories SM2 and EM2 was one of prime importance and the factor Flour type with categories bright and semi-bright flour as defined above was one of secondary importance.
3. Results
Characterisation of the tested material
As shown in Table 1, statistical analysis of the data variance (ANOVA) of 23 and 21 samples within the SM2 and EM2 subsets showed similar results for ash and protein contents as well as water absorption. No significant differences were found in the category Wheat assortment (with the exception of the WA-CTF of semi-bright SM2 and bright EM2 flour samples). Considering the second factor Flour type, the results of the ANOVA were provable for the ash content only (Table 1); but in other parameters, nevertheless, arithmetic values of the semi-bright specimens were slightly higher in contrast to the bright counterparts.
Correlation analysis
The analysis of five determined features confirmed the presumed bounds of water absorption to the chemical composition of flour, especially to the protein content. Significant correlations of the triple of water absorption WA-FAR, WA-NIR and WA-CTF to the ash content reflect an identical variation in the non-evaluated fibre portion. In Table 2, three correlation matrixes were compiled, reflecting correlation analysis within the subsets SM2 and EM2. In overview, only correlations between 2 pairs of variables were not significant; reversely, 23 correlations (i.e., 77%) were provable at p = 99.9%. Considering water absorption, the tightest relationship to the protein content was found for the WA-NIR. This finding is logical because NIR waves interact with peptic bounds, and the intensity of the interaction is recalculated onto the target feature. On the other hand, correlation 0.860 and 0.862 ( p = 95%) in pairs WA-FAR – WA-NIR and WA-FAR – WA-CTF for all 44 samples could be considered comparable. Within the SM2 and EM2 subsets, somewhat tighter correlations were observed in pairs WA-FAR – WA-CTF ( r = 0.918) and WA-FAR – WA-NIR ( r = 0.875), respectively.
Multiple correlation coefficient R(z/xy) in the form of WA-CTF/WA-FAR × WA-NIR could be used for a refinement of the WA-CFT calculation, which was identified as a predictor with the weakest accuracy. For the single subsets SM2 and EM2, as well as the conjoined set SM2+EM2 (coded as ‘All’ in Table 2b), the R(z/xy) values were significant at p = 99.9%. For the other two combinations WA-NIR/WA-FAR × WA-CTF and WA-FAR/WA-NIR × WA-CTF, the multiple correlation coefficient R reached values in a range of 0.869–0.946 ( p = 99.9%; data not shown). Regardless of verified tightness among members of these sample pairs, the correlations are meaningless in practice – e.g., there is no necessity for a backward prediction of the WA-FAR according to the WA-NIR and WA-CTF.
Linear regression
Within the SM2 and EM2 subsets, overlapping ranges of the WA-FAR from 55.60% to 63.20% and from 50.80% to 62.50% respectively, were measured (Table 1). Drawing all values of the water absorption into a scatter plot (Figure 1), a clear difference could be noticed between the results of both indirect methods WA-NIR and WA-CTF, developed and repeatedly tested for the WA-FAR prediction. In the case of the NIR spectroscopy, the median difference of 3.8 percentage points was approximately three-times lower in contrast to the centrifugation method (median difference of 9.2 percentage point; data not shown). Based on this, approximately a twofold angular deviation of the regression line could be observed for the WA-CTF data, while the regression line for the WA-NIR data was approximately parallel to the control line.
Results of linear regression for the WA-FAR, WA-NIR and WA-CTF separately are presented in Tables 3a and 3b. For the water absorption determined by the control method, the effect of both protein and ash content was comparable (similar F-values); in this regard, the primary role played an assortment of wheat (SM2, EM2 – standard and early maturation, respectively). When further regression results for the WA-NIR are compared, F-values were higher with the exception of the Assortment factor. For the second indirect method WA-CTF, the influence of the ash content was multiplied to the determined protein portion in flour (Table 3a). In the case of contrasting the preciseness of three built-up models, the higher adjusted R2 value indicates a better fitting of the generated model – a higher portion of explained data scatter. In this regard, the calibration set of 44 tested samples could not be considered sufficiently robust – adjusted R2 values ranged only from 0.62 to 0.70 (Table 3b). The model for the estimation of water absorption by the NIR method was the most precise, confirming a common usage of the NIR-spectrometers in the mill-bakery practice. Wheat flour samples characterised by water absorption lower than the minimum as well as higher than the maximum may refine the slope of the regression line (as the validation set of the built-up models). The regression coefficients β1 and β2 in equations (1) and (2), which are based on the ash and protein contents for the whole set (N = 44), document a partial oversizing of the farinograph water absorption by using the NIR spectrometer (Figure 1):
WA-FAR = 25.836 + 29.273 * Ash + 1.230 * Proteins (1),
WA-NIR = 25.579 + 30.968 * Ash + 1.461 * Proteins (2),
WA-CTF = -3.192 + 96.935 * Ash + 1.209 * Proteins (3).
Considering the primary factor Assortment, a count of the equations would be twofold if the ‘SM2’ and ‘EM2’ sub-categories would be included, but such detailed results of regression analysis overcome the aim of this study.
The precision of built-up regression models could be alternatively compared via residues, which express the vertical distance of each predicted value from the regression line and the sum of which should be equal to zero (residues should have a constant variance). A similar distribution of regression residuals could be again noticed between the WA-NIR and the WA-FAR (Figure 2). At the same time, the residues range of WA-CTF was 2.5-times broader reflecting the higher scatter of original data. For WA-FAR, WA-NIR and WA-CTF, the interval of residuals <-1; 1> absorbed 43%, 48% and only 25% of the tested samples, respectively.
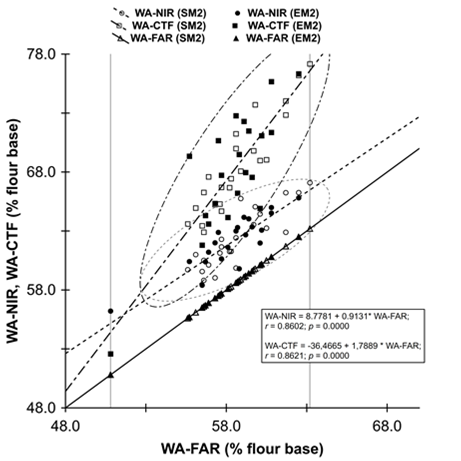
Figure 1. Regression of dependence of water absorption determined by NIR spectrometer (WA-NIR) and centrifuge (WA-CTF) on the standard farinograph one (WA-FAR). ○, ● / □, ■ / △, ▲ – WA-NIR / WA-CTF / WA-FAR values for the wheat samples of standard maturity ‘SM2’ and early maturity ‘EM2’, respectively. Full, dashed and dashed dotted line – regression lines for the WA-NIR, WA-CTF and WA-FAR data, based on the WA-FAR data. Ellipses cover 95% of data.
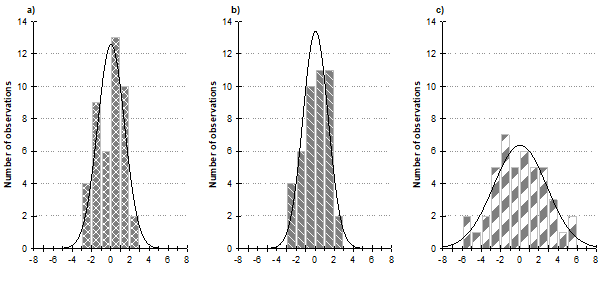
Figure 2. Distribution of the residuals of linear regression for a) WA-FAR, b) WA-NIR and c) WA-CTF.
Table 1. Two-way ANOVA of basic quality characteristics of the tested samples of wheat flour
The effect of flour constituents on water absorption
The industrial milling process of wheat grain is based on repeated extraction of the bio-components in the direction from the grain centre to its cover, collecting the neighbouring parts of the endosperm together and an inner part of the cover by stepwise milling and sieving. Within wheat grain, the content of mineral compounds does not vary through the endosperm (≈0.35%), but it increases dramatically close to and in the non-starch cover layer of the grain. This dependence is usually drawn into a line plot, which is called a cumulative ash curve (Sakhare and Inamdar, 2014). A higher content of minerals concurrently means a higher portion of the fibre (mainly arabinoxylans), contributing later to elevated water absorption. Within the Central European region, wheat flour with coarse granulation is milled from the centre of the endosperm and contains approximately 0.40% of ash and 2.5-3.0% of fibre. The finely milled, so-called bright flour type, contains up to 0.60% of non-combustible minerals and 3.0-3.5% of dietary fibre. Fractions extracted significantly closer to the bran cover are collected into commercial wheat flour type called fine bread, which may contain 1.0-1.1% of ash as well as cca 3.8% of fibre. Opposite to coarse, wheat flour takes wholemeal finely milled flour, whose composition includes 1.6-1.8% of ash and around 8-12% of fibre. At the same time, the content of proteins rises slowly (usually from 11% to 13%, respectively), but a major change occurs in their elasticity and extensibility – it affects the easiness of dough leavening and dough volume, resulting in a specific usage of different final products. Within the aleurone, a sublayer of the grain cover, non-gluten proteins (globulins) are present (Meziani et al., 2021), and due to that, wheat bread flour demonstrates a lower technological quality of the dough.
The composition of wheat flour in terms of basic constituents such as starch, proteins and non-starch polysaccharides, forms its water (or oil) absorption (holding) capacity. Li et al. (2023) used raw wheat bran (RWB) and its purified version (called there WBDF as wheat bran dietary fibre) and demonstrated an increase in the absorption power of the treated sample – water absorption capacity was magnified twofold, reflecting an increase in both insoluble and soluble fraction of dietary fibre. For the maximal fibre dosages of 30% RWB and 15% WBDF, presented increases in faringoraph water absorption were from 62.4% of flour base (control) to 69.7% and 71.4% flour base, respectively. Wheat flour containing with 10.4% of proteins was fortified by several doses of both types of bran. For raw bran RWB in portions of 6% and 12%, water absorption during dough preparation using Mixolab has significantly risen from 62.4% to 64.4 and 65.8% of flour base. For purified bran WBDF, that elevation was closely two-times higher as presumed (to 66.0 and 69.2% of flour base, respectively). This modelling of wheat flour composition supports our own findings, indicating that water absorption of semi-bright sample from both SM2 and EM2 assortment was higher in contrast to the bright counterpart. Kim et al. (2003) reached similar conclusions – they showed that the ash content influenced the rheological behaviour of bread flour for frozen dough production. For the preparation of dough of the standard consistency during the farinograph proof, wheat flour with high ash content needed more water than standard bread wheat flour, and later reversely to the farinograph quality number (dough softening increased). Another type of wheat flour fortification was used by Nikolić et al. (2023), who replaced the basic raw material with 5-30% porcino flour (powder of mushroom Boletus edulis). For this alternative material, authors mentioned three-times, over sixty-times and twice higher portion of minerals such as magnesium, iron and zinc than in control flour, respectively. The results of dough preparation on farinograph meant a necessity to increase the water volume from 162.3 ml to 175.5 mL stepwise (i.e., from 54.1 to 58.5% flour weight) due to the incorporation of non-gluten proteins (from 8.62% up to 14.56%, respectively). On the other hand, such enhancement led to worsened dough machinability in terms of the extensograph deformation energy as well as dough resistance (elasticity).
Methods for the evaluation of the water absorption
As mentioned above, the first notice about the centrifugation method was published by Sosulski (1962), who wanted to develop the the method usable for breeders. Four groups of Canadian wheat flour samples were collected with proteins in the range of 11.0-17.5%; the ash content was not measured. The authors did not also mention determined range of water absorption using the standard method, they pointed to “ baking absorption” of 61.5-65.5%. By the centrifugation, portions of water were from 56.5% to 67.3% flour weight. The authors did not mention the fact that the average range of the farinograph water absorption was about 10 percentage points, while the centrifugation method rendered a mean range of 15 percentage points. Correlation analysis was carried out in several sample subgroups, but the results were provable at level p = 99.9%.
Unbehend et al. (2006) revised the certification procedure using 100-member sets of wheat flour from two harvests (with ash content of 0.55%), two doses of flour, two centrifuge accelerations and two operating times. As within own data, the centrifugation method exhibited larger data scatter with verifiably higher arithmetic mean compared to the control farinograph test, independent on the harvest year and the flour dose used. They determined farinograph absorption in the range of 56-62% flour weight, including both outliers and extremes. Values related to the centrifugation method, unfortunately, could be estimated from box plots only (approximately 46-81%). Both mentioned ranges unequivocally cover own data measured (WA-FAR 50.8-63.2%, WA-CTF 52.6-77.1% flour weight). They stated further, that correlations between farinograph and centrifuge water absorption (through 2 ×2 subsets of harvest years and flour doses) were very tight (0.792-0.936 at p = 99.999, N ≥ 100). In terms of linear regression preciseness, residuals within interval <-1; 1> oscillated between 52% and 86% of the total count of samples. Better fitting of regression reflects a selection of one type of wheat flour containing 0.55% of ash as well as more than two-times robust input dataset.
5. Conclusion
Water absorption of wheat flour is an important parameter of its baking quality. To determine it, standard and at the same time the reference ICC procedure using the farinograph could be characterised as a material- and time-consuming approach. For that reason, the indirect operational methods using the NIR analysers or the centrifuge were developed within the previous century. Within the milling-baking industry, the NIR method spread successfully for the original purpose, perhaps due to its sufficient robustness and accuracy; the centrifugation of swelled gel is a base of another two or three laboratory methods. Comparing the accuracy of both indirect methods used in the study, advantages and disadvantages of the NIR and the centrifugation procedures were outlined for 44 samples of Czech wheat flour characterised by fine granulation. Comparing the original data scatter, the prediction of the farinograph water absorption in the range of 50.8–63.2% of flour weight was more accurate on the base of the NIR data (60.1-67.1% of flour weight). By centrifugation, the data extent was significantly broader, from 52.6% to 77.1% of flour weight. Correlation analysis confirmed similar linear trends among the data gathered using the farinograph, NIR and centrifugation, and, also a very tight dependence on protein and ash contents ( p = 99.9% at least). Owing to this, linear regression was built up on the base of just the protein and ash content of the tested flour samples. Results of the simple linear regression showed similar trends as the original data – considering a difference from -1 to 1 percent point from the original farinograph values, 43% and 25% of tested samples evaluated by the NIR and the centrifugation method, respectively, fell into this tolerance interval. As hundreds of samples are used for the calibration of NIR spectrometers in practice, this pilot study confirmed the sufficient precision of the NIR method.
Author Contributions: In cooperation with the Central Institute for Supervising and Testing in Agriculture in Brno, Czech Republic, T.S. took over 44 analysed samples of wheat flour, characterised by values of the water absorption determined under the reference farinograph method. He then personally measured the counterpart values by using of the NIR spectrometer and the centrifuge. Late but not least, T.S. also revised the final manuscript. Co-author I.Š. performed the statistical sorting and processing of the input dataset and wrote the manuscript itself. Further, he corresponded with the opponents, the language editor as wel as with the editor board of the Journal and finalise the article for publishing.
Funding: Research was supported by the grant ‘MZe RO2023’ of the Ministry of Agriculture of the Czech Republic.
Acknowledgments: Authors would like to thank to the Central Institute for Supervising and Testing in Agriculture in Brno, Czech Republic for providing both the flour samples and the reference farinograph data.
Conflicts of Interest: The authors declare no conflict of interest.