
1. Introduction
Food companies designing new products typically must integrate and balance decisions based on data from sensory panels, consumer preference panels, and laboratory analytical data. Consumers’ perception of food quality and decision on which product to buy is the principal causal motivation to study the functional relationship between subjective evaluations from panel quality tests and objective reproducible data from analytical instrumentation and applied process technology parameters. Hence, adjusting food product quality to consumer's perception is the key factor in marketing and strategy to gain a company's market share leading to higher profit margins. Food quality and safety are major objectives which require advanced process automation, robotics and artificial intelligence (AI). These aspects of 4-the industrial evolution are becoming the key trends in the modern food industry. Presently, numerous modern techniques, including electronic noses and tongues, computer vision, IR and NIR spectroscopy, spectral imaging, and photoacoustic, have been applied to monitor food attributes. In online production lines, these techniques are IoT (internet of things) devices as a part of industrial information structure providing “Big Data'', i.e., large amounts of interrelated digital information (Singham et al., 2015; Bičanić et al., 2015; Zhou et al., 2019; Sahni et al., 2021).
Wine is a typical product for which market demand and pricing are in a wide range of values and strongly depends on quality perception largely evaluated by wine human experts tasting. Wine quality traits, such as sensory profile and colour, are products of complex interactions between grape genomics, macro and micro soil composition, local climate environment and seasonal weather prognosis, management, and winemaking practises. Especially important in wine sensory perception is the effect of its aroma. Wine aroma is a chemically complex interaction produced by the simultaneous perception of multiple volatile compounds and it determines the personal sensory perception of quality. Particularly, the objective wine quality classification according to variety and region is an important issue, because it is an easily adulterated product in terms of dilution of wines with water, the addition of alcohol, mislabelling, and blending with, or replacement by, wine of lesser quality. Objective quality modelling enables optimal wine coupage or assemblage for harmonising from different vintages before bottling. However, human quality evaluations can be influenced by biases due to cultural preferences and individual personal preferences. To eliminate subjective human interventions and possible errors, numerous instrumental methods and statistical software tools are integrated into production decision support systems, aiding the accuracy, speed and quality of the oenologist performance. Applied are UV, VIS, NIR, FTIR spectroscopic methods, gas chromatographic/mass spectrometric analysis (HS-SPME-GC/MS) of volatile aroma compounds, electronic nose and tongue, providing multi-parameter analysis of samples within minutes, eliminating the need to outsource chemical analysis and allowing on-line control and real-time decision making during the winemaking process. Multi-sensor, low-level data fusion can provide a more comprehensive and more accurate vision of results compared with the study of simpler data sets from individual techniques. Data fusion from different instrumental platforms results in an enriched data matrix (digital data frame), integrating information from heterogeneous sources. Data fusion integrates information from multilevel instrumentation and human expert quality evaluation and is applied for machine learning (ML) modelling, AI production decision support, and causal analysis between instrumental data and human quality perception (Legin et al., 2003; Rodriguez-Mendez et al., 2016; Lukić and Horvat, 2017; Izquierdo-Llopart and Saurina, 2021). Also, AI facilitates synergism between experience and recent progress in technology. It can be applied to the development of technological inventions, for example, the application of ultrasonic processing (Lukić et al., 2020). From a process control point of view, AI provides tools for the advanced prediction of quality through recorded patterns through seasons to predict quality traits to winegrowers enabling interventions close to harvest and before winemaking (Fuentes et al., 2020). AI neural networks (NN) and support vector machines (SVM) models based on mid-infrared spectroscopy have been applied to prevent and manage stuck and sluggish wine fermentation (Hernandez et al., 2021). Among numerous ML models applied for physicochemical wine quality prediction are support vector machines (SVM), k-nearest neighbours (k-NN), genetic algorithm (GA), naive Bayes (NB), decision tree (DT), random forest (RF), artificial neural networks (ANN), partial least squares (PLS), and ordinary least square (OLS). Based on the literature, SVM and RF have proved to be the best models (Chiu et al., 2021). However, all of these ML models are knowledge agnostic, and their prediction performances are data set dependent.
Potential systemic errors of ML models are surmounted by probabilistic Bayes belief network (BN) models which integrate and synergize fundamental knowledge with big data sets. Their application in food technology and science is sporadic, but their basic advantages enable transparent inference through graphical representation and reasoning with uncertain knowledge. In contrast to supervisory input/output ML models (neural networks, random forest, fuzzy logic), BN models are based on joint probability function, providing inverse inference and answering questions about about values that are likely to provide target food quality (Corney, 2000; Corney, 2001). The advantage of BN modelling for wine quality has been proved by big data analysis across multiple vintages to define the characteristics of outstanding 21stcentury Bordeaux wines. The analysis is based on data of 985 binary attributes, an additional 14 and 34 continuous attributes covering All Bordeaux (14,349 wine) and the 1855 Bordeaux datasets (1359 wines) to build a model for a wine grade category prediction. The derived BN model outperforms SVM by increasing quality classification accuracy, precision, and the F-score (Dong et al., 2021).
This work aims to provide a potential scientific contribution to understanding wine quality data by applying artificial intelligence (AI) methodologies. The main focus is the application of structural causal modelling (SCM) with deep learning, providing an estimation of the causal effects of intervention decisions in production on wine quality. The described methodology is generally important in the application of causal artificial intelligence in food science and technology.
2. Materials and methods
Data
This work is a causality study of the impact of physicochemical properties on sensory panel quality scores based on a large wine quality data set, available on the publicly available repository machine learning platform at the University of California at Irving (UCI) (UC Irvine 2009; Cortez et al., 2009). The data set contains 1599 red and 4989 white wine sample variants “ Vinho Verde” from the northwestern region of Portugal. The analytical data were measured at the wine certification phase to prevent illegal adulteration. Each subset contains 11 physicochemical tests and average human sensory scores in the range from 0 to 10, obtained by 3 independent evaluations. The data were recorded from May 2004 to February 2007 using only protected designation of origin samples tested at the official certification institute “ CVRVV - Comissão de Viticultura da Região dos Vinhos Verdes”. To avoid human error and/or biases, each quality score is recorded as the corresponding average value. Basic statistics of the data are given in Table 1. The data set has been used for comparative studies of various algorithms for the accuracy of the quality predictions and classification to identify statistical outliers or abnormalities implying possible product adulterations.
Table 1. Basic statistics of physicochemical parameters and quality scores for the red and white “ Vinho Verde” wines data.
Methods
Numerous results of AI methods applied for the prediction and model analysis of wine production and quality assessment are reported in the literature. Applied regression models for quality prediction are multivariate linear ordinary least squares (OLS) regression, neural networks (NN), and support vector machines (SVM). The SVM model yielded the outperforming performance argued due to the training phase yielding global optimum opposite to NN local solutions (Cortez et al., 2009). Decision trees (DT) and Naïve Bayes (NB) networks are applied for classification approaches to quality predictions. Statistical analysis of classification performance shows that the DT algorithm is more accurate than BN, especially for the red wine samples. Analysis of the physicochemical feature importance shows that alcohol and volatile acidity contribute mostly to quality. Also, the models indicate that white wines are more sensitive to physicochemical variations indicating the need for close monitoring and control during the production process (Appalasamy et al., 2012). The genetic algorithm is applied for finding a useful hybrid model for wine quality prediction (Chiu et al., 2021). Grid search applied for improvement of classification by optimal tuning of NN machine learning algorithms yielded improved accuracy over SVM and NB models for both red and white wine datasets (Kothawade, 2021). Besides deterministic and crisp logic ML models, fuzzy logic reasoning is applied to model human perception of wine quality. Non-parametric fuzzy inductive reasoning (FIR) methodology with an ML approach outperforms NN and SVM predictions. From the training process of FIR models, key important parameters inferred are alcohol, fixed acidity, free sulphur dioxide, residual sugar and volatile acidity (Nebot et al., 2015). Synergy effects, due to the nonlinear interaction of the physicochemical parameters, are inferred by extending the least absolute shrinkage and selection operator (LASSO) models. 20 nonlinear interactions, quadratic terms and bivariate products of the key parameters are included. The nonlinear effects proved to be significant and, compared to linear models yielded, improved quality predictions (Nelson, 2020).
Published results of ML models show a strong dependency of prediction accuracy on choices of several untransparent algorithm parameters which are not related to the nature of the data. Due to the interaction between physicochemical parameters, there are significant covariate correlations preventing the determination of the importance of individual parameter importance and causal relation to the human perceived quality. To resolve the complexity of the problem, here are proposed causal analyses based on the Bayes network (BN) approach. The BN networks are nonsupervised stochastic models of the joint probability function. They are transparently presented as directed acyclic graphs (DAG) of causal relations between the covariates, i.e., the physicochemical parameters and the quality. Causal functional relations between covariates multivariate include linear and nonlinear functions. The DAG graph connects physicochemical variables Xi, i = 1,2..11, and quality Y as connected nodes with directed edges representing conditional statistical dependencies. The nodes which are not directly connected are conditionally independent, however, they can be significantly statistically correlated. Each node Xi represents a random variable and is associated with the corresponding probability density function P dependent on input nodes as its parent ( par) nodes Xk. Based on conditional independencies relations the global probability density function P can be factorised into individual node probabilities corresponding to the graph edges presented, i.e., modelled:
(1)
The BN modelling is a two-stage process in which firstly is determined a DAG structure, followed by the estimation of local parameters for each individual conditional probability function (Nagarajan et al., 2013; Scutari and Denis, 2014; Kurtanjek, 2022). The hypothesis of DAG structure is the most important issue of the modelling and is inferred by deduction from knowledge of the nature of the studied system, and by statistical inference of conditional independence from experimental data. The availability of “Big Data” is important for the accurate estimation of conditional independence and parameters of probability functions. However, the structural information required for DAG is not uniquely determined only by data statistics. To find the DAG structure from a set of alternative structures selected the network structure with the best goodness-of-fit on the whole data. The metric of Bayes Information Criteria (BIC) evaluated as a balance between a model evaluated the likelihood of a whole data set and model complexity determined by the number of model parameters and the number of samples is applied.
Unlike data scientist interest for model classification and predictions P( Y| X), to food scientists and engineers the main focus is the determination of causal relationships between potential action (intervention) and expected effect by “doing”, i.e., P( Y|do( X= x)) (Pearl and Mackenzie, 2018; Pearl et al., 2021). Determination of causality enables scientists and technologists to make decisions and apply control action to improve a production process. This work is a study of the causal impact between wine physicochemical properties and oenologist quality evaluations. Due to the strong correlation between covariates observation of causal effects is confounded and usually biased just by the usual correlation of observations. Graphical structural presentation of BN models enables detection and prevention of noncausal data “back door flows”, resulting in the erroneous and possibly contradictory inference of causal relations. By imposing action (intervention) probability distributions are changed:
(2)
J. Pearl defined the back-door criterion for blocking confounding effects by closing pathways responsible for the interference of covariates with causal action (Pearl and Mackenzie, 2018; Pearl et al., 2021). Back-door criterion defines adjustment sets Z of covariates relative to an ordered pair ( Xi, Xj) if: (i) no node in Z is a descendant of Xi, and (ii) Z blocks every path between Xi and Xj that contains an arrow into Xi. If the effect of X on Y is identifiable, with available observed covariates, then the deconfounded BN model becomes a structural causal model (SCM), with the probability distribution of the causal effect given by:
(3)
Although numerical evaluation of causal inference is very demanding, the availability of DoWhy Python package on the free and open-source platform GitHub makes it applicable to food technology researchers. DoWhy is a state-of-the-art application of refutation programming interface (API) which automatically tests causal assumptions for any estimation method, thus making inference more robust and accessible to non-experts (Pearl et al., 2021).
3. Results
The data sets for red and white wine qualities are observational (non-random) and are separately analysed and applied for the development of the models for quality predictions and causal analysis. Developed linear regression models are estimated by ordinary least squares (OLS) algorithm, non-linear random forest (RF) for quality classification and regression and structural causal model (SCM) based on Bayes networks (BN). The models for prediction are evaluated externally by training to test data splitting by k-folding and boot-strapping, while causal models are focused on internal structural validation evaluation of adjustment sets to block confounding by backdoor non-causal “flow” of statistical dependencies of interrelated physicochemical properties. To minimise confounding initially, the data sets are scanned for variable inflation factors (VIF) (Lin et al., 2021). VIF factors measure the extent by which estimated variances of regression model parameters are “inflated” due to the existence of multicollinearity among the predictor variables A VIF of 1 corresponds to a lack of correlation among the k-th predictor and the remaining predictor variables, and hence the variance of the corresponding regression parameter and the rest of the model parameters are deflated. As a rule of “thumb” VIF value exceeding 4 needs variable adjustments. The VIF values for red and white wine data sets are listed in Table 2. The variable density has the highest VIF values, 6.34 and 28.23 corresponding to red and white wines. From a causal point of view, density is a collider conditioned on residual sugar and alcohol. At the same time, it is plausible to assume that human sensory response is sensitive to small but statistically significant density variation. Hence, the original data sets are adjusted by elimination of the variable density. The impact of the collider removal on each of the predictor VIF value is significant decrease, on average from 3.10 to 1.94 and 5.65 to 1.43 for red and white wines correspondingly. Prior to causal analysis, predictive models for quality regression by linear ordinary least squares (OLS), nonlinear regression and classification by machine learning algorithms (RF), and determination of the predictor variable importance are developed (Breiman, 2001; Liaw and Wiener, 2002; Chen et al., 2016; Breiman and Cutler, 2022; Chen et al., 2023).
Table 2. Variance inflation factors (VIF) for the original (un-adjusted) and adjusted models for the prediction of the quality of the red and white wines
Statistical metrics of the models are given in Table 3. Accuracies of the regression models are evaluated by relative average root square error (RMSE %) with untrained 5-folded data sets. The average RMSE % by linear OLS is 12.7% and is not affected by the collider removal, however, it significantly changes the model parameter estimates and their significance. It is important to note that estimated coefficients of the linear model may not have any causal meaning, i.e., cannot be applied to technological decisions. For nonlinear regression, extreme gradient boosting algorithm (XGBoost) is applied (Chen et al., 2016; Breiman and Cutler, 2022; Chen et al., 2023). Since the XGBoost algorithm iteratively approaches the maximum of the objective function by gradient evaluation in functional space, it is generally recommended for evaluation of predictor importance. Average RMSE % are 5.13 and 4.17 for red and white wine, respectively. The decrease in errors for factor 2.5 is due to the account of nonlinear predictor dependencies and their interactions. Random forest (RF) algorithm is applied for multivariate prediction of quality by classification and regression. RF classification algorithm predicts a discrete variable (quality classes from 0 to 10), while the regression model predicts quality as a continuous function in the range [0,1]. Since the random forest algorithm is based on randomly selected subsets of data, the original data sets are resampled to avoid class sampling bias by yielding a uniform distribution of the quality classes. For metrics of multivariate classification metrics, class average relative accuracy, precision, recall and Fisher quotient are applied, Table 3. Comparison of the regression and classification models by decision tree ensembles is on the average accuracy level of 95%.
Table 3. Statistical metrics of the model fits for quality classification and regression prediction
| model | classification | regression | ||||
| method | random forest RF | RF | OLS | |||
| wine | accuracy % | precision % | recall % | F | RMSE % | RMSE % |
| red | 92.1 | 91.8 | 92.1 | 0.918 | 5.13 | 12.96 |
| white | 95.2 | 97.3 | 96.3 | 0.965 | 4.17 | 12.52 |
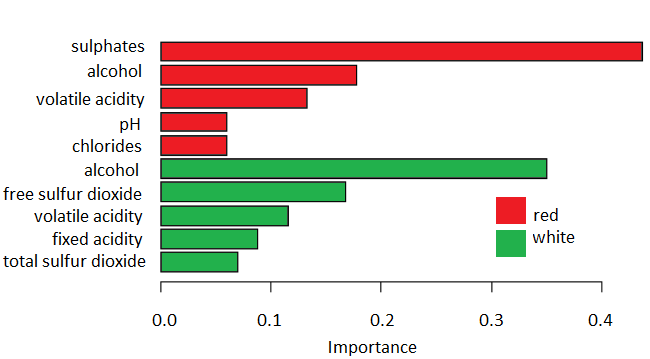
Figure 1. Importance of the first five physicochemical variables for wine quality prediction by random forest classification and with regression by the extreme gradient boosted random forest models
Gradient boosting provided physicochemical importance based on the trained quality predictive models, with relative scores depicted in Fig. 1. The first five scores which account for about 90% of the total score are presented. The main distinction between red and white wines is in the most important variables. It shows that for the prediction of red wine, quality is the number of sulphates present in samples, but for white wine quality, it is the level of alcohol. However, due to strong interdependences between physicochemical properties, the obtained variable importance scores for predictions are different from causal importance.
Discovering causal relations from observational data is complex and difficult, however, it is a main focus of science (Pearl and Mackenzie, 2018; Pearl et al., 2021). In principle, hypotheses of causal structures are deducted from prior knowledge of natural laws of physics and chemistry and induced from new experimental and observed data. Besides statistical estimation of causal effects, causal analysis is based on structural knowledge represented as directed acyclic graphs (DAG). In this work a constrained inductive PC-stable algorithm is applied (Kalisch et al., 2012; Kalisch et al., 2023; Scutari et al., 2023). The algorithm starts with a complete, undirected graph and deletes recursively edges based on tests of conditional independence decisions. The inferred DAG networks for the red and white wine sets are presented in Fig. 2. The graphs are obtained with significance level α=0.05. Depicted are the significances of the graph edges (arcs) by which are measured change of score of the network if the arc is not present (Breiman and Cutler, 2022). The corresponding BN models are validated by RMSE% of quality prediction with the training data sets. 11.1% and 10.73% errors for the red and white wine datasets are obtained. Since a linear structured BN model, these values are close to the values obtained by the linear unstructured OLS models (Table 3). Somewhat smaller errors are likely due to an increase of the degree of freedom by BN.
Inference of causality between physicochemical variables Xi and wine quality Y from given DAG networks requires d-separation, i.e., blocking of “back door” non-causal interference. Required adjustment sets Z satisfies the following conditions: (1) no variable (graph node Xk) in Z is a descendent of Xi ; (2) Z blocks every pathway between Xi and Y that contains an arrow pointing to Xi (Pearl, 2021). Enumeration of Z adjustment sets of the covariates, as given in Table 4, allows unbiased estimation of individual physicochemical causal effects from observational wine data (Textor et al., 2016; Textor et al., 2021).
Table 4. Adjustment sets for prediction of wine quality by physicochemical properties
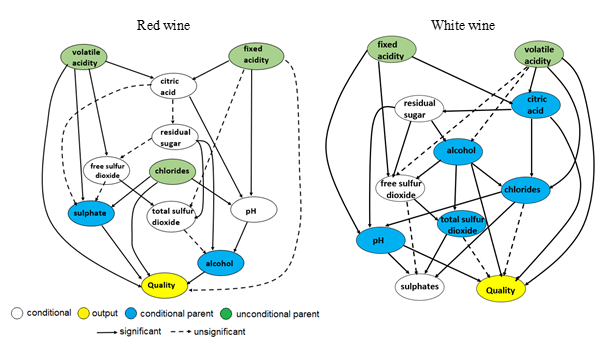
Figure 2. Directed acyclic graphs (DAG) of red and white wine data sets
Application of Bayes network (BN) structured models and adjustment sets Z enables elimination of systemic bayes, however random exogenous influence through sampling and experimental errors are present in data as a challenge for estimation of do(x) causality for individual psycho-chemical parameters. Here are applied Bayes neural networks (BNN) with a single feedforward hidden layer to account for the nonlinearity of causal dependences and quantify the uncertainty associated with stochastic influences. The Y=BNN(x, Z) are supervised models with observed quality data Y, set x value of cause X, and Z adjustment set of covariates, as given in Table 4. The conditional probability of causal effect (Zhao and Hastie, 2021; Jia, 2018; Scott, 2022) is defined by:
(4)
The integral is evaluated by Gibb’s sampling of the conditional probability function and averaging with N samples for the red and white sets:
(5)
The causal functions are graphically presented as partial dependency plots Fig. 3-4. In Fig. 3 causal graphs for red wines are depicted. The graphs 3.1-3 correspond to the direct effects of alcohol, volatile acidity and sulphates. Alcohol and sulphates are conditioned on other endogenous variables, while sulphates are unconditioned and are solely influenced by unobserved exogenous variables. Alcohol and fixed acidity are the most important causal variables with positive and negative effects. Sulphates exhibit a strong nonlinear effect with a distinct maximum and considerable dispersion of prediction due to unobserved exogenous variable(s).
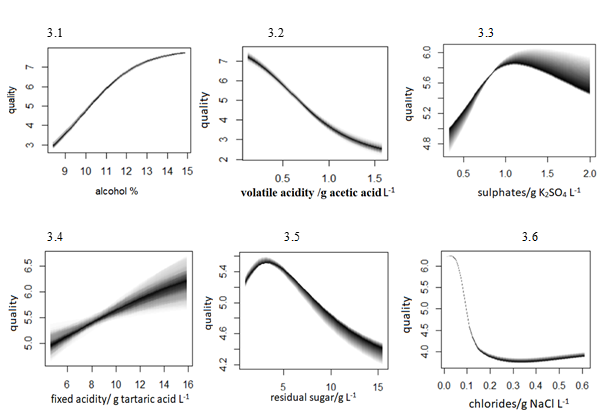
Figure 3. Causal graphs for the red wines
Effects of fixed acidity, residual sugar and chlorides are depicted in Fig. 3.4-6. Fixed acidity and chlorides have a direct causal effect on quality, while residual sugar has an indirect effect mediated by alcohol content. Effects of fixed and volatile acidities are in balance resulting in an increase of quality with an increase in fixed and decrease of volatile acidity. The sensitivity of quality to fixed acidity is considerably lower compared to volatile acidity, and is highly dispersed possibly due to interference with other endogenous variables and/or influence of unobserved exogenous effects on fixed acidity. Increase of residual sugar decreases quality of red wine. However, it shows a maximum at 3 g L-1. Causal effect of chlorides in red wine shows strong nonlinearity. The increase of NaCl from negligible small concentrations results in sudden decline in quality for 25%. Causal graphs for white wine are depicted in Fig. 4.1-6. Causal effects of alcohol, volatile and fixed acidity are depicted in Fig.4.1-3.
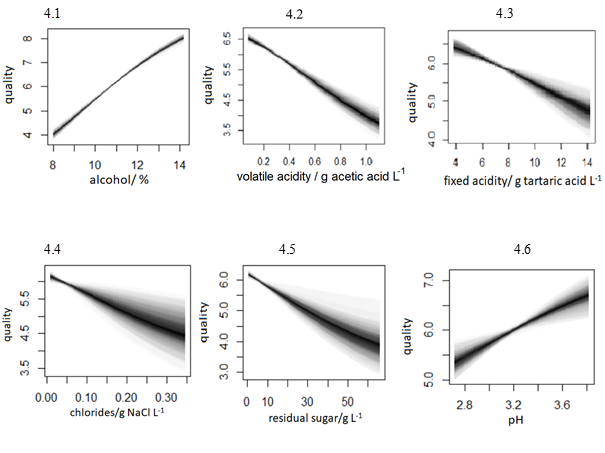
Figure 4. Causal graphs for the white wines
Volatile acidity and alcohol have a direct causal effect on quality, while the effect of fixed acidity is mediated by pH. Alcohol is the most important causal variable conditioned on residual sugar Fig. 4.5. Unlike red wine, for white wine volatile and fixed acidity are positively correlated, and an increase in acidity causes a decrease in quality. Increase in pH, Fig.4.6, results in an increase in quality. The effect of an increase of chlorides proportionally decreases quality and is highly dispersed at higher concentrations. Sulphates are a network collider hence they have no effect on white wine quality. However, for red wine sulphates are important direct causal variable. A general observation is that network of conditioned causalities for the white wine dataset is more complex (interrelated) when compared to the red wines.
4. Conclusion
Inspection of the data sets by variable inflation factor VIF analysis reveals the density as a common collider for red and white wine samples. Adjustment of the original data sets by removal of the collider decreases the average VIF for the red data from 3.1 to 1.94, and for the white from 3.65 to 1.43. The adjustment has an insignificant increase in trained RMSE errors. However, it significantly changes the values and significances of the OLS model parameters and significantly decreases RMSE with untrained “new” data. The importance of nonlinearity and variable interactions are inferred from the increase of the prediction accuracy from the linear OLS model with RMSE= 90% to higher accuracy RMSE=95% by random forest regression and classification.
The main conclusion of the causal analysis is the inference of physicochemical variables which have a direct effect on quality tests. Although the predictions by random forest ML models have very high accuracy, relative RMSE = 5%, the variable importance for prediction is not the most important causal variable. Derived Bayes network models provide an inference of the variables which have a direct effect on the quality. For the red wine data set, the first three most important variables for ML prediction are sulphur, alcohol, and volatile acidity. However, the most important causal effect is associated with volatile acidity, alcohol and sulphur. Also, the most important variables for ML prediction of the white wine data set are alcohol, free sulphur dioxide, and volatile acidity, while the most important causal are alcohol, volatile acidity and residual sugar. Alcohol content has a distinctly positive effect on human quality prediction. For the red wine data, sulphates have a direct causal effect with a central maximum at 1 g K2SO4/L. However, for the white wine, it is a collider and has no effect on its quality.
Minimal adjustment sets are inferred by the BN “parent” variables and enabled functional causal dependence. Application of Bayes neural networks (BNN) enabled graphical causal depictions as partial dependence plots. A marked difference is that the red wine causality dependencies are mostly nonlinear, while for the white are approximately linear. The important outcome of the BNN models is the evaluation of probability dispersions of the causal predictions. They show heteroscedasticity, i.e., dependencies of variances of predictions on corresponding concentrations.
The obtained high model prediction accuracy of 95 % and the causal models have potentially important technologically applicable interventions in the wine industry. For example, it is a standard procedure to monitor the grape sugar before harvesting and accordingly adjust residual sugar in a production phase based on producer-specific experience and “standard” recommendations. However, these traditional adjustments do not account of varying covariates. The proposed causal model provides predictions and optimisation with full knowledge of wine analytics and controllable sugar level during fermentation for the needs of a specific producer and vintage. The model also provides the causal impact of other controllable variables, such as volatile acidity produced during the malolactic fermentation in red wine depending on the engineer control activity of lactic bacteria.
Another important application of the model is the prediction of the optimal “formula” for wine assemblage and “coupage”. The model classification accuracy enables adjustment of wine production to increase producer revenues for targeted markets (sub-branding) that match defined subpopulation preferences. Importantly, causal Bayes network models can be also used in control laboratories to check product adulteration, if a claim declared on the label is truthful regarding the wine’s vintage, geographical origin and/or non-declared sugar addition or dilution with water.
Full potential of “big data” BN causal models is obtained with complexity when physicochemical data are integrated with other important technical parameters (temperature and micro-oxygen profiles), soil chemistry, agrotechnical measures, vineyard geography, local climate and key genetic data. According to J. Pearl, causal hierarchy models provide three basic levels of inference: (1) prediction of simulated complex scenarios based on intuitive past knowledge of vintage records; (2) intervention policies for the improvement of agricultural measure in vineyards, post-harvest treatment and wine fermentation control; (3) and counterfactual inference of new production technology and innovative specifications for wine increased quality and revenue to targeted markets.
Author Contributions: This author is the only contributor.
Funding: This work has not received any funding or any other support.
Acknowledgments: In this section you can acknowledge any.
Conflicts of Interest: This author declares that there is no conflict of interest.