
1. Introduction
The physico-chemical composition of water, i.e. the occurrence and proportion of individual anions and cations in water for human consumption, is affected by the origin of the water and the method (the technology) of processing water intended for human consumption. Numerous researches and epidemiological studies point to the problem of long-term or lifelong exposure to certain substances from water that can cause harmful effects on human health (Nordberg, 1990). The effect resulting from exposure to a chemical element or compound depends on the contamination present and the amount of intake (Stražanac et al., 2018). The presence of some of the most common contaminants in water for human consumption, such as aluminum, cadmium, chlorate and chlorite, nitrates and mercury, is regulated by the guidelines of the World Health Organization (WHO) (WHO, 1996; WHO, 2003a; WHO, 2003b; WHO, 2004; WHO, 2018).
Aluminum is the third most common element present in the earth's crust, and soils often contain 3 to 10% of this metal. In groundwater, aluminum concentrations are usually lower than 500 pg/L at a pH above 6 (Nordberg, 1990). Aluminum levels in water for human consumption vary depending on the levels found in the source water or on aluminum coagulants that are used during water treatment (WHO, 2003b). Elevated aluminum concentrations can represent a potential risk to human health, resulting in brain changes that are characteristic of Alzheimer's disease (Rondeau et al., 2000). Aluminum can also accumulate in bones, causing them to become excessively brittle and soft, resulting in osteomalatia and osteodystrophy. Subsequent studies established the importance of the dynamics of aluminum penetration into the brain and kidneys and its connection with atrophic lateral sclerosis and Parkinsonism associated with dementia (Krupinska, 2020). Patients with chronic kidney disease (CKD) can also be at risk if aluminum level is not controlled (Tsai et al., 2018).
Water pollution with cadmium can result from the natural erosion of cadmium-bearing rocks, industrial dust/waste, from fertilizers, pigment production, smelting and plasticizer production and the corrosion of galvanized water pipes (WHO, 2004). It is extremely toxic, even at low concentrations, because it bioaccumulates in the body and in ecosystems. It has a long biological half-life in the human body, ranging from 10 to 33 years. Long-term exposure to cadmium causes kidney damage (Decharat and Pan-in, 2020), and it is also associated with bronchitis (lung damage) and anaemia. Numerous studies show that children are more sensitive to cadmium absorption, which can be seen in reduced bone strength (replaces calcium), increased bone loss and reduced birth weight. Cadmium can also negatively affect the nervous system and result in learning and behaviour problems (Nordberg, 1990).
Mercury occurs in nature as a result of a series of natural processes (WHO, 1996). Health risks related to mercury exposure differ depending on whether it is inorganic or organic mercury, or whether it is acute or chronic exposure. The peculiarity of the harmful influence of mercury is its ability to cause disorders in any tissue with which it comes into contact in sufficient concentration (HAH, 2014).
Chlorites and chlorates are disinfection by-products that arise from the use of chlorine dioxide as a disinfectant, odour and taste control agent in water. In water, chlorine dioxide breaks down quickly and mainly creates inorganic by-products such as chlorite, chlorate and chloride ions, whereby chlorite is the predominant by-product (HAH, 2016). Chlorate, however, may also be present in treated water when sodium hypochlorite is used for disinfection as a result of the degradation of hypochlorite solution that is not properly stored. Toxicological studies conducted on animals point to the development of haematological damage (haemolytic anaemia and methemoglobinemia), while neurologic damage in neurological development is also observed. Furthermore, delays in sexual development in females, changes in thyroid function and soft tissue anomalies are attributed to chlorine dioxide, especially due to exposure to chlorate (Righi et al., 2012).
The main anthropogenic source of nitrogen in the environment is nitrogen fertilizers, the application of which has increased exponentially in the last fifty years (Ward et al., 2018). As a result of the degradation of nitrogen fertilizers, ammonia is first created, which then oxidizes to nitrates and nitrites. Under the influence of atmospheric conditions, or as a result of irrigation, these compounds reach underground water, watercourses, as well as water pumping stations. Another source of these compounds is the result of industrial activity, where nitrogenous compounds are present in the air in the form of aerosols, and again enter the same cycle of circulation in nature, as previously described (WHO, 2003a). Considering the available studies and research results, evidence suggests a link between nitrates in water for human consumption and adverse health outcomes (apart from methemoglobinemia) for colorectal cancer, thyroid disease, and neural tube defects. The regulatory limit for nitrates in public water for human consumption supplies was set to protect against methemoglobinemia in infants. However, other health effects were not considered (Ward et al., 2018).
This paper presents an assessment of the exposure of the population of the city of Zagreb to contaminants (aluminum, cadmium, chlorate and chlorite, nitrates and mercury) originating from water for human consumption during a five-year period, from 2016 to 2020, and the share in relation to the health-based guidance values (HBGV).
2. Materials and methods
Water for human consumption - Sample analyses
Samples of water for human consumption were sampled from the public water supply system, local water supply systems and sources of local water supply systems in the City of Zagreb during different seasons in the time period from 2016 to 2020 as a part of the monitoring of water for human consumption, in accordance with the Ordinance on parameters compliance, analysis methods, monitoring and safety plans for water for human consumption and the way of keeping the register of legal entities that perform the activity of public water supply ("Official Gazette" 125/17 and 39/2020). Sampling points are distributed in water supply zones according to the amount of water supplied for each individual zone.
The sampling of water for human consumption was carried out in accordance with HRN ISO 5667-5:2011 and HRN EN ISO 19458:2008 standards. Sampling was carried out by employees of the Health and Water Quality Department of the Teaching Institute for Public Health "Dr. Andrija Štampar", according to sampling locations distributed in water supply zones in compliance with the amount of water supplied for each individual zone.
Preparation of samples for anion analysis included filtering through a membrane filter (pore size 0.45 µm, diameter 25 mm, producer VWR International) using a plastic syringe into cuvettes. Filtration prevents the adsorption of anions on suspended particles and the conversion of anions under the influence of bacteria.
ISO method and instrument used for analyses are listed in Table 1.
Table 1. List of ISO method, instruments and HBGV1 for the contaminants being observed
1HBGV= Health-based guidance value;2ARfD= Acute reference dose;3 ADI= Acceptable daily intake;4 TWI=Tolerable weekly intake;5 TDI=Tolerable daily intake; b.w.=body weight
Exposure assessment
The assessment of human exposure to aluminum, cadmium, mercury, chlorates, chlorites and nitrates, introduced through the consumption of water, was calculated using the average of analytical results determined for the mentioned contaminants and recommended water daily intake (EFSA, 2010; Table 2). The average was calculated by using three approaches. The "lower bound" (LB) approach meant that in cases where no value above the limit of quantification (LOQ) was determined, zero (0) was used for calculation value, the "middle bound" (MB) approach, when half the value of LOQ was used and an "upper bound" (UB) approach, when the full amount of LOQ was used.
Table 2. Recommended water daily intake and assumed body weight
| Recommended water daily intake / L | Assumed body weight* / kg | |
|---|---|---|
| 6-12 months | 0.8-1.0 | 8 |
| 1-2 years | 1.1-1.2 | 10 |
| 2-3 years | 1.3 | 12 |
| 4-8 years | 1.6 | 16 |
| boys (9-13y) | 2.1 | 28 |
| girls (9-13y) | 1.9 | 28 |
| men (>14y) | 2.5 | 70** |
| women (>14y) | 2.0 | 70** |
*CentarZdravlja, 2019
**EFSA, 2012
The result of the assessment for each contaminant is presented as the amount of daily intake and as the relative share of the Health-based guidance value (HBGV; Table 1). Contaminant daily intake was calculated using recommended daily water intake and the average value for the contaminant. For the calculation of HBGV share, body weight data from Table 2 were used.
Statistical processing was done in the Microsoft Office Excel Microsoft 365.
3. Results and discussion
Results for aluminum are shown for MB approach. Average annual values were quite diverse, a large range of values was observed between individual samples, as well as a significant difference in the number of samples in which the determined value was above the LOQ. (Table 3). The proportion of intake obtained for all three HBGV values for aluminum was low, below 1%, and quite similar. For aluminum, ARfD and ADI have the same value, and the shares in HBGV are also equal, while for TWI it is slightly higher, because it is a weekly value that is nevertheless very similar to ADI (Table 6).
Table 3. Aluminum results - basic statistical processing by year for MB approach
| Value | 2016 | 2017 | 2018 | 2019 | 2020 |
|---|---|---|---|---|---|
| N | 93 | 67 | 114 | 86 | 116 |
| N > LOQ | 50 | 8 | 18 | 7 | 36 |
| Average* | 11.81 | 7.15 | 4.91 | 4.06 | 10.13 |
| Minimum* | 2.5 | 2.5 | 2.5 | 2.5 | 2.5 |
| Maximum* | 190 | 235 | 74.5 | 41.6 | 170 |
N=number; MB=middle bound; N=number; LOQ=limit of quantification; * µg/kg
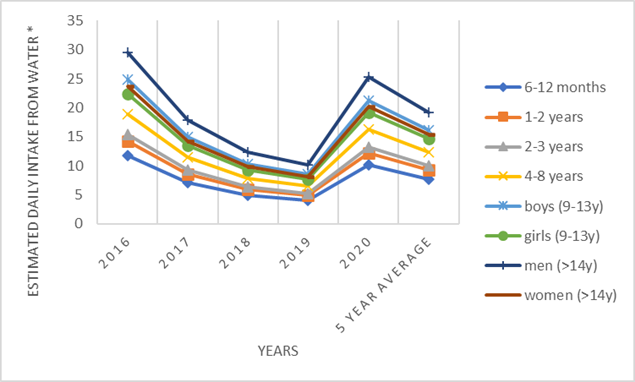
Figure 1. Estimated daily intake for aluminum from water for different population groups
The values obtained for cadmium were quite uniform throughout the observed period (Table 4) and characterized by a small number of samples above the LOQ (0.1 µg/kg), which had the effect that the average value for all years was almost the same. In this case, we chose the UB approach, i.e., the worst assumed scenario, for the reason that, due to the low LOQ values, there are no significant differences in exposure when compared to the MB and LB approaches. The share of cadmium intake in the set TWI ranged up to 3% for the population groups of children, while it was lower for adults (<1%; Table 6).
Table 4. Cadmium results - basic statistical processing by year for UB approach
| Value | 2016 | 2017 | 2018 | 2019 | 2020 |
|---|---|---|---|---|---|
| N | 94 | 68 | 54 | 87 | 117 |
| N > LOQ | 3 | 2 | 0 | 1 | 1 |
| Average* | 0.11 | 0.11 | 0.1 | 0.1 | 0.1 |
| Minimum* | 0.1 | 0.1 | 0.1 | 0.1 | 0.1 |
| Maximum* | 0.68 | 0.31 | 0.1 | 0.2 | 0.21 |
UB=upper bound; N=number; LOQ=limit of quantification; *µg/kg
The results for mercury in water are shown for the LB approach (Table 5), which means that in cases where the value of the sample result was below the LOQ value, zero was used instead. This approach was chosen, because the results of the analytical report are reported lower than a 0.1 µg/kg, which is higher than the LOQ value of 0.05 µg/kg. If we use these higher values, obtained results could lead to an unrealistically high exposure compared to the actual situation, having in mind that a small number of samples were above LOQ value. The average annual values are higher in the last two observed years, which is accompanied by an increase in the daily intake from water (Figure 2). However, the share of mercury intake in TWI value (EFSA, 2012) is significantly below 1% (Table 6), which is in accordance with the obtained generally low values for the presence of mercury. Table 5. Mercury results - basic statistical processing by year for LB approach
| Value | 2016 | 2017 | 2018 | 2019 | 2020 |
|---|---|---|---|---|---|
| N | 94 | 68 | 117 | 87 | 117 |
| N > LOQ | 3 | 1 | 1 | 4 | 7 |
| Average* | 0.004 | 0.002 | 0.001 | 0.016 | 0.009 |
| Minimum* | 0 | 0 | 0 | 0 | 0 |
| Maximum* | 0.15 | 0.13 | 0.11 | 0.55 | 0.22 |
LB=lower bound; N=number;; *µg/kg
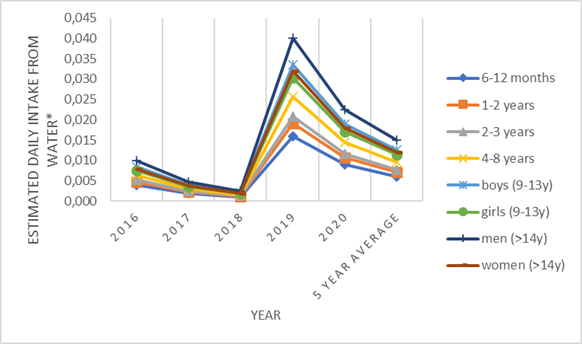
Figure 2. Estimated daily intake for mercury from water for different population groups
Table 6. Share of aluminum, cadmium & mercury in HBGV1 for different groups (%)
1HBGV= Health-based guidance value;2ARfD= Acute reference dose;3 ADI= Acceptable daily intake;4TWI=Tolerable weekly intake
In the assessment exposure for chlorate, the LB approach was used, because during the observed period there was a change in the analytical method, which caused a difference in the LOQ value specified for the old and new results. It was necessary to equalize the results, which was obtained by using a zero value (Table 7). There is a relatively small number of samples in which a value above the LOQ was determined. The presence of chlorate in water has no major annual oscillations compared to average values (Fig. 3). The share of chlorate intake in ARfD is around 1%, while in TDI is somewhat higher, especially for the group of children up to 8 years old when it exceeds 10% (Table 10).
Table 7. Chlorates results - basic statistical processing by year for LB approach
| Value | 2016 | 2017 | 2018 | 2019 | 2020 |
|---|---|---|---|---|---|
| N | 94 | 68 | 119 | 86 | 118 |
| N > LOQ | 8 | 6 | 6 | 8 | 10 |
| Average* | 3.02 | 2.28 | 2.91 | 4.66 | 4.66 |
| Minimum* | 0 | 0 | 0 | 0 | 0 |
| Maximum* | 57 | 60 | 166 | 97 | 84 |
LB=lower bound; N=number; *µg/kg
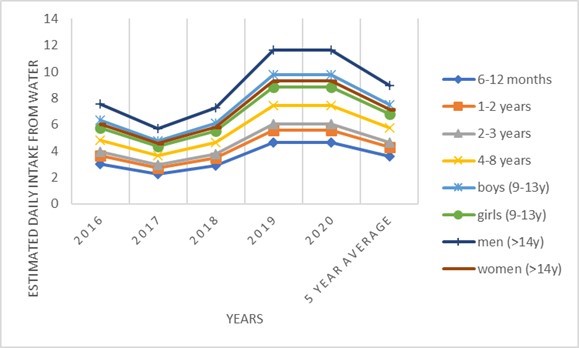
Figure 3. Estimated daily intake for chlorate from water for different population groups
The MB approach was used to estimate exposure to chlorites, and it was determined that their presence in water was very uniform in the observed period, which refers not only to the average value, but also to the number of samples per year that have a value above the LOQ, as well as to the highest determined values (Table 8). Given the uniform values for the presence, the intake per year was also uniform. The share of chlorites intake in TDI was below 1% for the adult population, while it did not reach 2% for the other groups (Table 10).
Table 8. Chlorites results - basic statistical processing by year for MB approach
| Value | 2016 | 2017 | 2018 | 2019 | 2020 |
|---|---|---|---|---|---|
| N | 94 | 68 | 119 | 86 | 117 |
| N > LOQ | 3 | 2 | 2 | 1 | 2 |
| Average* | 5.18 | 5.32 | 5.29 | 5.27 | 5.53 |
| Minimum* | 5 | 5 | 5 | 5 | 5 |
| Maximum* | 12 | 18 | 25 | 28 | 38 |
LB=middle bound; N=number; *µg/kg
The MB approach was used to estimate nitrate exposure. For this contaminant, it was noticed that a large number of samples are sampled every year and that the presence of nitrates above the LOQ was determined in all samples (Table 9). However, the average annual values are quite uniform and follow insignificant oscillations in the annual averages. The share of nitrates intake in the ADI is quite high for all groups in the population, but it is more than twice as small in the group of adults (Table 10).
Table 9. Nitrates results - basic statistical processing by year for MB approach
| Value | 2016 | 2017 | 2018 | 2019 | 2020 |
|---|---|---|---|---|---|
| N | 1158 | 799 | 913 | 1299 | 1211 |
| N > LOQ | 1158 | 799 | 913 | 1299 | 1211 |
| Average* | 13.60 | 13.27 | 14.28 | 12.85 | 13.08 |
| Minimum* | 1.2 | 0.8 | 1.3 | 1.2 | 0.3 |
| Maximum* | 27 | 29 | 25 | 23 | 60 |
MB=middle bound; N=number; *µg/kg
Table 10. Share of chlorates, chlorites & nitrates intake in HBGV1 for different groups (%)
1HBGV= Health-based guidance value;2ARfD= Acute reference dose;3 ADI= Acceptable daily intake;4TDI=Tolerable daily intake
4. Conclusion
In the monitored five-year period, the annual exposure was fairly uniform for cadmium, chlorites and nitrates, with smaller deviations for aluminum and chlorates, and the largest for mercury. However, mercury was determined in very small amounts and for the highest determined amount the share of TWI was below 0.5%. All monitored contaminants had a relatively small number of samples in which the determined value was higher than the LOQ, except for nitrate where all samples had an amount higher than the LOQ. For aluminum intake, the share of HBGV was below 1%, for chlorates around 1%, for chlorites up to 2%, for cadmium around 3%, while the highest was for nitrates, ranging from 10.32 to 39.75%. The intake for each contaminant was the highest for the lower age groups in the population, up to 14 years.
The population's exposure to aluminum, cadmium, mercury, chlorate, chlorite and nitrate from water for human consumption was generally low (except for nitrates), which was to be expected considering the fact that none of the monitored contaminants was determined in quantity higher than the prescribed maximum level. However, since the aforementioned contaminants can be introduced into the body through other foods, it is important to keep in mind the possibility of their intake with water when making these assessments. Special attention should be paid to the intake of nitrates in small children, because their share taken from water is on the second place, just behind the intake of leafy green vegetables.
Water for human consumption represents an important medium for the intake of substances that are its constituent parts. Water represents a specific part of the food chain, because, in addition to being consumed daily, it is usually consumed in larger quantities, as recommended. Citizens are also exposed to a uniform and constant influence of contaminants from water, due to the fact that the availability of water is closely related and limited to the area of permanent residence. Geographically different places, where water is collected or pumped, contribute to its different and uneven composition. Therefore, it is preferable to carry out monitoring locally, because sometimes a distance of several tens of kilometres is enough to obtain a completely different chemical composition of water. Exposure assessment is necessary for taking measures to reduce the presence of certain contaminants. Besides, multi-year monitoring results contribute to spotting any deviations as soon as possible in order to avoid more extensive adverse consequences.
Author Contributions: Conceptualization, B.H.; methodology, B.H., J.P. and A.G.B.; validation, B.H. and J.P.; fieldwork, S.T., D.G. and J.B.; laboratory analysis, S.T.; investigation, B.H., J.P. and S.T.; resources, B.H., J.P., S.T., D.G. and J.B.; writing—original draft preparation, B.H., J.P., A.G.B.,S.T.; writing—review and editing, B.H., J.P., A.G.B.,S.T., D.G. and J.B.; visualization, B.H., J.P. and A.G.B. All authors have read and agreed to the published version of the manuscript.
Funding: This research received no external funding.
Acknowledgments: The authors would like to thank the City Office for Social Protection, Health, Veterans and Persons with Disabilities of the City of Zagreb for permission to use the water monitoring data.
This work was supported by the European Regional Development Fund and the Croatian Ministry of Science and Education under project the Center for the Safety and Quality of Food (KK.01.1.1.02.0004).
Conflicts of Interest: The authors declare no conflict of interest.