
Introduction
Salt (NaCl) is one of the most common additives used in food processing systems. Some of the main characteristics of foods such as flavour, texture and colour is affected by changes in the salt content used in their manufacture (Soltani et al., 2015). However, it was reported that consumption of food products with high salt content may present a risk for human health and can lead to hypertension and cardiovascular diseases. Therefore, in accordance with recommendations for reducing dietary intake of sodium chloride, health authorities emphasize the reduction of salt used in food production (Saint-Eve et al., 2009).
Salting is applied in various phases during cheese manufacturing to improve the flavour, texture and colour of cheese, but also to achieve some other positive effects such as controlling the metabolism of microorganisms, restricting the activity of enzymes, increasing the shelf-life by reduction of water activity and inhibiting the germination of microbial spores (Guinee and Fox, 2017). The composition, protein hydration, enzymatic activity, ripening rate and quality of cheese are also affected by the salt content added to cheese during the manufacturing process (Kilcast and Angus, 2007).
Texture is a main quality attribute in cheese and is defined as a composite sensory characteristic resulted from tactile, visual and oral manifestation during consumption. It is affected by some factors such as salt, protein, fat content, the pH value and mineral composition (Chevanan et al., 2006; Fox et al., 2017). Cheese texture can change during the ripening due to the effect of salt on water binding capacity of caseins within the cheese matrix. It is also known that the addition of salt indirectly changes the texture of the cheese due to its effects on the balance between calcium and phosphorus in casein micelles (Rahimi et al., 2013). Research on the mineral contents of food products can provide data about of its nutrient contribution to the human diet. Determination of mineral contents is also necessary for toxicological assessment of foods especially, dairy products. The mineral contents of cheese depend on some characteristics such as geographical area, composition of raw milk and manufacturing methods. The contamination of equipment used during manufacturing can also affect the mineral content of cheese (Mendil, 2006).
Ultrafiltration (UF) has been identified as a favourable technique for concentrating milk prior to rennet addition while preserving its nutritional properties due to thermal treatment (Deshwal et al., 2020). Cheeses produced by the ultrafiltration technique increase the cheese production capacity and cheese yield and reduces the use of rennet and salt (El-Sayed and Ibrahim, 2021; Soltani et al. 2022). Ultrafiltered (UF) white cheese is manufactured by using ultrafiltered and pasteurized cow milk coagulated by action of mesophilic starter culture, commercial recombinant chymosin ( Rhizomucor miehei) and 3 % of salt (Soltani et al., 2019). Even though there are several studies about the evaluation of physico-chemical, microstructural, ripening and sensory properties of UF white cheese (Hesari et al., 2006; Karami et al., 2009; Nazari et al., 2020; Yousefi et al., 2020; Heidarvand et al., 2021; Habibi et al., 2022), to the best of our knowledge, no study has been conducted so far about the effect of added salt concentration on the texture profile and mineral contents of this type of cheese. The main purpose of this study was to determine the influence of using different concentrations of salt on chemical and textural properties of ultrafiltered white cheese during 90 days of ripening at 9±1 ºC. Moreover, this study considered the changes in the mineral contents of ultrafiltered white cheese produced using different salt concentrations.
Materials and methods
Material
Preparation of raw cows’ milk and manufacturing of cheeses were performed in the Damaneh Sahand dairy plant (Tabriz, Iran). Mesophilic homofermentative starter cultures with combination of Lactococcus lactis subsp. l actis and Lactococcus lactis subsp. cremoris were obtained from Danisco Deutschland GmbH (Niebüll, Germany). Recombinant chymosin from Rhizomucor miehei (Fromase® 2200 TL granulate, ≥ 2200 IMCU g-1) was supplied from DSM Food Specialties (Seclin, Cedex, France).
Cheese manufacturing
Cheese with four salt concentrations was manufactured from cows’ milk (pH 6.64, 12.38 % for total solid, 3.10 % for fat, 3.22 % for protein and 1.029 g/cm3 for specific density) in Damaneh Sahand dairy plant (Tabriz, Iran). Cheese-making was replicated on three different trials on consecutive weeks according to manufacturing method of UF cheese introduced by Tetra-Pack Inc. (Bylund, 1995). The flowchart of the production stages of experimental cheese are given in Figure 1. The retentate was obtained from cow milk after the ultrafiltration process according to the stages described in Soltani et al. (2015). The rate of obtaining retentate from cow milk was 1 kg to 5.1 kg of milk. After application of pasteurization (78 ºC for 60 s) and homogenization (at 5 MPa) to retentate, it was sent to starter tanks for mixing with starter culture (20 g starter for 1000 kg retentate). When pH reached 6.5, the retentate was mixed with rennet solution (30 g rennet for 1000 kg retentate) in the filler machine. Then, the cheese containers were filled immediately with the mixture and sent to a coagulation tunnel (35 ºC for 20 min). After that, the top of coagulum [cube with a weight of 100 g and dimensions (mm) of 80×50×25] is covered by the parchment paper and four different dry salt (NaCl) concentrations (0 %, 1 %, 2.5 % and 4 %) (by mass) were added to the coagulum. The containers were then sealed with aluminium foil and the cheeses manufactured were coded as follows; A (salt free), B (1 % of salt), C (2.5 % of salt) and D (4 % of salt). After completing the pre-ripening stage in a pre-storing room (26±1 ºC for 24 h), cheeses manufactured were carried to a cold store (9±1 ºC). The cheeses ripened for 90 days and different analyses were performed after 1, 15, 45 and 90 days of ripening.
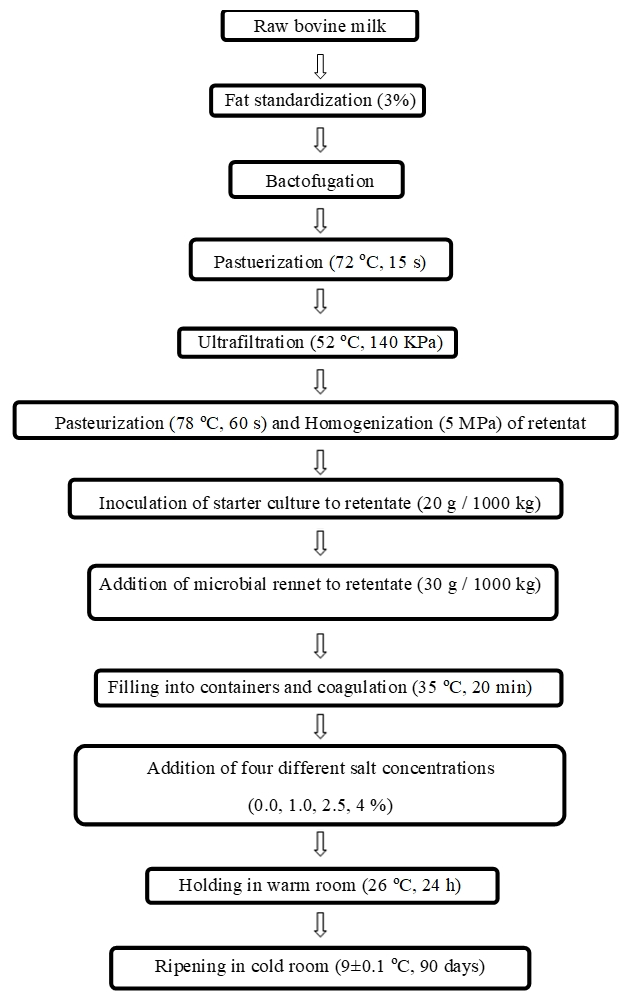
Figure 1. Flow sheet diagram for production of ultrafiltered white cheese
Analysis of chemical properties
Grated cheese samples were analysed during ripening for moisture and protein based on the methods expressed by IDF (1982) and IDF (1993), respectively. Salt content was analysed according to the method described in AOAC (2000) and calculated based on the ratio of salt to moisture content. A digital pH meter (Mettler Toledo Seven Compact Spain) was used for pH measurement of a slurry provided from the mix of grinded cheese (10 g) and distilled water (10 mL).
Texture analysis
Texture parameters including hardness, springiness, cohesiveness, adhesiveness, gumminess and chewiness were determined after 1, 15, 45 and 90 days of ripening according to the method of Ruvalcaba-Gómez et al. (2020). Texture analyses were conducted on a TA-XT2i texture analyser (Stable Micro Systems LTD, Godalming, UK). The device had a load cell of 30 kg and the dimensions of its cylindrical probe was greater than the dimensions of the cheese samples. Cheeses were cut in cubes (20 mm), wrapped with plastic and waited for equilibration to room temperature. A cylindrical probe (ø=25 mm) of 25 mm diameter (p/25) was used to texture analysis of samples with compression (strain) of 20 % which compressed samples to 20 % of their original height. The rate of speed for pre-test, test and post-test of TPA were 1 mm/s. The collected data were processed using the Texture Expert Exceed Version 2V3 (Stable Micro Systems 1998) software. In addition, the texture values of the UF white cheeses were also prepared as heat map.
Determination of mineral contents
The amount of phosphorus (P) was determined by the method described by Murphy and Riley (1962) and modified by Bakircioglu et al. (2011). Dry ashing was used as the digestion procedure for determination of sodium (Na), calcium (Ca), iron (Fe), manganese (Mn), copper (Cu), zinc (Zn), chromium (Cr) and nickel (Ni). For this purpose, 1.0 g of cheese samples was placed at 550 ºC for 16 h in furnace. Then, 1 mL of nitric acid (65 %) was added to the ashed sample and the mixture was placed again in a furnace (550 ºC for 6 h). The obtained ash was then dissolved in 1 mL of nitric acid (65 %) and filtered. Standard solutions (1000 ppm) were provided by Merck (Darmstadt, Germany). The determination of minerals was performed by inductively coupled plasma-optical emission spectrometry (ICP-OES, Perkin-Elmer Optima 7000 DV, USA).
Statistical analysis
Analysis of variance (ANOVA) by SPSS program (SPSS package program, version 22.0, SPSS Inc., USA) was used for determination of the differences among the cheeses during 90 days of ripening in terms of texture profile and mineral composition. Duncan's multiple range tests was also used for determination of different groups. The significance level for obtained results was considered at α = 0.05.
Results and discussion
Chemical and mineral contents of cheese milk
The chemical composition and mineral contents of raw cow milk used for manufacturing in three trials were presented in Table 1. The calcium and sodium were two predominant minerals in the raw milk used for production of UF white cheese samples. These values were compliant with results reported by other researchers for cow milk used for manufacturing of Iranian ultrafiltered white cheese (Hesari et al., 2006; Soltani et al., 2015; Nazari et al., 2020).
Table 1. The chemical composition and mineral contents of raw cow milk used for production of ultrafiltered white cheese
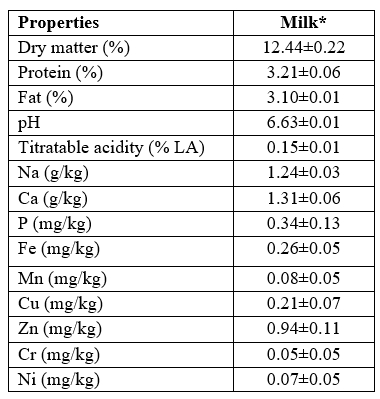
*Values of milk are shown as mean ± SE of three trials of cheese production
Chemical properties of ultrafiltered white cheeses
The chemical properties of the experimental cheeses are given in Table 2. A significant increase (p<0.05) was observed in the pH of ultrafiltered white cheeses produced using higher salt concentrations. Increase in the salt concentration in cheese formulation can lead to a decrease in aw value and consequently inhibit the activity of starter bacteria required for the conversion of lactose to lactic acid (Guinee and Fox, 2017). On the other hand, the lactic acid utilization and formation of nitrogenous compounds with alkaline properties along with the progress of proteolysis caused an increase in the pH values of the cheeses after 45 days of ripening (Soltani et al., 2019; Rako et al., 2022).
As expected, increasing salt concentration led to a significant decrease (p<0.05) in the moisture contents of ultrafiltered white cheeses, because of the water-binding capacity of salt and its contribution to the total solid of the final product (Loudiyi and Aït-Kaddour, 2019).
Although there was no difference between the protein content of the experimental cheese at the first day of ripening, significant changes were observed among the ultrafiltered white cheeses in terms of protein content during ripening (p<0.05). The cheeses produced using higher salt concentrations (samples C and D) had significantly (p<0.05) higher protein contents than those produced with lower salt levels (samples A and B) due to the inhibitory effect of salt in high concentrations on the activity of the coagulant enzyme (Guinee and Fox, 2017; Soltani et al., 2022).
Significant changes were observed in the salt to moisture (SM) ratio of the experimental cheeses ( p<0.05). Because of increasing the level of salt used for the production of the ultrafiltered white cheeses, the significant increase (p<0.05) in the SM ratios in the cheeses made with higher salt concentrations compared to other cheeses was an expected result. On the other hand, the SM ratio was the highest at the last day of ripening because of the migration and diffusion of salt into the cheese matrix (Wemmenhove et al., 2016; Soltani et al., 2022).
Table 2. The chemical properties of ultrafiltered white cheeses manufactured using different salt concentrations after 1, 15, 45 and 90 days of ripening
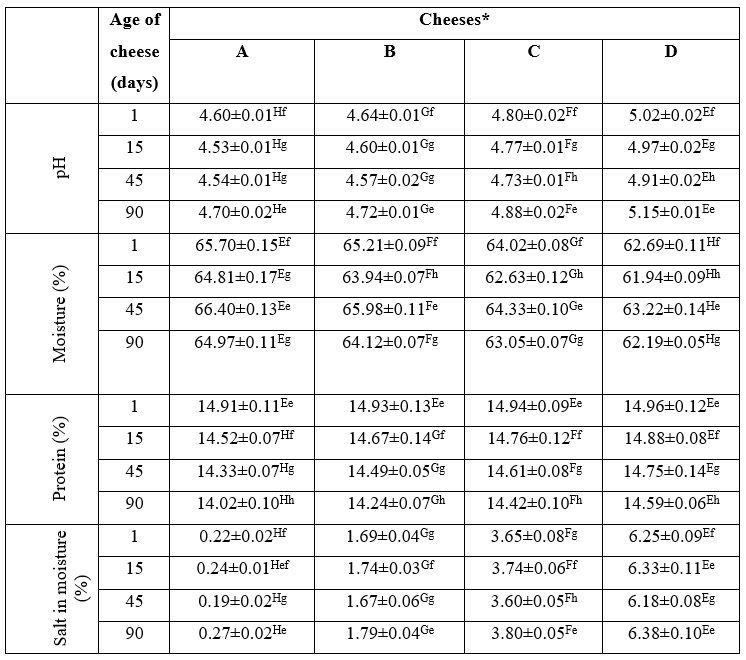
*Cheeses: A: free of salt, B: 1 % salt, C: 2.5 % salt, D: 4 % salt
Values are shown as mean ± SE of three separate samples from three batches
E,F,G,HMeans in the same row having different letters are significantly different (p<0.05)
e,f,g,hMeans in the same column having different letters are significantly different (p<0.05)
Texture profiles of ultrafiltered white cheeses
The mean values obtained for texture characteristics of the cheeses at different stages of ripening are presented in Table 3. Unexpectedly, hardness (maximum force of the compression test) value of the cheeses decreased significantly (p<0.05) with the increased salt concentration during ripening. Increasing salt concentration in experimental cheeses might have caused the shrinkage and decrease in porosity of the structure of the casein matrix. Consequently, due to the narrow pores of the casein matrix, the diffusion phenomenon between salt and water was impaired. Therefore, we assume that as salt concentration increased, water trapped in cheese structure increased and lead to a decrease in the hardness of cheese (Guven et al., 2006). Moreover, the pH decrease to values near the isoelectric point of caseins led to a decrease in the electrostatic repulsion, an increase in the hydrophobic interactions between caseins and resulted in an increase in the hardness of cheeses produced using lower salt concentrations (Wusimanjiang et al., 2019).
Data in Table 2 revealed that the lowest hardness values of cheese samples were determined after 45 days of ripening, probably due to the proteolytic breakdown of caseins and the decrease in the pH value. Along with the decrease in pH value, solubilization in colloidal calcium phosphate cross-links and increase in electrostatic repulsion between the exposed phosphoserine residues might have caused a decrease in the hardness of the cheese samples (Lucey, 2002; Jalilzadeh et al., 2018). Zonoubi and Goll (2021) reported the highest hardness on the first day of storage in the UF cheeses containing sodium chloride, while the lowest values were observed on the sixth day of storage in UF cheeses containing magnesium chloride. In addition, the authors also observed a decrease in the hardness values during the storage for all treatments.
The springiness value of the cheese samples increased with the increase in the salt concentration, which was significant only at the last day of ripening ( p<0.05) (see Table 3). Reduction in protein degradation and free water content might have caused the increase in springiness of cheese samples produced with higher salt concentrations (Ozer et al., 2003; Chevanan et al., 2006). The obtained results corresponded to previous findings of Saint-Eve et al. (2009) who reported that increasing the salt concentration during production might cause an increase in springiness of flavoured model cheese.
Cohesiveness can be defined as the value of compression of a substance between the teeth before it breaks. This value measures the strength of the internal bonds of protein matrix in the cheese (Chevanan et al., 2006). Increasing the salt concentration caused a decrease in the cohesiveness values of cheese samples that was significant only at the first day of ripening ( p<0.05) (Table 2). It was previously reported that the salt type used for manufacturing of cheese can affect casein intermolecular associations, that in turn results in different cohesiveness values of cheese (Akan and Kinik, 2018). On the other hand, many researchers have reported that the cohesiveness value of cheese was not affected by changes in salt concentration used for manufacturing (Chevanan et al., 2006; Guo et al., 2011). The cohesiveness value of all cheese samples significantly (p<0.01) decreased during ripening due to the weakening of bonds between casein micelles (Ozer et al., 2003). This result is in accordance with the cohesiveness value reported by Erdem (2005) in White cheese manufactured using ultrafiltered whole milk and salted by the addition of dry salt (2 % w/w). Several researchers have also reported that the cohesiveness value of various cheeses decreased at the last day of ripening compared to the first day (Chevanan et al., 2006; Saint-Eve et al., 2009; Zonoubi and Goll, 2021).
A direct relationship was determined between the adhesiveness value and salt concentration of cheese samples (Table 3). The adhesiveness value of cheese samples increased significantly with increasing the salt concentration (p<0.05). Chevanan et al. (2006) and Saint-Eve et al. (2009) have reported a direct relationship between increasing adhesiveness value and salt concentrations in flavoured model cheese and Cheddar cheese, respectively. Different salt concentrations used in the production might have influenced the pH value, proteolysis and polar characteristics of the protein fraction of cheeses and changed their adhesiveness value (Chevanan et al., 2006; Akan and Kinik, 2018). In addition, the adhesiveness value of cheeses increased after 90 days of ripening compared to the first day. In this context, Erdem (2005) has reported that adhesiveness value increased during 90 days of ripening in Turkish white brined (14 % NaCl) cheese.
Gumminess which is calculated by multiplying the hardness and cohesiveness values can be defined as energy required for disintegration of a semi-solid food until preparing to swallow (Jalilzadeh et al., 2018). Different salt concentrations used for cheese production and ripening time significantly affected the gumminess value of samples analysed ( p<0.05). As presented in Table 3, a reverse trend was found between the gumminess value of cheese samples and salt concentration of them during ripening. Ozer et al. (2003) and Saint-Eve et al. (2009) have reported similar results for Urfa cheese (a type of Turkish white cheese) and flavoured model cheese. Gumminess value is dependent on hardness and cohesiveness values. So, decrease in the hardness and cohesiveness values of cheese samples might cause a decrease in the gumminess value of cheese samples (Ozer et al., 2003).
Chewiness value is calculated from hardness, cohesiveness and springiness values (Ozer et al., 2003). The value of chewiness in experimental cheeses was significantly affected by salt concentration and ripening time (p<0.05) (Table 3). With fluctuations occurring during the ripening, it could be observed that higher salt concentrations lead to lower chewiness values, as the cheese D, which contained the highest salt content, had the lowest value of chewiness among all salted cheeses. Zonoubi and Goll (2021) investigated the chewiness values of UF cheese prepared by NaCl with KCl, MgCl2 and CaCl2 in brine for ripening stage. The authors noted that the cheeses salted with the NaCl were the highest chewiness on the first day of storage and the cheeses salted with the MgCl2 were the lowest chewiness on the 60 days of storage.
Table 3. The texture profiles of ultrafiltered white cheeses manufactured using different salt concentrations at 1, 15, 45 and 90 days of ripening
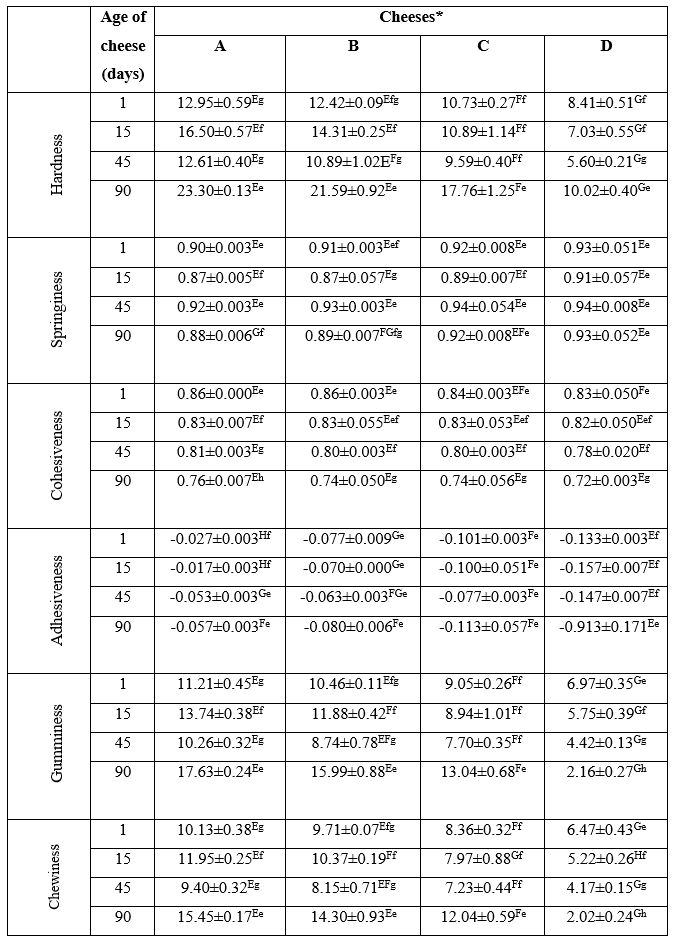
*Cheeses: A: free of salt, B: 1 % salt, C: 2.5 % salt, D: 4 % salt
Values are shown as mean ± SE of three separate samples from three batches
E,F,G,HMeans in the same row having different letters are significantly different (p<0.05)
e,f,g,hMeans in the same column having different letters are significantly different (p<0.05)
The heat map regarding texture values of the experimental cheeses is presented in Figure 2. It is evident that the use of different salt concentrations caused differences between UF white cheeses at different stages of ripening. In accordance with the results of texture analysis presented in Table 3, it could be observed that UF white cheeses produced with higher concentrations of salt had lower hardness, cohesiveness, gumminess and chewiness and higher springiness and adhesiveness compared to other experimental cheeses.
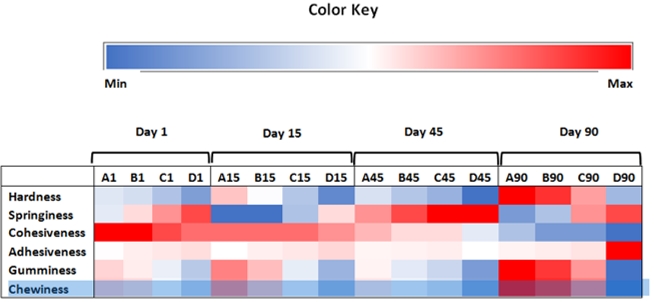
Figure 2. Variation of different texture parameters of ultrafiltered cheeses during ripening. Colour ranging from blue to red corresponds to minimum and maximum levels of each characteristic in a raw
Mineral contents of ultrafiltered white cheeses
The contents of some macro-elements (Na, Ca, P) and micro-elements (Mn, Cu, Fe, Zn, Cr, Ni) of cheese samples at the first day of ripening are presented in Table 4. Mineral contents determined in cheese samples were significantly (p<0.05) affected by the salt concentration. The contents of Na, Ca, P, Mn, Cu, Fe, Zn, Cr and Ni were increased depending on the increasing salt concentration in cheese.
Table 4. The mineral contents of ultrafiltered white cheeses manufactured using different salt concentrations at first day of ripening
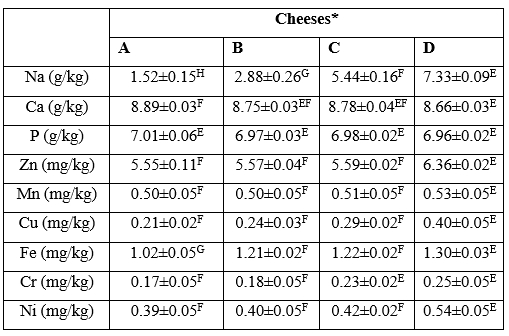
*Cheeses: A: free of salt, B: 1 % salt, C: 2.5 % salt, D: 4 % salt
Values are shown as mean ± SE of three separate samples from three batches
E,F,G,H Means in the same row having different letters are significantly different (p<0.05)
The salt added to the cheeses during production was contributed to Na content of cheeses in a significant (p<0.05) level. As expected, a direct relationship was found between salt concentration and Na content in the cheeses and increasing salt concentration increased the Na content in cheese samples. This was in agreement with the results of Al-Otaibi and Wilbey (2006) for white salted cheese and Rahimi et al. (2013) for Iranian White cheese. Moreover, Akan and Kinik (2018) has reported that partial replacement of NaCl with other salt mixture such as KCl, CaCl2 and MgSO4 led to a decrease in Na content in Turkish White cheese during 90 days of ripening. Na is bounded by casein micelle fraction and has an important role in increasing the casein hydration by displacement with calcium or calcium phosphate from para-casein (Guinee and Fox, 2017). The Na contents found for salty cheese were lower than those reported by Lante et al. (2006) for Crescenza and Squacquerone Italian fresh cheeses and similar to those of Turkish cheeses reported by Mendil (2006).
Because of nutritional value and considerable contribution to the micelle structure of casein, Ca is an important element in cheese. Ca influences directly the texture of cheese by participation in protein network and structural matrix. So, high concentrations of Ca lead to firmer and less meltable cheeses (Rahimi et al., 2013). It was reported that the presence of higher calcium content in the cheese matrix led to the creation of stronger protein-protein interactions that resulted in firmer texture in the final product (McMahon et al., 2005). Significant difference (p<0.05) were observed among the cheeses in terms of Ca content. The calcium content of salt-free ultrafiltered white cheese in the present study was determined 8.89 (g/kg) that was slightly higher than that reported for Mozzarella cheese (0.6 %) by McMahon et al. (2005). The highest and lowest contents of Ca were determined in the cheeses A and D, respectively. This result was in accordance with the hardness values of the cheeses that showed that the maximum and minimum of hardness value was determined in the cheese A and D, respectively.
P has an important role in acid/base equilibrium, synthesis of nucleic acids, neural system constitution and formation of amino-acids, phospholipids and high-energy bonds (Lante et al., 2006). The P content among UF white cheeses at the first day of ripening did not change significantly (p>0.05). A similar result was reported by Rahimi et al. (2013) indicated that brine concentration had no significant effect on P content in Iranian white cheese. P is in insoluble form and linked to the casein micelle fraction. The contents of P determined in experimental cheese were less than the values reported by Lante et al. (2006) for P content of Italian fresh cheeses and higher than those reported by Rahimi et al. (2013) for Iranian white cheese and Cichoscki et al. (2002) for Prato cheese.
Zn and Mn are linked to casein fractions in milk and are usually retained in the curd (Mendil, 2006). When salt concentration increased, the contents of these elements in experimental cheeses showed a significant increase (p<0.05). Low pH value and migration towards the soluble phase might have caused the reduction of Zn and Mn contents in cheeses A and B compared with cheeses C and D. This result was similar to those reported by Cichoscki et al. (2002) for Prato cheese.
Cu and Fe are an index for final quality of a food product due to their nutritional and biological functions. However, their catalytic effect in oxidation of lipids and development of unpleasant flavour is causing a problem in dairy technology. Salt concentration had a significant effect (p<0.01) on the Cu and Fe contents in cheese analysed. The contents of Cu and Fe increased with increasing salt concentration in experimental cheeses probably due to low pH value and movement of these minerals towards the soluble fraction (Lante et al., 2006).
Some previous studies focused on the role of Cr in insulin function in human body and in lipid oxidation during processing and ripening. Also, the toxicological effect of Ni in the milk consumed by infants and children was investigated (Mendil, 2006). In this research, change in salt concentrations used for manufacturing of the cheeses influenced significantly the contents of Cr and Ni (p<0.01). As salt concentration increased, the concentration of Cr and Ni in the cheeses increased too. The high salt content can lead to a stronger electrolyte environment in the ICP device, thus making it easier for the device probe to detect Cr and Ni minerals in cheese. The contents of Cr and Ni found in this research were somewhat higher than those reported by Mendil (2006) for Otlu, Cerkez, Cecil and Comlek cheeses collected from Turkey.
Conclusions
Different salt content has a major effect on various attributes of cheese. In this context, the effect of using different salt concentrations (0 %, 1 %, 2.5 % and 4 %, by mass) on the chemical composition, texture profile and mineral content of ultrafiltered white cheeses were investigated. It was concluded that the pH, protein, salt in moisture, springiness and adhesiveness of cheeses increased with the increase in the salt concentration. However, the increased salt concentration led to softer texture probably due to higher degradation of αs1-casein and increased content of water trapped in the cheese structure. Increased salt concentration was also a cause of decreased cohesiveness, gumminess and chewiness. On the other hand, except for Ca and P, a direct relationship was determined between the salt concentration and the contents of minerals determined in the cheeses. The findings of the present study can be useful for the producers of this type of cheese in terms of using appropriate salt concentration for the cheese formulation in order to obtain a final product with desirable texture profile and mineral content. Further research is needed to improve the quality of cheese with the appropriate use of salt in cheese production.
Promjene teksture i udjela mineralnih tvari u bijelom siru od ultrafiltriranog mlijeka proizvedenog korištenjem različitih koncentracija soli
Sažetak
Ultrafiltrirani (UF) bijeli sir ubraja se među najčešće konzumirane vrste sireva, a karakterizira ga blagi okus i polutvrda tekstura. Cilj ovog istraživanja bio je ispitati utjecaj koncentracije soli na teksturu i sastav mineralnih tvari ove vrste sira. Uzorci sira proizvedeni su bez dodatka soli te s dodatkom 1 %, 2,5 % i 4 % (maseni udio) soli (NaCl), a dozrijevali su 90 dana pri temperaturi 9±1 °C. Kemijski sastav i tekstura sireva analizirani su tijekom 90 dana zrenja, a prvog dana zrenja određivao se i udio mineralnih tvari u svim sirevima. Rezultati su pokazali da su na kemijska svojstva, teksturu i udio mineralnih tvari u sirevima značajno (p<0,05) utjecale koncentracije soli korištene u postupku proizvodnje. Povećanje koncentracije soli uzrokovalo je povećanje pH vrijednosti, udjela proteina i omjera udjela soli i vlage, kao i smanjenje tvrdoće, kohezivnosti, gumenosti te žvakljivosti sireva. Primjena različitih koncentracija soli rezultirala je promjenama u udjelu svih analiziranih mineralnih tvari. Zaključno, povećanje koncentracije soli rezultiralo je mekšom konzistencijom i manjim udjelom kalcija i fosfora u bijelom siru od ultrafiltriranog mlijeka.
Ključne riječi: sir, ultrafiltracija, sol; mineralne tvari, tekstura