
1. INTRODUCTION / Uvod
Global warming is an issue that, until now, will continue as long as humans still depend on energy from hydrocarbon fuels. Along with population growth, global energy consumption continues to increase drastically and will continue [1]. Thus, reserves of hydrocarbon fuels will be depleted, and the problem of carbon dioxide (CO2) emissions will become more complicated. Reducing CO2 emissions can positively impact the environment by preventing the adverse effects of global warming [2]. Therefore, it is necessary to use renewable energy, which is more environmentally friendly without causing CO2 emissions.
Ocean currents are one of the renewable energy sources that do not produce CO2 emissions, the movement of the mass is considerable, and its density is 835 times that of wind, the same as the energy of ocean waves [3]. Thus, ocean currents are believed to be able to turn turbines and generate generators to produce electricity. Turbines are the primary technology capable of extracting kinetic energy from ocean currents to create generators to produce electricity [4,5]. In general, the turbines used by researchers worldwide are operated at high current speeds. Meanwhile, the current speed in Indonesian waters is relatively low, such as in the Alas Strait at 0.7 m/s, the Toyakapeh Strait at 0.57 m/s, and off the coast of Bengkulu at 0.22 m/s [6]. Thus, ocean current turbines that have been developed in several countries around the world cannot be immediately applied in Indonesia.
However, even though the speed of ocean currents in Indonesia is relatively low, it has a theoretically enormous ocean current energy potential based on the results of the ratification of the Indonesian Ocean Energy Association (ASELI), namely 287,822 MW [6]. The enormous energy potential of ocean currents has not been utilized optimally until now in Indonesia. Thus, it is necessary to study ocean current turbine technology that can operate in the condition of Indonesian waters, classified as low current speed, as a recommendation for future energy independence and defense technology in Indonesia.
Ocean current turbine technology consists of two types based on the rotating axis: the vertical axis turbine and the horizontal axis turbine, generally known as hydrokinetic turbines [7]. Vertical turbines can rotate from all directions when the ocean currents come so that the amount of energy extracted will be more and more stable. At the same time, horizontal turbines cannot rotate from all directions when the ocean currents come, so the energy extracted is less [8,9,10,11]. Based on the actual conditions at sea, it is true that ocean currents move from various directions. Thus, the vertical turbine is very suitable to be applied to ocean currents. However, the performance produced by the vertical turbine is lower than the horizontal turbine when it receives current from the same direction, so it becomes a challenge for researchers to improve the performance of vertical-type ocean current turbines.
The original form of the vertical turbine is straight-blade, which utilizes lift forces to produce its performance. Many attempts have been made to improve the straight-blade vertical axis ocean current turbine performance by modifying the foil, blade, and rotor. Arini et al. [12] have carried out research with modified foil and showed it can increase lift performance by 12% by cutting the trailing edge of the foil. Analysis by modifying blades has been carried out for the first time by Gorlov [13], and the results show that it can increase the maximum power coefficient up to 0.35 by changing the shape of a straight blade into a helical blade. Kirke and Lazauskas [8] carried out the research by modifying the rotor, and the results have shown to increase the maximum power coefficient up to 0.32 by changing the fixed variable to passive. The foil, blade, and rotor are the most vital components of the turbine, so if modified, it will affect the geometric shape, and its performance may increase or decrease. An augmentation channel is a solution to improve turbine performance without changing its main components, which can increase the flow around the turbine rotor [7]. Many ideas for augmentation channels in wind turbines are interesting to investigate, but only a few have been found in ocean current turbine research.
The guide vane is a component outside the turbine blade that is used to direct the flow of ocean currents from all directions so that the flow is concentrated toward the turbine rotor. When the flow of ocean currents enters the guide vane gap in all directions with a narrower space, it can accelerate the flow around the turbine rotor (basic concept of continuity). Thus, a guide vane can increase low current speeds so that the kinetic power the turbine blades absorbs is greater to optimize its performance. The guide vane is inspired by the omni-direction-guide-vane (ODGV) in wind turbines which can improve turbine performance [14,15,16]. In addition, guide-vane-augmented has also been investigated in ocean current turbines and can increase turbine performance at a pitch angle of 0˚ and experience a decrease in performance at a pitch angle of 30˚ and -30˚ [17]. A water flow deflector (WFD) similar to ODGV has also been tried on ocean current turbines, the WFD profile forms a plate geometry with a pitch angle of 50˚, and six plates surround the blade. The results can improve the performance of ocean current turbines [18].
The idea in this research is the development of WFD, but the profile is modified from plate to foil because it is more hydrodynamic, called foil guide vane (FGV). This research aims to add FGV to the straight-blade vertical axis ocean current turbine, namely, to accelerate low current speed around the turbine rotor to improve vertical turbine performance in terms of self-starting capability, torque coefficient, and power coefficient.
2. DESIGN AND FABRICATION / Projektiranje i izrada
The component that has the most influence on turbine performance is the blade. Selection of the blade profile is a vital parameter because achieving better hydrodynamic performance will affect the change in force along the blade area when subjected to fluid [19]. Thus, the design parameters of a straight-blade vertical axis ocean current turbine must pay more attention to such as blade geometry, foil, and number of blades. In this study, the blade geometry was made small-scale with the specifications shown in Table 1. The foil used in this study was NACA 0018 because it can produce better performance based on research that has been done [20,21,22]. The number of blades used in this study was four because they produced better performance at low current speeds [23].
Table 1. Specifications of the straight-blade model geometry
Tablica 1. Specifikacije geometrije modela ravne lopatice
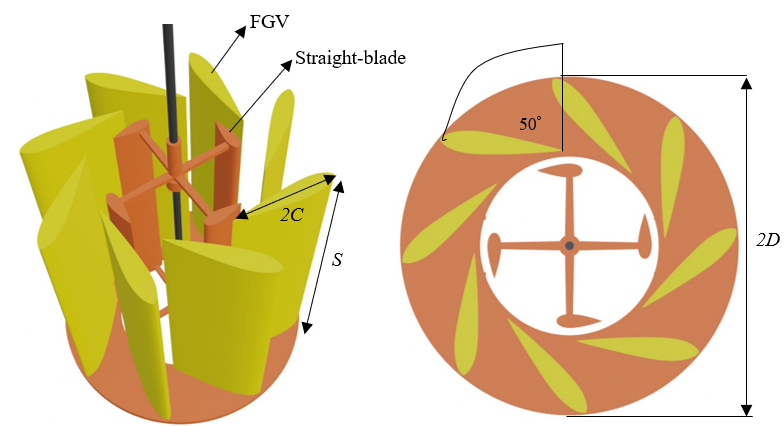
The geometric design of the FGV model in this study uses the NACA 0018 hydrofoil profile because it is more hydrodynamic than the plate profile. The FGV chord length is 2C, the FGV span is 1S, the pitch angle is FGV 50˚, and eight FGVs surround the turbine rotor with a 2D FGV diameter. The design of the FGV model for the straight-blade vertical axis ocean current turbine in this study is shown in Figure 1.
Turbine and FGV have been fabricated using polylactide acid (PLA) because it is easy to form and has durability under the water's surface. The fabrication process is carried out with the help of a 3D printer machine to print each turbine and FGV component. Each FGV is joined one by one manually to the top and bottom end plates using ethyl cyanoacrylate which are then dried so that it sticks firmly. Each straight-blade component is connected one by one to the turbine arm using ethyl cyanoacrylate, which is then dried so that it adheres firmly; after being put together, it is then connected to the turbine shaft using two 10 mm diameter bearings located at the top and bottom. The supporting structure has also been fabricated; the lower and upper structures are made of PLA material formed using a 3D printer, while the leg structure as the supporting legs is made of polyvinyl chloride (PVC) material. The inside of the hollow leg is added with cement and then dried so that it quickly sinks below the water's surface, making the structure stronger and more stable when subjected to water flow. The turbine, FGV, and supporting structures are then combined to obtain the final result of the fabrication process, as shown in Figure 2.
(a) (b)
Figure 1. Design of FGV, (a) isometric view, (b) top view
Slika 1. Projektiranje FGV-a, (a) izometrijski pogled, (b) pogled odozgo
3. EXPERIMENTAL SETUP AND CALIBRATION / Eksperimentalno podešavanje i kalibracija
Experimental studies have been conducted in a mini water tunnel at the Energy Systems Engineering Laboratory, Institut Teknologi Sumatera. The dimensions of the mini water tunnel are 120 x 40 x 40 cm with a water level of 27.6 cm. The detailed specifications of the mini water tunnel can be seen in Table 2. Figure 3 shows a photo of the mini water tunnel facility with calm water conditions. The straight-blade turbine model with the FGV is fixed in position supported by the supporting structure until the flow input moves to the turbine. A water pump generates the water in the mini water tunnel and produces variations in current speed which are regulated using a dimmer. The resulting current speed varied, namely, 0 m/s, 0.078 m/s, 0.096 m/s, 0.101 m/s, 0.106 m/s, 0.160 m/s, 0.162 m/s, and 0.180 m/s. Water flows through the water inlet to a 120 cm long water tunnel, is released through the water outlet, and then pumped back to the water inlet.
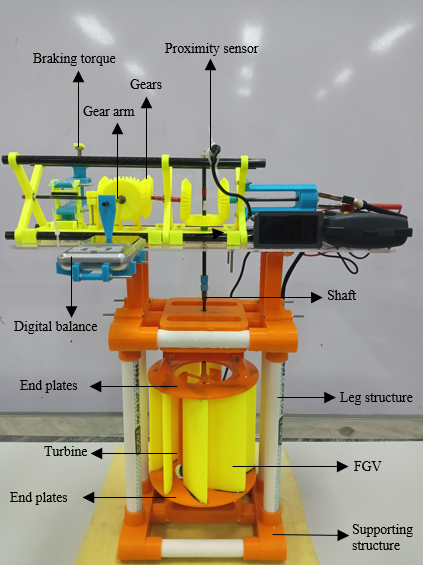
Figure 2. Fabricated straight-blade with FGV
Slika 2. Izrađena ravna lopatica s FGV-om
The turbine model is placed in a 3D position from the water inlet because it can absorb water power more optimally based on experimental results in the laboratory. When water flows through the water inlet and hits the straight blade, the turbine will respond in the form of rotation, which is then forwarded by the shaft to the gear system to collect turbine mechanical performance data such as rotational speed and torque. After the water hits the turbine, the flow will be continued along the water tunnel to the water outlet to be pumped back to the water inlet, and so on; the water will flow following the cycle while the turbine and FGV remain stationary.
Table 2. Specifications of the mini water tunnel
Tablica 2. Specifikacije malog vodenog tunela
| Parameters | Specifications |
|---|---|
| Length | 1.2 m |
| Width | 0.4 m |
| Depth | 0.4 m |
| Draft | 0.276 m |
| Velocity | 0 – 0.18 m/s |
| Fluid temperature | 27°C |
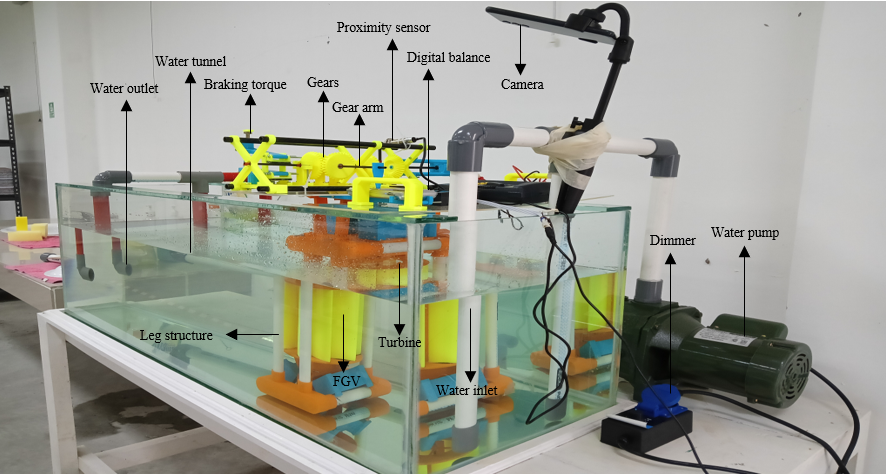
Figure 3. Experimental setup straight-blade vertical axis ocean current turbine in the water tunnel
Slika 3. Eksperimentalno podešavanje turbine za oceanske struje s ravnim lopaticama i okomitom osi u vodenom tunelu
Data collection on turbine rotational speed is measured dynamically using a proximity sensor measuring instrument. Calibration is needed for the accuracy of the data generated by the proximity sensor as the primary measurement tool in collecting self-starting and rotational speed data. As for being used as the object of measurement is the straight blade with FGV, whose braking is regulated using load braking, which is used as the x-axis in the graph. Calibration is carried out by comparing the rotational speed results from the proximity sensor and the tachometer; the rotational speed results are used as the y-axis in the graph, as shown in Figure 4. The R-squared (R2) value of the turbine rotational speed data produced by the proximity sensor and tachometer is 0.9178 and 0.9481 respectively. Both r-squared values are close to 1, thus indicating that the regression line fits the data almost perfectly. The calibration that has been carried out shows that the difference in the rotational speed results from the proximity sensor and tachometer is 3%, and the value is below 5%, so it meets the criteria specified by the International Towing Tank Conference (ITTC) [24].
Based on that, the proximity sensor can generate rotational speed data in determining self-starting performance and rotational speed as one of the turbine's mechanical performances. In this case, the turbine's rotational speed can be represented in the form of the tip speed ratio ( ), which is written in Equation 1.
(1)
where ω is the rotational speed of the turbine (2π/(60) rpm) [rad/s], is the radius of the turbine [m], and is the current speed [m/s].
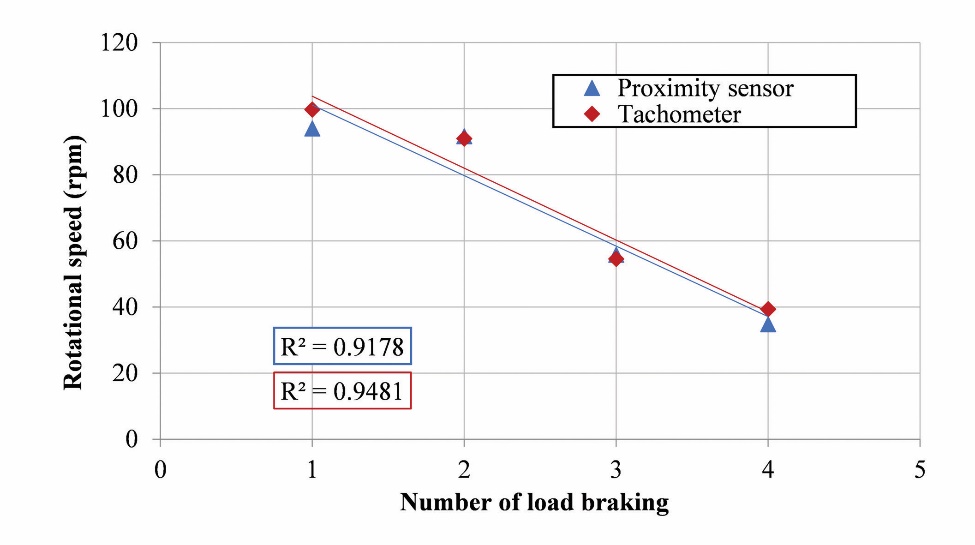
Figure 4. Calibration of the rotational speed ratio from the proximity sensor with a tachometer
Slika 4. Kalibracija omjera brzine vrtnje iz senzora blizine s tahometrom
Torque data collection is measured dynamically based on the dynamic torque sensing system patent reference [25]. Turbine rotation is transmitted by the turbine shaft, which causes the gears and torsion shaft to rotate, and then the torque arm can generate a force against the load cell. The load cell force is read using a digital balance measuring instrument. Thus, the torque ( ) can be calculated using Equation 2. In this case, the turbine torque can be represented in the torque coefficient ( ) written in Equation 3.
(2)
(3)
where is the mass of the load [kg] obtained from the digital balance, is the acceleration due to gravity [9.8 m/s2], is the torque arm [m], is the density [997.8 kg/m3], and is the area turbine [m2].
Digital balance measuring instruments are calibrated to obtain accurate data collection data. Seven weight scales are used as digital balance calibration; the seven weight scales, 1, 2, 5, 10, 20, 50, and 100 grams, are used as the x-axis in the graph. The seven weight scales are then measured one by one using a digital balance measuring instrument, and the results are used as the y-axis in the graph. The R-squared (R2) value in the mass data produced by the digital balance and weight scale is equal to 1, thus indicating that the regression line fits the data perfectly. Based on the measurement of the scale weight with digital balance, no errors were found, which in the graph shows that the y value is the same as x (y=x) or the correlation value (R2) is the same, as shown in Figure 5.
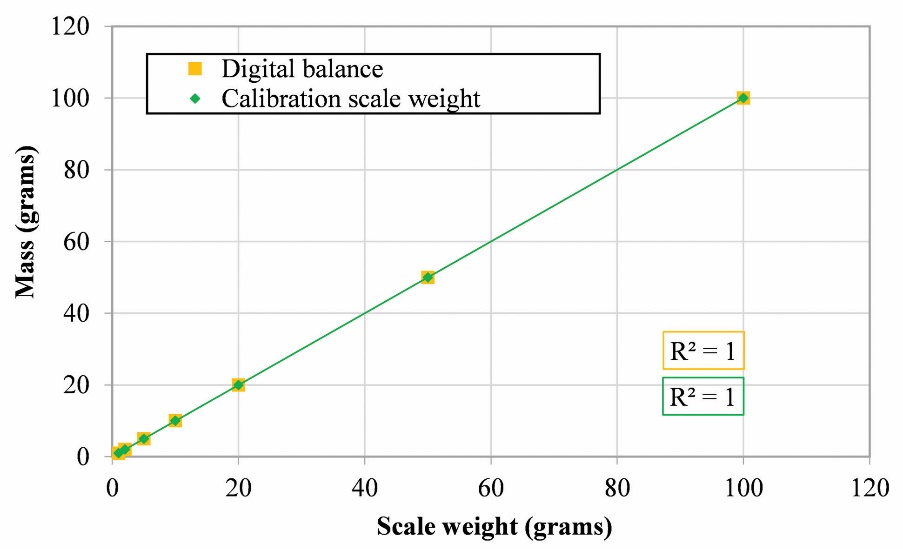
Figure 5. Calibration of the mass ratio as an indicator of torque from a digital balance with scale weight
Slika 5. Kalibracija omjera mase kao pokazatelja zakretnog momenta iz digitalne vage s utegom
Data retrieval was carried out in two stages: first, turbine rotational speed data without load braking on the seven variations of current speed, where this data is used to investigate the self-starting capability of straight-blade without and with FGV. Second, the rotational speed and torque data for the six load braking variations on the straight-blade without and with FGV, which data is used to investigate the power coefficient and torque coefficient on . Retrieval of turbine rotational speed and torque data is carried out simultaneously and at the same time. There are 14 variations of self-starting data collection (7 variations of current speed on straight-blade without FGV, and seven variations on straight-blade with FGV), and 12 variations of data collection of rotational speed and torque (6 variations of load braking on straight-blade without FGV, and six variations on straight-blade with FGV) so that the total data collection as a whole is 26 times. Data collection is recorded using a video camera placed above the water surface—the video results in recorded data during testing on straight-blade without and with FGV. Torque and turbine rotational speed data obtained for each variation are then averaged. While the turbine mechanical power ( ) is obtained by calculation using Equation 4 and can also be represented by the power coefficient ( ) obtained from Equation 5.
(4)
(5)
is the kinetic power of the water flow, which is determined based on Equation 6.
(6)
4. RESULTS AND DISCUSSION / Rezultati i rasprava
4.1 Self-Starting Experiments / Eksperimenti sa spontanim pokretanjem
Self-starting is defined as the ability of the turbine to start rotating when subjected to a flow of water with a minimum current speed. The minimum current speed generated by the water tunnel in this study is 0 m/s (calm), while the maximum current speed is 0.18 m/s. The variations in current speed that a water tunnel can produce are from 0 m/s, 0.078 m/s, 0.096 m/s, 0.101 m/s, 0.106 m/s, 0.160 m/s, 0.162 m/s, and 0.180 m/s. Every variation of the current speed is investigated to determine the ability of the turbine rotation without and with FGV. The turbine is installed without loading so that no external factors other than the current speed interfere with its rotation. For 120 seconds, the turbine rotational speed data is collected without FGV and FGV, which is then averaged to obtain the turbine rotational speed. Figure 6 shows the results of an investigation for 120 seconds with the sample shown at the maximum current speed of 0.18 m/s. The data shows that the curve of the red diamond line (straight-blade with FGV) is above the blue triangle line (straight-blade without FGV), which is visible when the graph is enlarged at 0 to 40 seconds. FGV has been proven to increase the rotational speed of the straight-blade vertical axis ocean current turbine.
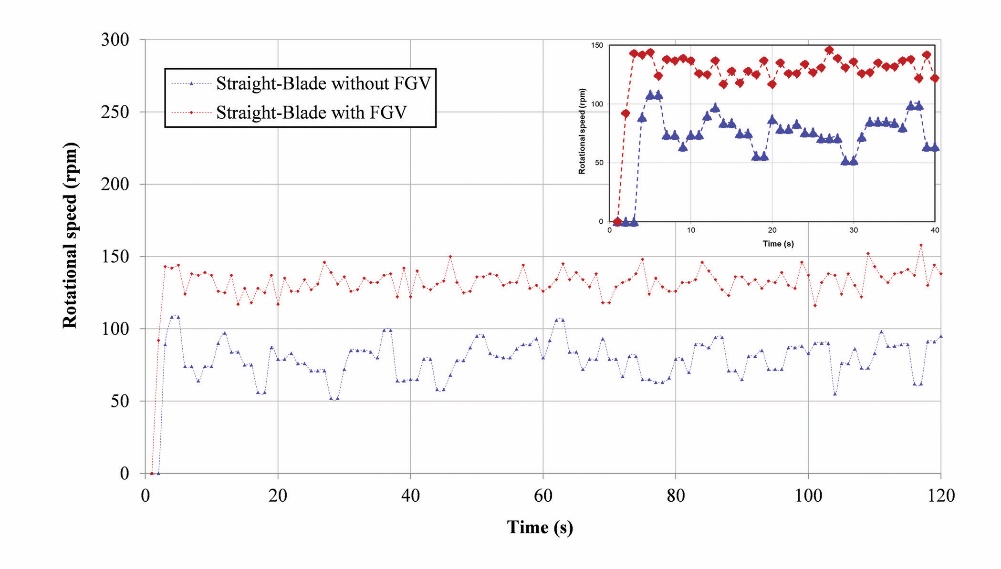
Figure 6. Time series comparison of rotational speed in investigating self-starting capability between straight-blade without FGV and with FGV (sample under conditions of maximum current speed, 0.18 m/s)
Slika 6. Usporedba vremenske serije rotacijske brzine u ispitivanju sposobnosti spontanog pokretanja između ravne lopatice bez FGV-a i s FGV-om (uzorak u uvjetima maksimalne brzine struje, 0,18 m/s)
Figure 7 shows a self-starting comparison chart between straight-blade without and with FGV. The x-axis indicates the current speed generated by the water tunnel from 0 - 0.18 m/s. The y-axis indicates the rotational speed of the turbine to investigate self-starting capability. At the minimum current speed of 0 m/s, it has been shown that the rotational speed of the straight blade without and with FGV is 0 rpm; this is due to the absence of kinetic power in the flow. When the water tunnel dimmer was increased to 0.078 m/s, the straight blade without FGV did not rotate because the kinetic energy produced was still very small, namely 0.003 watts. Previously it was also mentioned that the straight-blade vertical axis ocean current turbine has the disadvantage of low performance, one of which is self-starting. However, when the turbine is added FGV at a speed of 0.078 m/s, the turbine has been rotating with a rotational speed of 15.3 rpm. The addition of FGV to the straight-blade vertical axis ocean current turbine is proven to increase self-starting capability, which is more significant at minimum current speed compared to changing foil to flexible-foil which starts rotating at a current speed of 0.5 m/s with a rotational speed of 4 rpm [10]; compared to changing the blade to an inclined-blade which starts spinning at a current speed of 0.2 m/s with a rotational speed of 2.25 rpm [26]; and compared to changing the turbine rotor to a hybrid form (darrieus-savonius) which starts rotating at a current speed of 0.2 m/s with a turbine rotational speed of 1 rpm [27]. This means that adding FGV to the turbine can increase the excellent self-starting capability without having to modify the geometry of the turbine, either the foil, blade, or rotor.
Figure 7 shows that the curve of the red diamond line (straight-blade with FGV) is above the curve of the blue triangle line (straight-blade without FGV) at all variations of current speed 0 - 0.18 m/s. FGV is also proven to increase the turbine's rotational speed at all variations in current speed. When the water tunnel dimmer is raised again to 0.096 m/s, the straight-blade without FGV starts rotating at 21.6 rpm. In the same condition, the straight-blade with FGV showed a higher speed of 47.7 rpm. Likewise, when the water tunnel dimmer was increased to 0.101, 0.106, 0.160, 0.162, and 0.180 m/s, FGV was able to increase the rotational speed of the straight-blade vertical axis ocean current turbine of 35%, 36%, 41%, 38 %, and 40%, respectively. The success of FGV in increasing the straight-blade self-starting capability is a positive initial investigation result. The FGV process disturbs and accelerates the inlet velocity before attacking the turbine, influencing the self-staring capability [28,29,30]. It is believed to improve other performances, such as torque and power. That is because increasing the current speed around the turbine rotor can increase the kinetic energy absorbed by the turbine, based on Equation 6. This study shows that the current speed conditions are relatively low from 0 – 0.18 m/s, so the straight-blade with FGV is very suitable to be applied in Indonesia, which has a low current speed.
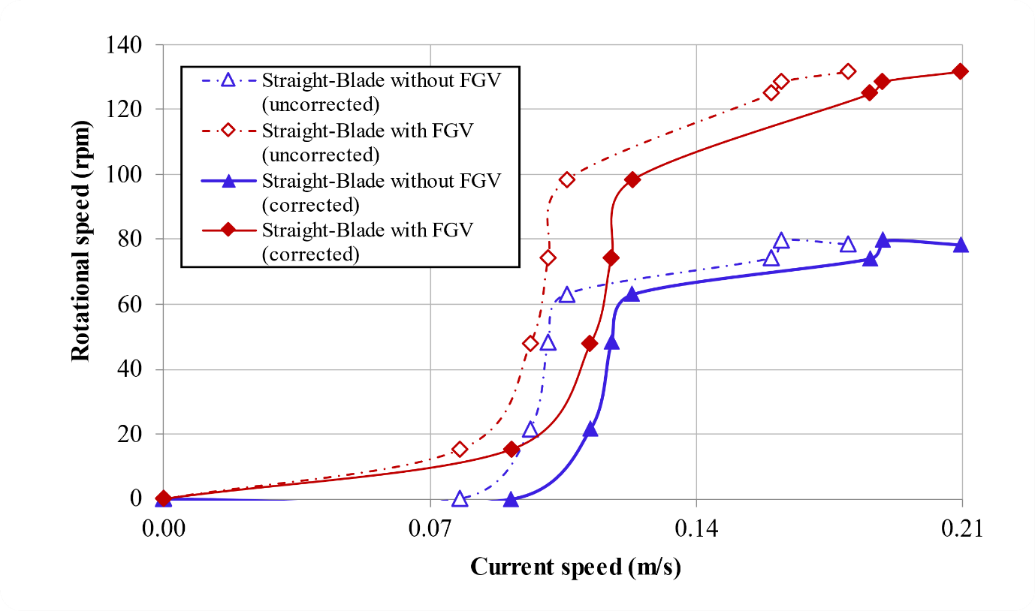
Figure 7. Comparison of self-starting straight-blade without FGV and with FGV
Slika 7. Usporedba ravne lopatice sa spontanim pokretanjem bez FGV-a i s FGV-om
In Figure 7, it can also be observed that there are two other data with blockage correction applied. In order to calculate the blockage corrected result, the blockage ratio (BR) needs to be defined first. For the water channel, [31] proposed that the BR can be calculated from HD/HwW2, where H and D are the turbine’s height and diameter; Hw and W2 are the water channel’s water depth and width. If the resulting BR is more than 7.5%, then blockage correction must be done [32]. Previous researchs [33,34] implement the improved Maskell’s correction method to obtain the corrected velocity value, given by . UUC denotes the uncorrected current speed, while m is the blockage correction factor. According to [35,36], m can be expressed as . By using the calculation steps above, the corrected velocity can be determined and presented in Figure 7. Generally, the corrected current velocity becomes higher to accommodate the adverse wall effect.
4.2 Torque Experiments / Eksperimenti sa zakretnim momentom
Torque is the force the turbine releases to produce mechanical energy through rotational motion. The kinetic power received by each blade in a vertical turbine is not uniform because the locations of the blades are not all in front of the flow front, unlike in a horizontal turbine. This condition causes vertical turbines to have more significant torque fluctuations than horizontal turbines. Vertical turbine blades on the upstream side will receive a more significant hydrodynamic load than on the downstream so that the upstream torque is greater than the downstream, which causes torque fluctuations during the turbine rotation. Large torque fluctuations cause severe vibrations that fatigue the turbine [37,38], break the turbine shaft [22], and potentially damage turbine components [39]. Figure 8 shows the torque fluctuation curves on the straight-blade without and with FGV for 120 seconds. However, the graph shows that the curve of the red diamond line (straight-blade with FGV) is above the blue triangle line (straight-blade without FGV), which is then clarified with a zoomed view from 0 – 40 seconds. In addition, the graph also shows that torque fluctuations in straight-blade without FGV appear to have a more significant difference than with FGV. However, it needs to be considered to determine the torque fluctuation value of the straight-blade without FGV and with FGV.
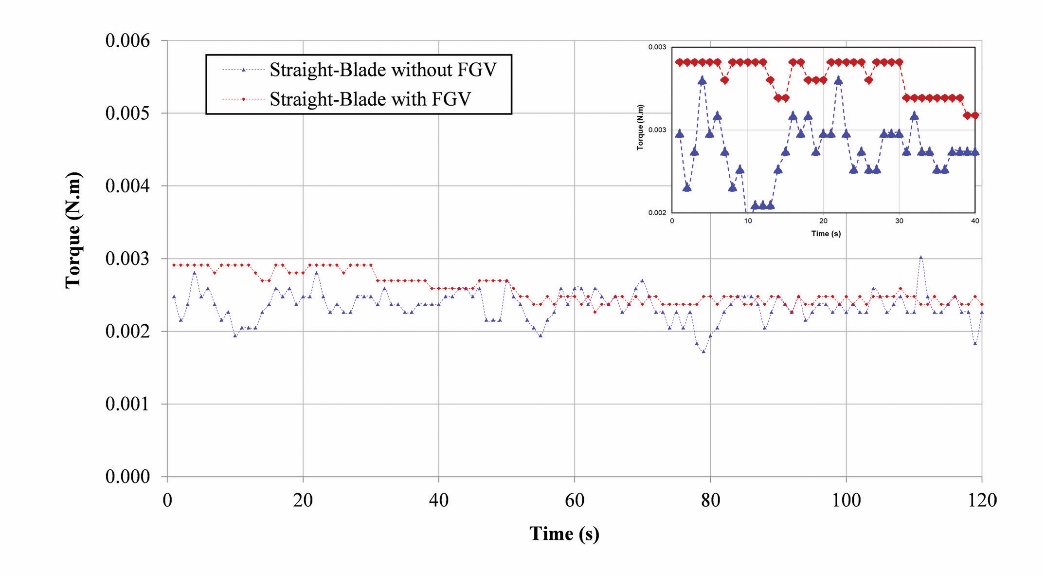
Figure 8. Torque time series on straight-blade without FGV and with FGV
Slika 8. Vremenske serije zakretnog momenta na ravnoj lopatici bez FGV-a i s FGV-om
Calculation of the torque fluctuation value can be calculated using the torque ripple factor (TRF) formulation, namely, calculating the difference between the maximum torque coefficient ( ) and the minimum torque coefficient ( ) during the time the turbine rotates [40]. Figure 9 compares the TRF values of all ranges on straight-blade without FGV and with FGV for both the corrected and uncorrected velocity. The graph shows that the red diamond line curve (straight-blade with FGV) is below the blue triangle line curve (straight-blade without FGV). This curve shows excellent results because FGV can reduce the difference in torque fluctuations in the straight-blade vertical axis ocean current turbine. Thus, it will reduce the potential damage to turbine components, such as vibration on the shaft and even break. The TRFmax values for straight-blade without FGV and with FGV, respectively, occur at 0.03 and 0.04, with a difference of up to 44%. TRFmin in straight-blade without FGV and with FGV, respectively, occurs at 1.28 and 1.52, with a difference of up to 58%. A nearly identical trend can also be found for the corrected data. The TRF value is the same, while the TSR decreased slightly.
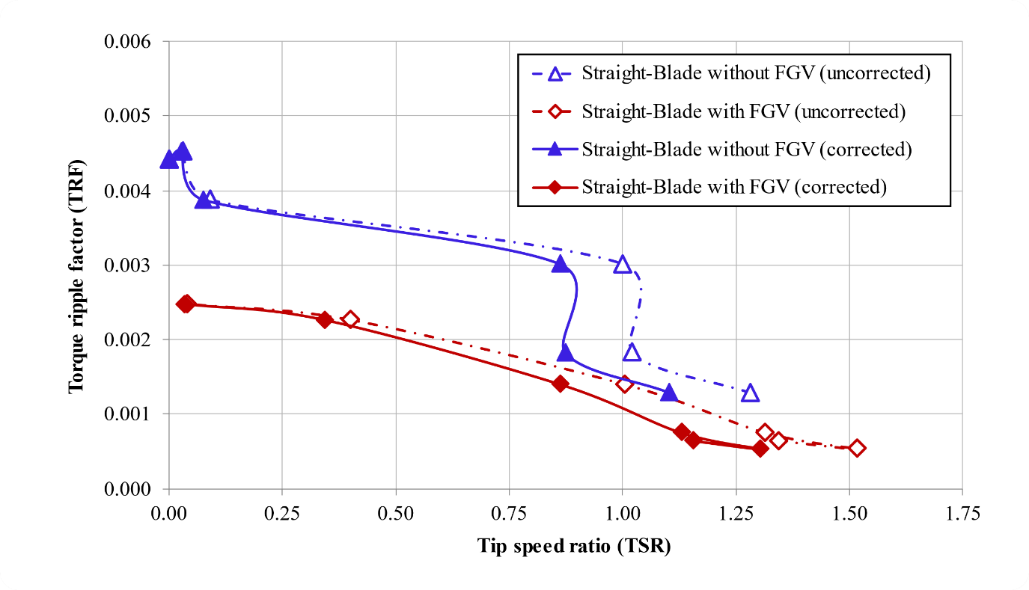
Figure 9. Comparison of torque ripple factor on straight-blade without FGV and with FGV
Slika 9. Usporedba faktora valovitosti zakretnog momenta na ravnoj lopatici bez FGV-a i s FGV-om
The torque fluctuated during the sampling time, starting from the turbine starting to rotate for 120 seconds, and then the average value was taken from each range. This average torque value is investigated in this study to determine the effect of FGV on the torque generated by the turbine. The greater the torque value, the turbine has better performance because it can produce more mechanical power by adjusting the optimal turbine rotational speed value, as in Equation 4. The torque coefficient ( ) can also represent the turbine torque value, which is calculated using Equation 3. Figure 10 compares to in turbines without FGV and with FGV. The graph shows that the red diamond line curve (straight-blade with FGV) is above the blue triangle line curve (straight-blade without FGV) in all ranges. The value in a straight-blade without FGV is 0.56 at a of 0, meaning that in this condition, the turbine does not rotate but produces ample torque. The straight-blade with FGV can make a of 0.83 at a of 0.04, meaning that even though the turbine rotation is very slow, it produces ample torque. In this case, the represents the value of the turbine's rotational speed, where a small value indicates the turbine rotates slowly. The corrected data is also in Figure 10, with relatively lower values for both the x and y-axis components. This is because the corrected current velocity affects both the x and y-axis parameters.
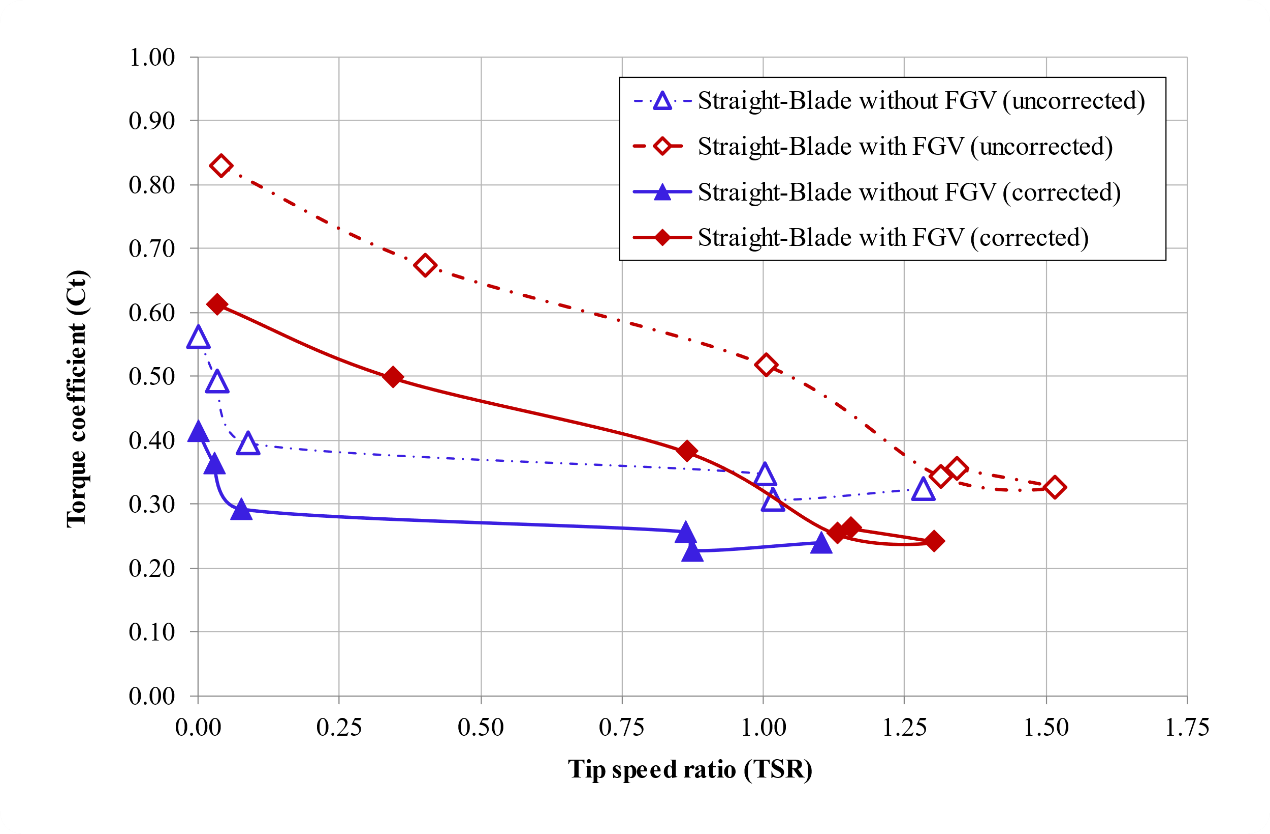
Figure 10. Comparison of torque coefficient between straight-blade without FGV and with FGV
Slika 10. Usporedba koeficijenta zakretnog momenta između ravne lopatice bez FGV-a i s FGV-om
Conversely, an enormous value indicates the turbine rotates quickly. If the value is 0, there are two possibilities; first, the turbine does not rotate because of the more significant torque force released compared to the flow force hitting the turbine; second, there is no kinetic power absorbed by the turbine. Figure 10 shows that the lower the TSR value, the greater the torque coefficient. This is due to the increased torque braking load so that the torque value becomes prominent and the rotating speed of the turbine decreases until the point is zero, and the turbine stalls; the same result has also been done by Talukdar et al. [19]. However, FGV can make the straight-blade vertical axis ocean current turbine generate ample torque but not stall the turbine to produce better mechanical power production. This study has proven that FGV can increase the value of straight-blade vertical axis ocean current turbines in all ranges. The value of the increase in and due to FGV in a straight-blade is 32% and 6%, respectively.
4.3 Power Coefficient Experiments / Eksperimenti s koeficijentom snage
Power coefficient ( ) is a non-dimensional form of turbine mechanical power obtained from the formulation in Equation 5. In simple terms, can be interpreted as the turbine's ability to absorb kinetic energy from current flow or commonly known as efficiency. The amount of turbine mechanical power is influenced by the torque ( ) and the rotational speed of the turbine (ω), as in Equation 4. So if certain conditions have shown ample torque, it does not necessarily produce sizeable mechanical power or because a factor ω also affects it. As previously explained, a very low of 0.04 can make the in a straight-blade with FGV. This condition has greater power compared to turbines without FGV. However, compared to other s in the same straight-blade conditions (e.g. straight-blade with FGV), it does not necessarily produce greater power because a ω factor also affects it. This section discusses the results of the investigation of the effect of FGV on produced by the straight-blade vertical axis ocean current turbine.
Figure 11 compares to in straight-blade without FGV and with FGV. The graph shows that the red diamond line curve (straight-blade with FGV) is above the blue triangle line curve (straight-blade without FGV) in all ranges. The benefit of using FGV is that it can accelerate the current velocity with the same function as a flow deflector [41,42, 43]. The graph also shows that the value increases with increasing . This differs from the torque case in that the value of increases as the decreases. This means that the turbine rotational speed factor (ω) also plays an essential role in influencing the magnitude of the turbine's mechanical power performance. The value that could be produced in this experiment was low because it was below 2. For the corrected data, the trend is found to be similar to the curves. The turbine generates a notably lower while operating at a lower TSR than the uncorrected data.
In contrast, generally began to stall after passing a high of 2-3 range, while a very high of 4-6 had experienced a significant decrease. The low in this study is due to the shallow current speed conditions generated by the water tunnel, 0 - 0.18 m/s. In this case, it shows that the straight-blade without FGV has three blue triangle line points at a very low (closer to 0), while the straight-blade with FGV only has one red diamond line point at a very low (closer to 0). That is, FGV can make the straight-blade move faster towards a greater than zero TSR. It can be seen on the chart that the second and third red diamond line points are at 0.4 and 1, respectively, while the second and third blue triangle line points are at 0.03 and 0.09, respectively, very far behind. The lowest produced by a straight-blade with FGV is 0.033 at a of 0.04, while for a straight-blade without FGV, the lowest is 0 and at a of 0. A straight-blade with FGV can absorb better kinetic energy than without FGV. The in the straight-blade with FGV occurs at 1 with a value of 0.519, while the in the turbine without FGV occurs at 1.28 with a value of 0.415. That is, FGV can make straight-blade produce faster than without FGV and increase the value by up to 20%. The use of FGV (50˚ pitch angle) in this study can produce a better (0.519) than guide-vane-augmented at pitch angles of 0˚, -30˚, and 30˚ with values of 0.37, 0.31, and 0.28 respectively, by Liu et al. [17].
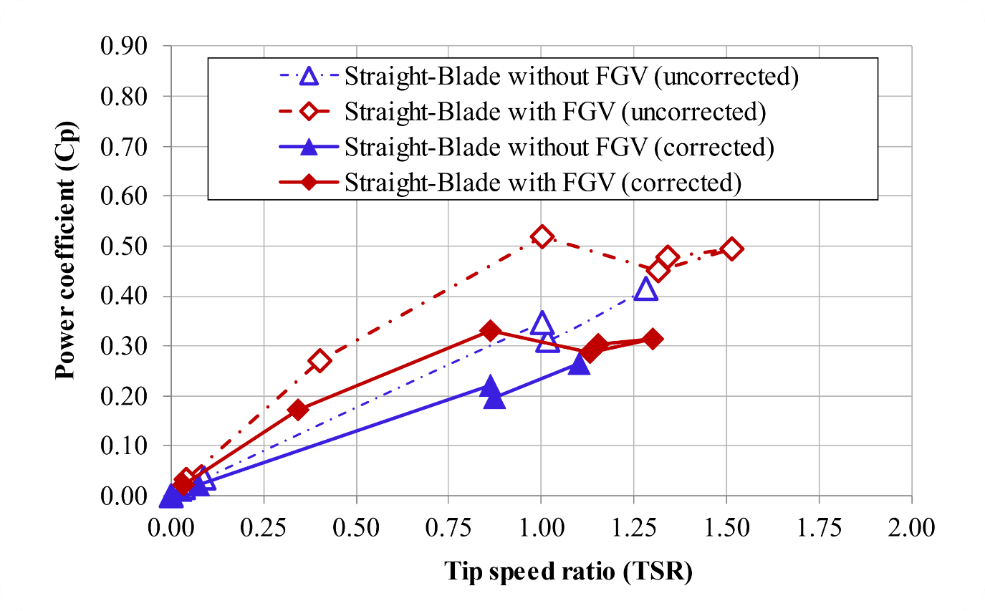
Figure 11. Comparison of power coefficient between straight-blade without FGV and with FGV
Slika 11. Usporedba koeficijenta snage između ravne lopatice bez FGV-a i s FGV-om
After the , the turbine loses its lift force which causes to stall on the straight-blade without FGV or with FGV. However, the stall in straight-blade without FGV is earlier than with FGV. This means that FGV can slow down stall events in straight-blade which means it can maintain a more extended lift force. stall on the straight-blade without FGV and with FGV, respectively 0.312 ( 1.02) and 0.451 ( 1.31). Even in stall conditions, FGV can increase the of the straight-blade by 31%. Post-stall on straight-blade without FGV and with FGV starts to increase again, which means the lift force is maintained. In general, post-stall turbine will continue to decrease significantly, but in this study, there was an increase in post-stall . This event is possible because the range is still very low (0 – 1.52), so there is a possibility that will continue to rise as the increases so that there will be a significant stall at a high . This research can be further investigated in a water tunnel or open channel facility capable of producing higher current speeds to produce a high to determine the distribution of over a more comprehensive range.
4.4 Flow Visualization Experiments / Eksperimenti vizualizacije protoka
Overall, the foil guide vane (FGV) is proven to improve the straight-blade vertical axis ocean current turbine performance regarding self-starting ability, torque coefficient, and power coefficient. Improved performance in straight-blade due to adding FGV can also be proven by looking at the flow visualization through the blades and FGV. This study carried out a flow visualization experiment using ink injection placed in front of the turbine. The camera is placed next to the mini water tunnel to make it easier to take videos of the movement of the injected ink. In contrast, the video is not taken from the top because the upper structure covers the turbine, making its movement invisible. The mini water tunnel is set at a current speed of 0.101 m/s because, from the test results, it is easiest to detect ink movement compared to more significant current speeds making ink movement too fast and difficult to visualize. The results of the flow visualization video recording are played slowly to determine the movement of the ink every second.
Figure 12 compares the flow visualization experiments' results on straight-blade without FGV and with FGV. The ink distribution from injection to behind the turbine shows a very significant difference in Figures 12 (a) and 12 (b). When the video is taken 1 second after the ink is injected, the straight-blade without FGV shows that the ink hits the blade marked with a red box line in Figure 12(a). That is, this condition indicates the straight-blade's readiness to extract the flow's kinetic power. In straight-blade with FGV, at 1 second, the ink enters the FGV slot, then slightly comes out of the FGV slot on the other side marked with a yellow box line. That is, this condition indicates a slight force exerted by the straight-blade to eject ink so that by that time, the turbine has already extracted the kinetic power of the flow. So that at that 1 second, the straight-blade with FGV can extract kinetic energy earlier than without FGV. This event can prove that straight-blade with FGV has better self-starting capabilities than without FGV.
Furthermore, 2 seconds after the ink is injected, the straight-blade without FGV shows that the ink spreads widely behind the turbine rotor, more or less along 2D and looks very thick. Meanwhile, on the straight-blade with FGV, it can be seen that the ink is visible very little behind the turbine rotor, approximately 0.5D long and looks very thin. Furthermore, within 3 seconds after the ink is injected, the straight-blade without FGV shows that the ink behind the turbine rotor continues to expand until it reaches approximately 3.5D, but it looks thinner. Meanwhile, in the straight-blade with FGV, ink is not visible behind the turbine rotor, but it is visible on the side of the FGV, and it hits the leg structure, making it darker. The events of the 2nd and 3rd seconds illustrate that the straight-blade with FGV slows down the current speed behind the turbine rotor, meaning that the kinetic energy behind the turbine rotor becomes smaller because some of it has been extracted by the straight-blade with FGV into mechanical power, and vice versa what happens to the straight-blade without FGV. Therefore, FGV is proven to increase the power coefficient of the straight-blade vertical axis ocean current turbine.
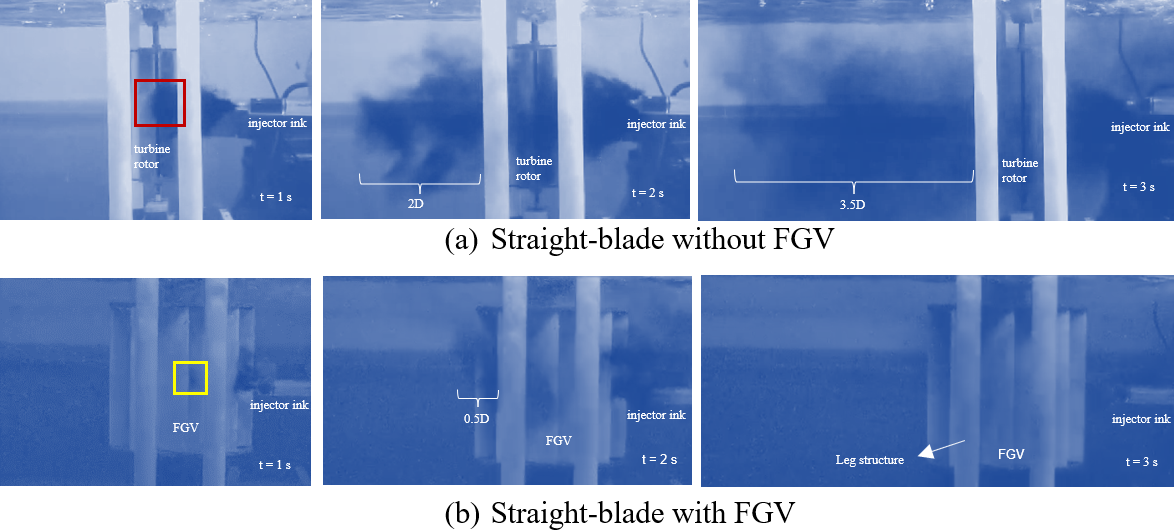
Figure 12. Comparison of flow visualization on straight-blade without FGV and with FGV
Slika 12. Usporedba vizualizacije protoka na ravnoj lopatici bez FGV-a i s FGV-om
5. CONCLUSION / Zaključak
Experimental studies have been carried out in this study in a mini water tunnel at the Energy Systems Engineering laboratory facility, Institut Teknologi Sumatera, Indonesia. The effect of FGV on the straight-blade vertical axis ocean current turbine has been comprehensively investigated above, and four conclusions have been obtained as follows;
The foil guide vane is proven to be able to increase the self-starting capability of straight-blade vertical axis ocean current turbines at a minimum current speed of 0.091 m/s with a rotational speed value of up to 15.3 rpm compared to straight-blade without FGV at the same speed are unable to rotate. The rotational speed of the straight-blade increases as the current speed with blockage correction increases from 0.118, 0.123, 0.186, 189, and 0.209 m/s, with an increase of 35%, 36%, 41%, 38%, and 40%, respectively.
Foil guide vanes are proven to reduce the torque ripple factor (TRF) value on the straight-blade vertical axis ocean current turbine. This condition indicates that the turbine torque does not experience large fluctuations and avoids fatigue, vibration and damage to the turbine components. In addition, FGV can also increase turbine torque in all ranges, represented by the torque coefficient ( ) value. The increase in the and values due to FGV in the straight-blade is 32% and 6%, respectively.
Foil guide vanes are proven to increase the power coefficient on straight-blade vertical axis ocean current turbines in all ranges. The increase in corrected value due to FGV in straight-blade is 20% with corrected values in straight-blade without and with FGV of 0.264 and 0.330, respectively.
Foil guide vanes can absorb a lot of injection ink from the results of flow visualization investigations so that a lot of kinetic energy is absorbed and causes straight-blade performance to increase better than without FGV.
Based on these points, it can be concluded that FGV is proven to improve the performance of the straight-blade vertical axis ocean current turbine, self-starting, torque and power coefficient at low current speeds. Thus, FGV is very suitable for application in Indonesia which has a low current speed. As for optimizing the results of this study, in the future, a scale-up is needed to be tested on open channels so that they can condition the environment in the field. In addition, a numerical method is required with the help of computational fluid dynamics (CFD) to predict the flow performance around the turbine and a more comprehensive FGV.
Funding: The author thanks the research team and appreciates the research institutions and community service for Institut Teknologi Sumatera (ITERA) for funding this research under the “Penelitian Madya" scheme based on contract number 631v/IT9.2.1/PT.01.03/2023, 03 April 2023.
Conflict of interest: The authors have no conflicts of interest.
Author contributions: Conceptualization, M.M.; methodology, M.M., M., and D.S.; formal analysis, M.M. and D.S.; experimental investigation, M.M, and R.R.; resources, M.M, and R.R.; data curation, M.M, and R.R..; writing—original draft preparation, M.M., T.T., and P.Y; writing—review and editing, M.M., D.S., T.T., and A.I.; visualization, M.M., R.R., and S.W.B.; supervision, M.; project administration, J.J; Funding Acquisition, M.M. All authors have read and agreed to the published version of the manuscript.
Acknowledgments: The authors would like to express their gratitude to the Energy Systems Engineering Laboratory, Institut Teknologi Sumatera (ITERA), South Lampung, Indonesia for providing research facilities and assistance with experimental test.