From Map Projection to Semiotics
Umberto Eco's admiration for Charles S. Peirce (1839-1914) for ...
earning a living by drawing maps ... combined with the pleasure of knowledge given by the diving to the history of our cartographic discipline, reminded me of a relevant sixty-year-old text about the great scientist and authentic thinker - maybe the greatest of Logic of his time. It is based on unpublished (until then) manuscript material, in his collection of the same name in the Houghton Library at Harvard. The sixty-year-old mathematician Carolyn Eisele (1902−2000) - devoted scholar of Peirce's work - wrote the text in the early 1960s; it was then published in the Proceedings of the American Philosophical Society. The subject of her text is
the problem of cartographic projection. But what can a cartographic projection problem have to do with logic and its practical applications, which is the greatest challenge to Peirce's thinking?
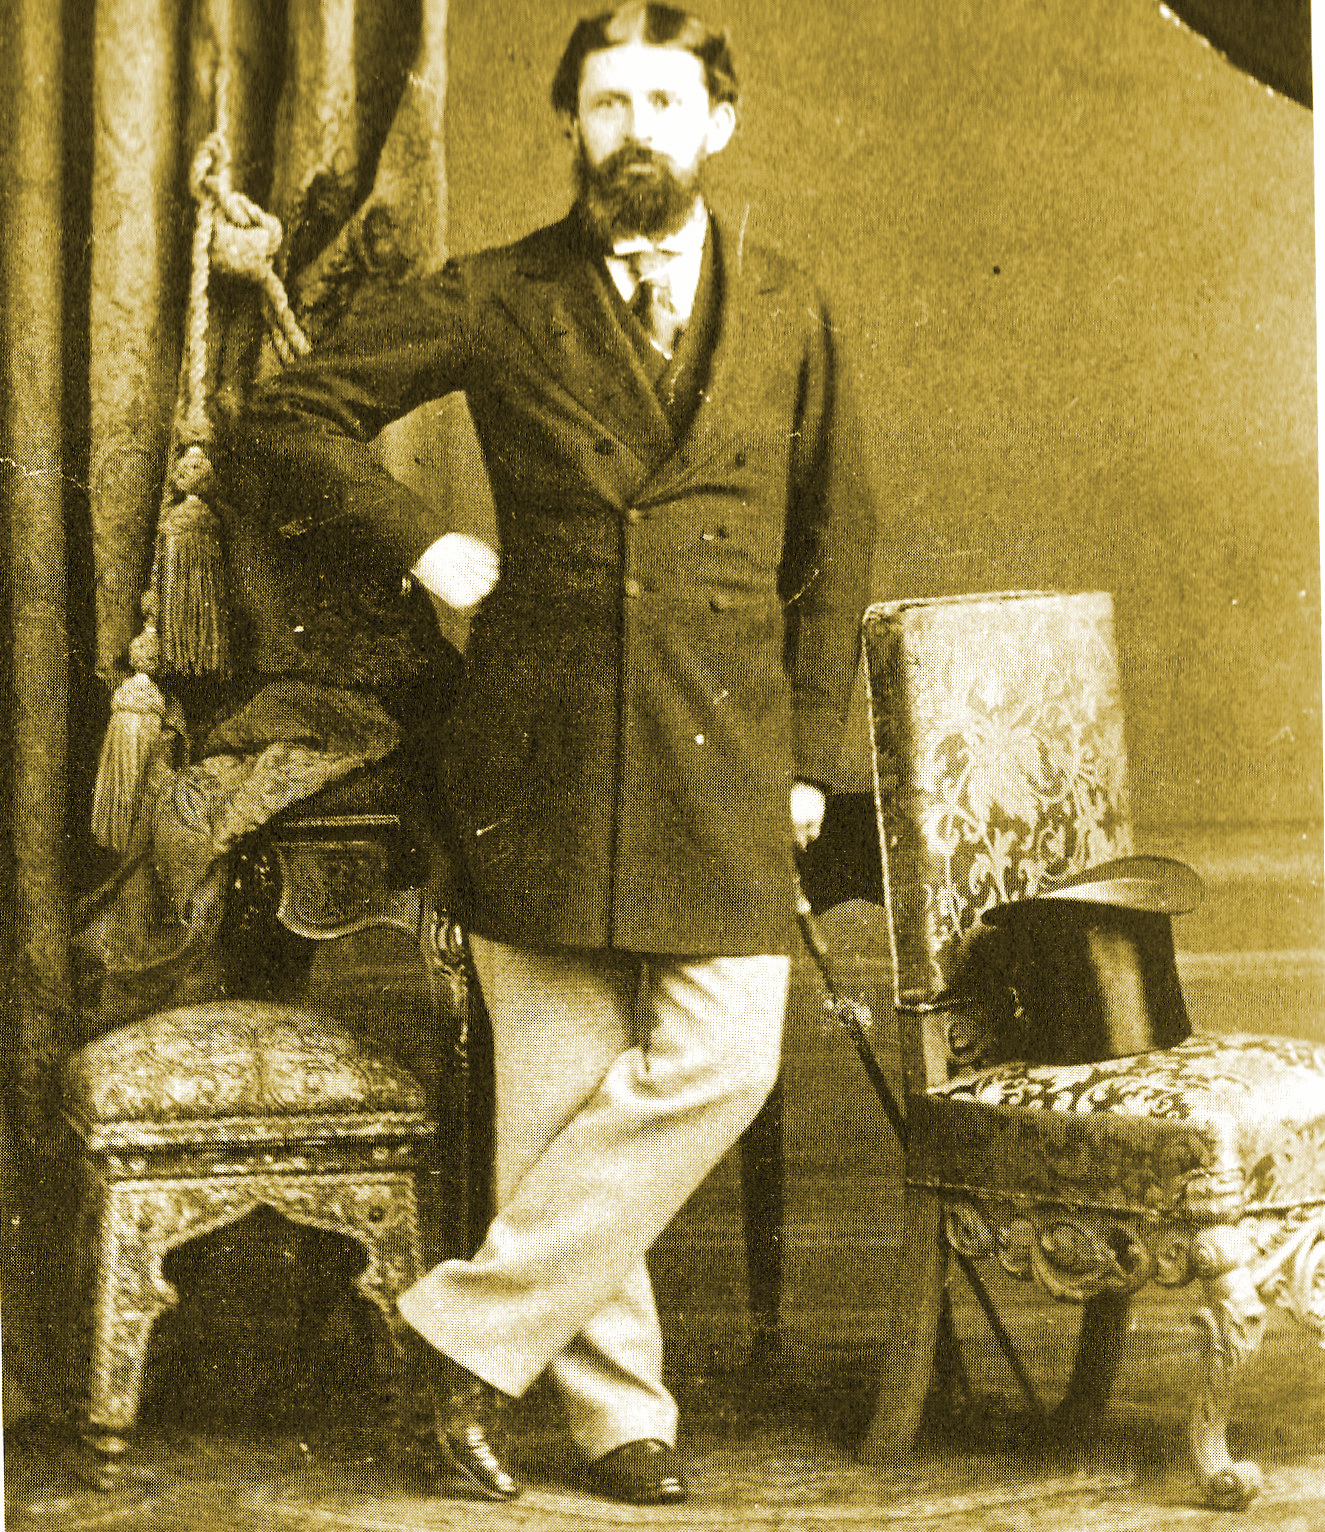
Charles S. Peirce

The manuscript was about the three practical conditions that the map projection had to satisfy: the angles had to be kept unchanged (conformality), the 'whole' of the earth's spherical surface had to be depicted in a finite map and the illustration should match the oblong shape of a page! The first practical condition was borrowed from Mercator (traditional projection in naval and air navigation maps), the second, to include the two poles of the sphere in the projection, and the third to fit the entire map in a notebook sheet - what more practical for easy use? Peirce proposed to his supervisor, at the service of the US Coast and Geodetic Survey, many such practical solutions to complex problems, but it was his 1879-map projection that remained in cartographic history as the
Peirce projection or
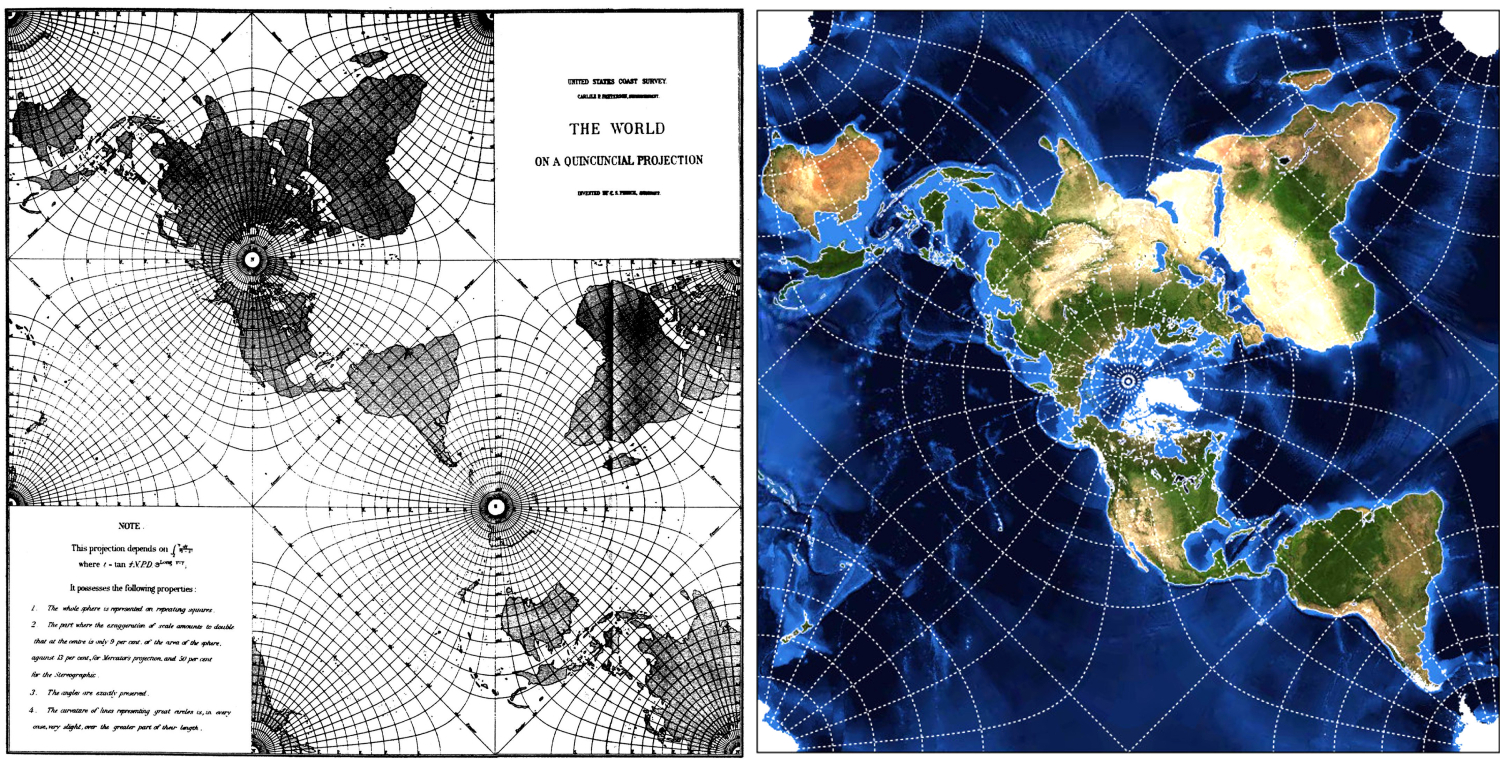
Peirce quincuncial projection.
Peirce quincuncial projection / Peircejeva kvinkunksna projekcija

To print a useful in applications map in his projection, Peirce bypassed the complex mathematics of conformal projections (e.g. complex functions, elliptic integrals) and the lack of computers and digital imaging, by devising a graphical design method so that visualization is possible in the last quarter of the 19
th century. The result of the graphic design was according to the same description: ...
the parallels have the same shape as the Coel surfaces about centres of attraction or repulsion inversely proportional to the distance and the meridians have the shape of the lines of force.
Upon an orthomorphic potential the parallels represent equipotential or level lines for the logarithmic projection, while the meridians are the lines of force. Consequently we may draw these lines by the method used by Max-well in his Electricity and Magnetism for drawing tlle corresponding lines for the Newtonian potential ...
the parallels have the same shape as the surfaces of the coil around the centres of attraction or repulsion inversely depending on the distance and the meridians have the shape of dynamic lines.
... paralele imaju isti oblik kao površine zavojnice oko centara privlačenja ili odbijanja obrnuto ovisno o udaljenosti, a meridijani imaju oblik dinamičkih linija.
It appears from his manuscripts that the idea for his projection came to Peirce on a trip to Paris in 1875-6. There he found that
... the best manuscript of Ptolemy's list of stars had never been transcribed correctly. He did it himself …
to place them in a modern atlas … and having the materials for new and improved identifications of the stars, he proposed in his service a …
new edition of Ptolemy's catalogue with identifications and notes … That's why he also suggested depicting Ptolemy's improved catalogues
on a map showing the stars and the formations of ancient constellations, I carefully studied a few years ago and put on my own globe. With this revised list of stars it would be possible to calculate latitudes, as presented at the American Academy of Arts and Sciences in 1876 and at the National Academy of Sciences in 1882, while engaging with the study of the shape of the earth and the gravity changes.
Peirce was thirty-one years old when the great Emma Hart Willard (1787-1870) died. Pioneer in introducing and promoting graphs and diagrams/charts in historical and geographical education in America. She influenced a whole generation of young Americans up to the American Civil War (1861-65). Since then, the volume of cognitive data in texts, that is, in words, has been transformed into images, into a visualized cognitive process, attracting the interest of young Americans, whose innate lively energy for action prevented them from focusing on European cognitive standards based more on texts - on words - and on the tradition of concentration discipline required to read books. Graphs facilitated the transmission of information and gained widespread acceptance by the American public, which has since made primarily its own model the cognitive power of the image, which it is constantly developing to this day, as science and cutting-edge technology.
The visualization of data, visual information, cognitive vision, the ability of 'seeing', the use of 'seeing rooms' in education, research, entrepreneurship, administration, governance, everyday life and in more other aspects of American life, is a typical, well implemented and established American legacy that dominates and develops to this day, with huge growth prospects. Willard believed, from experience, that
the visual, as a teaching tool, precedes the oral, because it facilitates memorization, because through the visual the images are connected to the mind, more efficiently than the words. In this context, Willard was far from Harvard's perceptions and the strong defending of the words there, where young Peirce was trying in vain to pursue a career - his father was a Harvard astronomy professor - because of (probably) his physical difficulty in expressing himself in words, due to tormenting him facial neuralgia causing him a lack of linguistic expression. For him thus, a 'diagrammatic process' was the basic expression of his thinking. He devised for its development in Logic a diagrammatic mechanism called the 'existential graph'. He believed that graphs and diagrams had
a striking resemblance to his thoughts on any subject of philosophy and that logical truth had the same source as mathematical truth derived from observing the diagrams he drew on paper. His existential graphs symbolized logical expressions with symbols, introducing 'graphic logic' from 1882, cultivating it until his death. Peirce was a pioneer of graphic semiotics, which contributed to the advancement of Thematic Cartography after the middle of the 20
th century. The trisecting of the visual code-message in 'image', 'index' and 'symbol' is its main pillar.
The
quincuncial projection of the great American thinker is an example of graphic logic in the practical representation of the globe. He invented it and constructed it for the implementation needs in his service (with topographic and geodetic mission); especially for the studies of the gravity field of the earth. Peirce's map projection had not enjoyed wide uses. It is no coincidence, however, that his projection was survived and used after World War II, in a few, but unthinkable - in Peirce's times - applications in aviation and in some few other fields. Most striking, though, is the 'Peirce projection' that is now an avant-garde application in digital optics and graphic design, in implementation of spherical panoramic photography, in the architectural projection of spaces and in the photographic lens industry. It is included in GIS software and allows the tessellation of large surfaces. In addition, it has recently been used in depictions of astronomical phenomena with visual reference to the Earth's surface, with excellent supervisory results. The transformed square map, which is used to form the 'cross-like' map of Peirce, is uniform everywhere except at the corners. As astronomers explain,
Peirce projection, which is used to represent the night sky, can easily be rotated, if necessary, around the poles. This feature allows any area of interest to be displayed on the map with the least distortion.
All this is due to the great thinker Charles Spencer Peirce, who - according to his own saying - he learned
to think with diagrams and not with words.

