Skip to the main content

Book review

https://doi.org/doi.org/10.32909/kg.21.si.7

Od kartografske projekcije do semiotike

Evangelos Livieratos


Full text: english pdf 6.726 Kb

page 92-96

downloads: 0

cite

Full text: croatian pdf 6.726 Kb

page 93-97

downloads: 0

cite

Download JATS file


Abstract

Keywords

kartografske projekcije; semiotika; Charles S. Peirce

Hrčak ID:

290598

URI

https://hrcak.srce.hr/290598

Publication date:

3.1.2023.

Article data in other languages: english

Visits: 326 *


Notes

[1] quincunx (množina quincunxes ili quincunces) Raspored od pet jedinica od kojih četiri tvore kutove kvadrata, a peta u središtu kvadrata, uzorak koji odgovara pet točaka na kockicama, igraćim kartama ili dominama.

References / Literatura


Eisele C (1963) 'Charles S. Peirce and the Problem of Map-Projection'. Proceedings of the American Philosophical Society, 107, 4, (August 15, 1963), pp. 299- 307.


Peirce C.S. (1879) A quincuncial projection of the sphere: Amer. . Journal of Mathematics, 2, 4, 394- 396. Also in U.S. Coast Survey Report for the year ending with June 1877, pub. 1880, appendix no. 15, p. 191-192.


Schulten S (2020) 'Emma Willard's Maps of Time'. The Public Domain Reviewhttps://publicdomainreview.org/essay/emma-willard-maps-of-time ( 22.01.2020. )


Stanford Encyclopedia of Philosophy (2010) 'Peirce's Theory of Signs'.https://plato.stanford.edu/entries/peirce-semiotics ( substantive revision 15.11.2010. )


Wikipedia (2022) 'Peirce quincuncial projection'.https://en.wikipedia.org/wiki/Peirce_quincuncial_projection ( page was last edited 10.03.2022. )


This display is generated from NISO JATS XML with jats-html.xsl. The XSLT engine is libxslt.


From Map Projection to Semiotics

Umberto Eco's admiration for Charles S. Peirce (1839-1914) for ... earning a living by drawing maps ... combined with the pleasure of knowledge given by the diving to the history of our cartographic discipline, reminded me of a relevant sixty-year-old text about the great scientist and authentic thinker - maybe the greatest of Logic of his time. It is based on unpublished (until then) manuscript material, in his collection of the same name in the Houghton Library at Harvard. The sixty-year-old mathematician Carolyn Eisele (1902−2000) - devoted scholar of Peirce's work - wrote the text in the early 1960s; it was then published in the Proceedings of the American Philosophical Society. The subject of her text is the problem of cartographic projection. But what can a cartographic projection problem have to do with logic and its practical applications, which is the greatest challenge to Peirce's thinking?
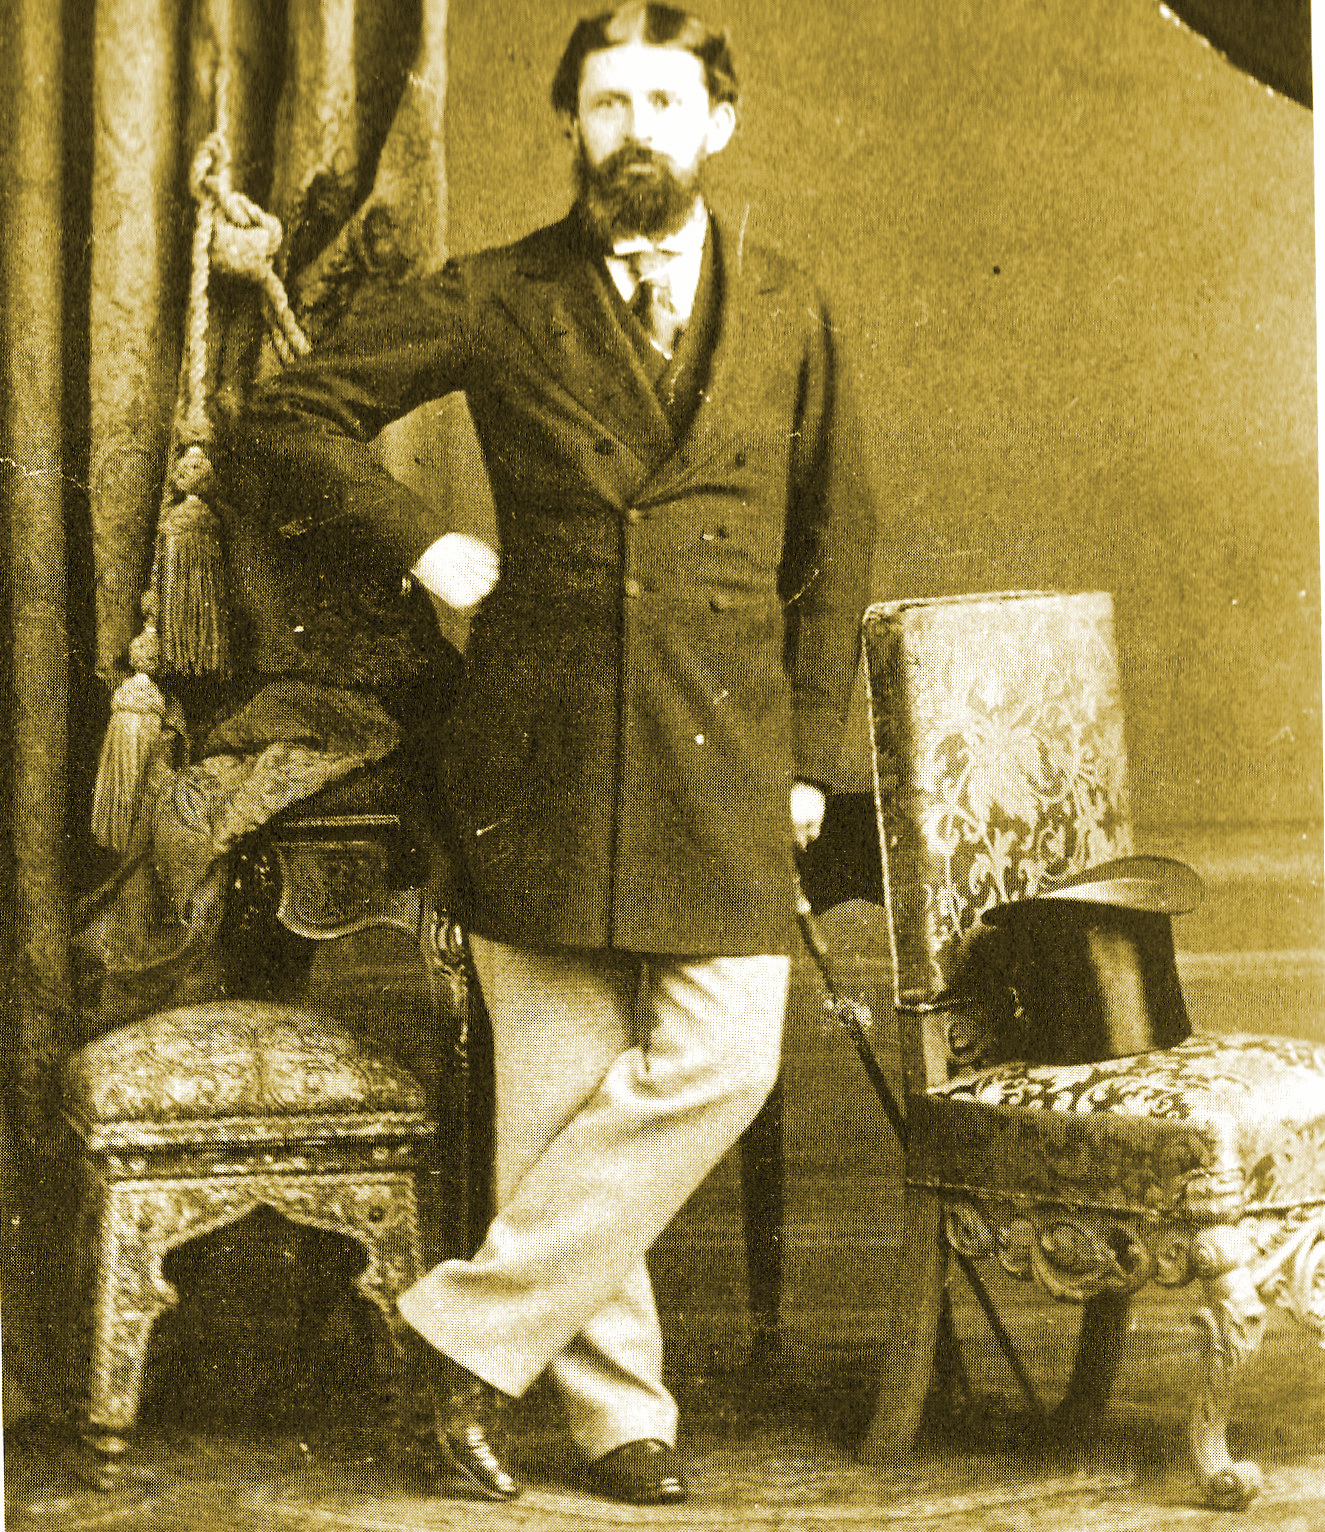
Charles S. Peirce
kig-21-92-g1.jpg

The manuscript was about the three practical conditions that the map projection had to satisfy: the angles had to be kept unchanged (conformality), the 'whole' of the earth's spherical surface had to be depicted in a finite map and the illustration should match the oblong shape of a page! The first practical condition was borrowed from Mercator (traditional projection in naval and air navigation maps), the second, to include the two poles of the sphere in the projection, and the third to fit the entire map in a notebook sheet - what more practical for easy use? Peirce proposed to his supervisor, at the service of the US Coast and Geodetic Survey, many such practical solutions to complex problems, but it was his 1879-map projection that remained in cartographic history as the Peirce projection or Peirce quincuncial projection.

Peirce quincuncial projection / Peircejeva kvinkunksna projekcija
kig-21-92-g2.jpg

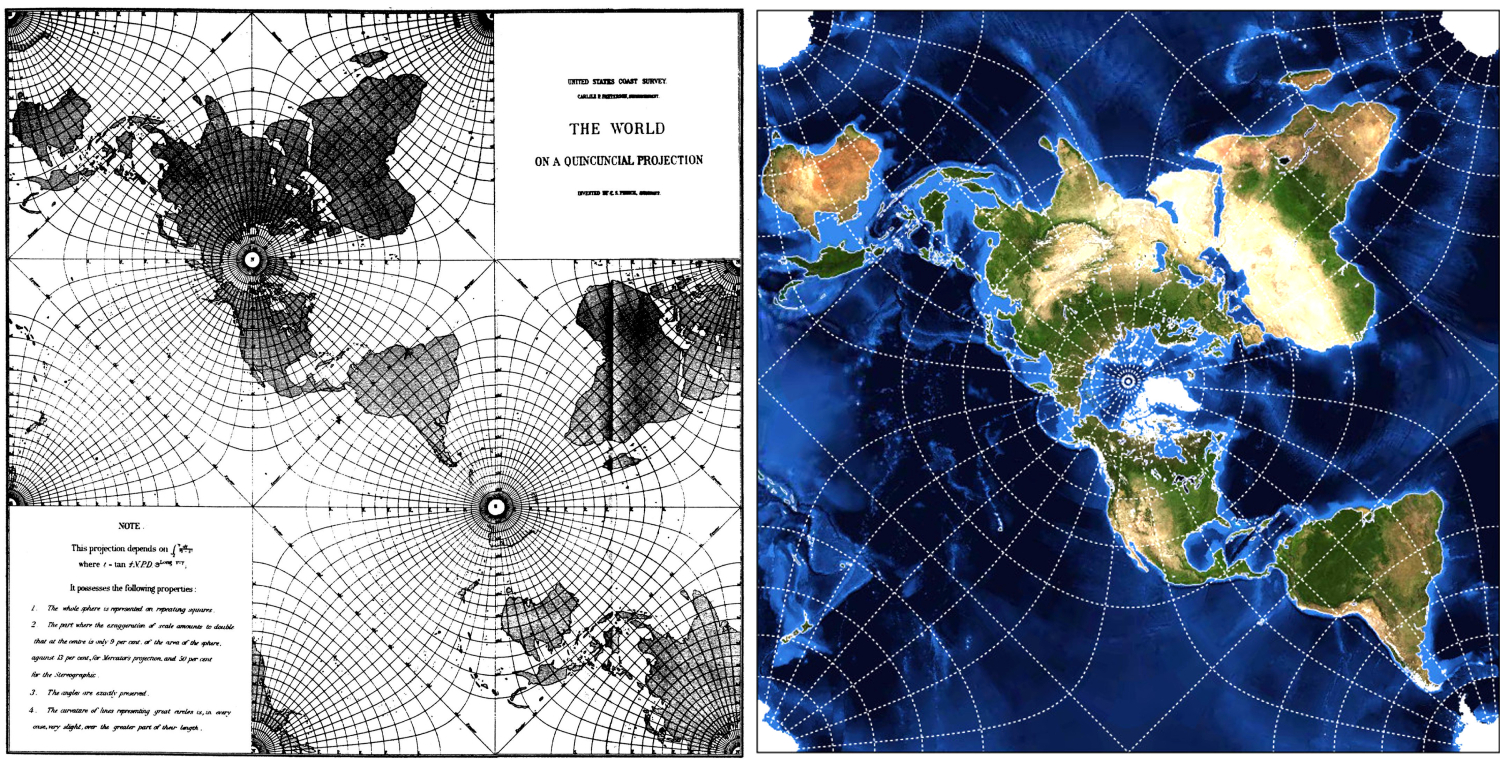
To print a useful in applications map in his projection, Peirce bypassed the complex mathematics of conformal projections (e.g. complex functions, elliptic integrals) and the lack of computers and digital imaging, by devising a graphical design method so that visualization is possible in the last quarter of the 19 th century. The result of the graphic design was according to the same description: ... the parallels have the same shape as the Coel surfaces about centres of attraction or repulsion inversely proportional to the distance and the meridians have the shape of the lines of force.

Upon an orthomorphic potential the parallels represent equipotential or level lines for the logarithmic projection, while the meridians are the lines of force. Consequently we may draw these lines by the method used by Max-well in his Electricity and Magnetism for drawing tlle corresponding lines for the Newtonian potential ... the parallels have the same shape as the surfaces of the coil around the centres of attraction or repulsion inversely depending on the distance and the meridians have the shape of dynamic lines.

... paralele imaju isti oblik kao površine zavojnice oko centara privlačenja ili odbijanja obrnuto ovisno o udaljenosti, a meridijani imaju oblik dinamičkih linija.

It appears from his manuscripts that the idea for his projection came to Peirce on a trip to Paris in 1875-6. There he found that ... the best manuscript of Ptolemy's list of stars had never been transcribed correctly. He did it himself … to place them in a modern atlas … and having the materials for new and improved identifications of the stars, he proposed in his service a … new edition of Ptolemy's catalogue with identifications and notes … That's why he also suggested depicting Ptolemy's improved catalogues on a map showing the stars and the formations of ancient constellations, I carefully studied a few years ago and put on my own globe. With this revised list of stars it would be possible to calculate latitudes, as presented at the American Academy of Arts and Sciences in 1876 and at the National Academy of Sciences in 1882, while engaging with the study of the shape of the earth and the gravity changes.

Peirce was thirty-one years old when the great Emma Hart Willard (1787-1870) died. Pioneer in introducing and promoting graphs and diagrams/charts in historical and geographical education in America. She influenced a whole generation of young Americans up to the American Civil War (1861-65). Since then, the volume of cognitive data in texts, that is, in words, has been transformed into images, into a visualized cognitive process, attracting the interest of young Americans, whose innate lively energy for action prevented them from focusing on European cognitive standards based more on texts - on words - and on the tradition of concentration discipline required to read books. Graphs facilitated the transmission of information and gained widespread acceptance by the American public, which has since made primarily its own model the cognitive power of the image, which it is constantly developing to this day, as science and cutting-edge technology.

The visualization of data, visual information, cognitive vision, the ability of 'seeing', the use of 'seeing rooms' in education, research, entrepreneurship, administration, governance, everyday life and in more other aspects of American life, is a typical, well implemented and established American legacy that dominates and develops to this day, with huge growth prospects. Willard believed, from experience, that the visual, as a teaching tool, precedes the oral, because it facilitates memorization, because through the visual the images are connected to the mind, more efficiently than the words. In this context, Willard was far from Harvard's perceptions and the strong defending of the words there, where young Peirce was trying in vain to pursue a career - his father was a Harvard astronomy professor - because of (probably) his physical difficulty in expressing himself in words, due to tormenting him facial neuralgia causing him a lack of linguistic expression. For him thus, a 'diagrammatic process' was the basic expression of his thinking. He devised for its development in Logic a diagrammatic mechanism called the 'existential graph'. He believed that graphs and diagrams had a striking resemblance to his thoughts on any subject of philosophy and that logical truth had the same source as mathematical truth derived from observing the diagrams he drew on paper. His existential graphs symbolized logical expressions with symbols, introducing 'graphic logic' from 1882, cultivating it until his death. Peirce was a pioneer of graphic semiotics, which contributed to the advancement of Thematic Cartography after the middle of the 20 th century. The trisecting of the visual code-message in 'image', 'index' and 'symbol' is its main pillar.

The quincuncial projection of the great American thinker is an example of graphic logic in the practical representation of the globe. He invented it and constructed it for the implementation needs in his service (with topographic and geodetic mission); especially for the studies of the gravity field of the earth. Peirce's map projection had not enjoyed wide uses. It is no coincidence, however, that his projection was survived and used after World War II, in a few, but unthinkable - in Peirce's times - applications in aviation and in some few other fields. Most striking, though, is the 'Peirce projection' that is now an avant-garde application in digital optics and graphic design, in implementation of spherical panoramic photography, in the architectural projection of spaces and in the photographic lens industry. It is included in GIS software and allows the tessellation of large surfaces. In addition, it has recently been used in depictions of astronomical phenomena with visual reference to the Earth's surface, with excellent supervisory results. The transformed square map, which is used to form the 'cross-like' map of Peirce, is uniform everywhere except at the corners. As astronomers explain, Peirce projection, which is used to represent the night sky, can easily be rotated, if necessary, around the poles. This feature allows any area of interest to be displayed on the map with the least distortion.

All this is due to the great thinker Charles Spencer Peirce, who - according to his own saying - he learned to think with diagrams and not with words.

Notes

[1] quincunx (množina quincunxes ili quincunces) Raspored od pet jedinica od kojih četiri tvore kutove kvadrata, a peta u središtu kvadrata, uzorak koji odgovara pet točaka na kockicama, igraćim kartama ili dominama.


Od kartografske projekcije do semiotike

Divljenje Umberta Eca Charlesu S. Peirceu (1839−1914) zbog ... zarađivanja za život crtanjem karata ... u kombinaciji s užitkom znanja koje pruža uranjanje u povijest naše kartografske discipline, podsjetilo me na relevantan šezdeset godina star tekst o velikom znanstveniku i autentičnom misliocu − možda najvećem logičaru svojega doba. Temelji se na neobjavljenom (do tada) rukopisnom materijalu, u njegovoj istoimenoj zbirci u knjižnici Houghton na Harvardu. Šezdesetogodišnja matematičarka Carolyn Eisele (1902−2000) - predana proučavateljica Peircejeva djela - napisala je tekst ranih 1960-ih; zatim je objavljen u Proceedings of the American Philosophical Society. Tema njezina teksta je problem kartografske projekcije. Ali kakve veze može imati problem kartografske projekcije s logikom i njezinim praktičnim primjenama, što je bio najveći izazov Peircejeva razmišljanja?

Rukopis se odnosio na tri praktična uvjeta koje je kartografska projekcija morala zadovoljiti: kutovi su morali ostati nepromijenjeni (konformnost), "cijela" Zemljina sferna površina morala je biti prikazana na konačnoj karti, a ilustracija bi trebala odgovarati izduženom obliku stranice! Prvi praktični uvjet posuđen je od Mercatora (tradicionalna projekcija u pomorskim i zračnim navigacijskim kartama), drugi, da se u projekciju uključe dva pola sfere, a treći da se cijela karta smjesti na list bilježnice - što praktičnije za jednostavnu upotrebu? Peirce je predložio svom nadređenom, u službi US Coast and Geodetic Survey, mnoga takva praktična rješenja složenih problema, ali je njegova kartografska projekcija iz 1879. ostala u kartografskoj povijesti kao Peircejeva projekcija ili Peircejeva kvinkunksna [1] projekcija.

Kako bi u svojoj projekciji nacrtao kartu korisnu za primjenu, Peirce je zaobišao složenu matematiku konformnih projekcija (npr. složene funkcije, eliptične integrale) te nedostatak računala i digitalnih slika, osmislivši metodu grafičkog dizajna tako da je vizualizacija bila moguća u posljednjoj četvrtini 19. stoljeća. Rezultat grafičkog dizajna bio je u skladu s ovim opisom.... Kod ortomorfnog potencijala paralele predstavljaju ekvipotencijalne ili nivo linije za logaritamsku projekciju, dok su meridijani silnice. Posljedično, te linije možemo nacrtati metodom kojom se koristio Maxwell u svojoj knjizi Electricity and Magnetism za crtanje odgovarajućih linija Newtonova potencijala (Peirce 1879).

Iz njegovih rukopisa proizlazi da je Peirceju ideja za njegovu projekciju došla na putovanju u Pariz 1875−6. Tamo je otkrio da ... najbolji rukopis Ptolemejevog popisa zvijezda nikada nije bio ispravno prepisan. Učinio je to sam ... da ih smjesti u moderni atlas ... i imajući materijale za nove i poboljšane identifikacije zvijezda, predložio je svojoj službi ... novo izdanje Ptolomejeva kataloga s identifikacijama i bilješkama. Zato također predlaže prikaz Ptolomejevih poboljšanih kataloga na karti koja prikazuje zvijezde i formacije drevnih zviježđa, koju sam pažljivo proučio prije nekoliko godina i stavio na svoj globus. S tim revidiranim popisom zvijezda bilo bi moguće izračunati geografske širine, kako je predstavljeno Američkoj akademiji znanosti i umjetnosti 1876. i Nacionalnoj akademiji znanosti 1882., dok se bavio proučavanjem Zemljina oblika i promjenama gravitacije.

Peirce je imao trideset i jednu godinu kada je umrla slavna Emma Hart Willard (1787-1870), pionirka u uvođenju i promicanju grafova i dijagrama/karata u obrazovanju povijesti i geografije u Americi. Utjecala je na cijelu generaciju mladih Amerikanaca sve do Američkog građanskog rata (1861−1865). Od tada se mnoštvo kognitivnih podataka u tekstovima, odnosno riječima, pretvara u slike, u vizualizirani kognitivni proces, privlačeći interes mladih Amerikanaca, čija je urođena živa energija za akciju sprječavala da se usredotoče na europske kognitivne standarde utemeljene više na tekstovima - na riječima - i na tradiciji discipline koncentracije koja je potrebna za čitanje knjiga. Grafovi su olakšali prijenos informacija i stekli široku prihvaćenost u američkoj javnosti, koja je od tada prvenstveno svoj model napravila kognitivnom snagom slike, koju neprestano razvija do danas, kao znanost i vrhunsku tehnologiju.

Vizualizacija podataka, vizualnih informacija, kognitivni vid, sposobnost "viđenja", upotreba "soba za gledanje" u obrazovanju, istraživanju, poduzetništvu, administraciji, upravljanju, svakodnevnom životu i u više drugih aspekata američkog života, tipično je, dobro primijenjeno i uspostavljeno američko nasljeđe koje dominira i razvija se do danas, s velikim izgledima za rast. Willard je iz iskustva vjerovala da vizualno, kao nastavno sredstvo, prethodi usmenom, jer olakšava pamćenje, jer su kroz vizualno slike povezane s umom, učinkovitije od riječi. U tom kontekstu, Willard je bila daleko od percepcije Harvarda i tamošnje snažne obrane riječi, gdje je mladi Peirce uzalud pokušavao ostvariti karijeru - otac mu je bio profesor astronomije na Harvardu - zbog (vjerojatno) fizičkih poteškoća u izražavanju riječima, zbog mučenja neuralgije lica koja mu je uzrokovala nedostatak jezičnog izražavanja. Stoga je za njega "dijagramski proces" bio osnovni izraz njegova mišljenja. Osmislio je za svoj razvoj u logici dijagramski mehanizam nazvan "egzistencijalni graf". Vjerovao je da grafikoni i dijagrami imaju nevjerojatnu sličnost s njegovim razmišljanjima o bilo kojoj temi filozofije i da logička istina ima isti izvor kao i matematička istina izvedena iz promatranja dijagrama koje je crtao na papiru. Njegovi egzistencijalni grafikoni simbolizirali su logičke izraze znakovima, uvodeći "grafičku logiku" od 1882., i njegujući je do svoje smrti. Peirce je bio pionir grafičke semiotike, što je pridonijelo napretku tematske kartografije nakon sredine 20. stoljeća. Trisekcija vizualnog koda-poruke na "sliku", "indeks" i "simbol" njegov je glavni stup.

Kvinkunksna projekcija velikog američkog mislioca primjer je grafičke logike u praktičnom prikazu globusa. Izumio ju je i konstruirao za potrebe primjene u svojoj službi (s topografsko-geodetskom zadaćom); posebno za proučavanje Zemljina gravitacijskog polja. Peircejeva kartografska projekcija nije imala široku primjenu. Međutim, nije slučajno da je njegova projekcija preživjela i upotrebljavana nakon Drugog svjetskog rata, u nekoliko, gotovo nezamislivih primjena u Peircejevo doba − u zrakoplovstvu i nekoliko drugih područja. Ipak, najupečatljivija je da je "Peircejeva projekcija" danas avangardna s primjenom u digitalnoj optici i grafičkom dizajnu, u primjenama sferne panoramske fotografije, u arhitektonskoj projekciji prostora i u industriji fotografskih objektiva. Sadržana je u softverima za GIS i omogućuje teselaciju velikih površina. Osim toga, nedavno se koristila u prikazima astronomskih fenomena s vizualnom referencom na Zemljinu površinu i s izvrsnim rezultatima nadziranja. Transformirana karta u obliku kvadrata, koja se koristi za oblikovanje Peircejeve karte "nalik na križ" ujednačena je posvuda osim u vrhovima kvadrata. Kako astronomi objašnjavaju, Peircejeva projekcija, koja se koristi za prikaz noćnog neba, može se lako rotirati, ako je potrebno, oko polova. To svojstvo omogućuje da se bilo koje područje od interesa prikaže na karti uz najmanje deformacije. Za sve je to zaslužan veliki mislilac Charles Spencer Peirce, koji je - prema vlastitom kazivanju - naučio razmišljati dijagramima, a ne riječima.

Notes

[1] quincunx (množina quincunxes ili quincunces) Raspored od pet jedinica od kojih četiri tvore kutove kvadrata, a peta u središtu kvadrata, uzorak koji odgovara pet točaka na kockicama, igraćim kartama ili dominama.