
Introduction
It is a known fact that all types of soybean [Glycine max (L.) Merr.] contain numerous bio-molecules, like isoflavones, phenolic compounds, tocopherols, soy peptides, lecithin, saponins, sterols, and vitamin C, that quench free radicals by donating a hydrogen atom or an electron (Tripathi and Misra, 2005;Kumar et al., 2010;Lee et al., 2011). Soybean, as a component of daily diet, has gained worldwide importance as functional food that can provide protection against free radicals and oxidative damage, which are a major cause of diseases of our time, such as atherosclerosis, diabetes, and cancer (Salgado and Donado-Pestana, 2011). Phenols are a large class of secondary plant metabolites, showing a diversity of structures, from rather simple structures, e.g. phenolic acids, to phenols such as flavonoids that comprise of several groups, to polymeric compounds based on these different classes. Some phenolic compounds, such as isoflavones in soybeans, are extremely widespread, while others are restricted or particularly abundant in specific plants (Cheynier, 2012). Along with their antioxidant properties, phenolic compounds play an important role in the metabolism of the plant itself. According to their carbon chain, they can be separated into 16 major classes (Dey and Harborne, 1989) and all of them are involved in many plant functions, such as pollination, structure, sensorial properties (color, aroma, taste and astringency), germination processes, resistance to pests and predators, growth, as well as development and reproduction (Colpas et al., 2003;Malenčić et al., 2012). Flavonoids are phenolic compounds commonly found in many plants, vegetables, and flowers. The flavonoid family comprises 15 classes of compounds, including the flavones, flavonols, flavanones, chalcones, and isoflavones. Although flavonoids are ubiquitous, isoflavones can be found only in legumes, particularly soybean (Boue et al., 2003). It is known that flavonoids are among the most potent plant antioxidants as well as the most widely distributed phenolic compounds in plant foods, and also the most studied ones (Bravo, 1998). Health-promoting effects of soybean have been attributed to its antioxidative effect, as well as to the estrogen-like activity of isoflavones, which has been reported to reduce the risk of breast cancer and osteoporosis (Messina and Messina, 2010). Recently, legumes are gaining interest because they are excellent sources of bioactive compounds and can be important sources of ingredients for uses in functional foods and other applications. The bioactive compound content of legumes is generally affected by genetic (genotype) and environmental (weather, soil type, geographical location) factors (Malenčić et al., 2012). Regarding soybean grain composition, it can be treated as a functional food because of its innumerable desirable characteristics and because there is strong evidence that additive and synergistic It is a known fact that all types of soybean [Glycine max (L.) Merr.] contain numerous bio-molecules, like isoflavones, phenolic compounds, tocopherols, soy peptides, lecithin, saponins, sterols, and vitamin C, that quench free radicals by donating a hydrogen atom or an electron (Tripathi and Misra, 2005;Kumar et al., 2010;Lee et al., 2011). Soybean, as a component of daily diet, has gained worldwide importance as functional food that can provide protection against free radicals and oxidative damage, which are a major cause of diseases of our time, such as atherosclerosis, diabetes, and cancer (Salgado and Donado-Pestana, 2011). Phenols are a large class of secondary plant metabolites, showing a diversity of structures, from rather simple structures, e.g. phenolic acids, to phenols such as flavonoids that comprise of several groups, to polymeric compounds based on these different classes. Some phenolic compounds, such as isoflavones in soybeans, are extremely widespread, while others are restricted or particularly abundant in specific plants (Cheynier, 2012). Along with their antioxidant properties, phenolic compounds play an important role in the metabolism of the plant itself. According to their carbon chain, they can be separated into 16 major classes (Dey and Harborne, 1989) and all of them are involved in many plant functions, such as pollination, structure, sensorial properties (color, aroma, taste and astringency), germination processes, resistance to pests and predators, growth, as well as development and reproduction (Colpas et al., 2003;Malenčić et al., 2012). Flavonoids are phenolic compounds commonly found in many plants, vegetables, and flowers. The flavonoid family comprises 15 classes of compounds, including the flavones, flavonols, flavanones, chalcones, and isoflavones. Although flavonoids are ubiquitous, isoflavones can be found only in legumes, particularly soybean (Boue et al., 2003). It is known that flavonoids are among the most potent plant antioxidants as well as the most widely distributed phenolic compounds in plant foods, and also the most studied ones (Bravo, 1998). Health-promoting effects of soybean have been attributed to its antioxidative effect, as well as to the estrogen-like activity of isoflavones, which has been reported to reduce the risk of breast cancer and osteoporosis (Messina and Messina, 2010). Recently, legumes are gaining interest because they are excellent sources of bioactive compounds and can be important sources of ingredients for uses in functional foods and other applications. The bioactive compound content of legumes is generally affected by genetic (genotype) and environmental (weather, soil type, geographical location) factors (Malenčić et al., 2012). Regarding soybean grain composition, it can be treated as a functional food because of its innumerable desirable characteristics and because there is strong evidence that additive and synergistic interactions of natural antioxidants significantly strengthen the protective effects against oxidative damage (Prakash et al., 2007). The objectives of this study were (1) to determine the content of total phenols and total flavonoids in soybean seeds of different genotypes originated from the eastern Croatia (Danube region); (2) to assess content variability of analyzed phenolic compounds affected by genetic and environmental factors; (3) to identify genotypes with high concentrations of those compounds. The present research was the initial phase in the breeding strategy toward improved antioxidant properties of Croatian soybean varieties.
Metode
Plant material
In order to find the antioxidant potential, we chose 33 advanced soybean breeding lines developed as part of the Agricultural Institute Osijek (Osijek, Republic of Croatia) breeding program. Tested genotypes (OS-lines) belong to maturity group 0 and are characterized by exceedingly high genetic potential for seed yield, satisfactory content of protein and oil in seeds, high tolerance to major diseases, and overall good stability and broad adaptability.
Field trials
Experimental field of the Agricultural Institute Osijek is located at 45˚54’ N and 18˚74’ E. Field trials were carried out in randomized complete block design with three replications over two years (2010-2011). The basic plot was 10 m2. Standard agro-technological practices were applied. The plots were harvested with a plot combine harvester in the full maturity stage (Wintersteiger Classic Plot Combine, Austria).
Weather conditions
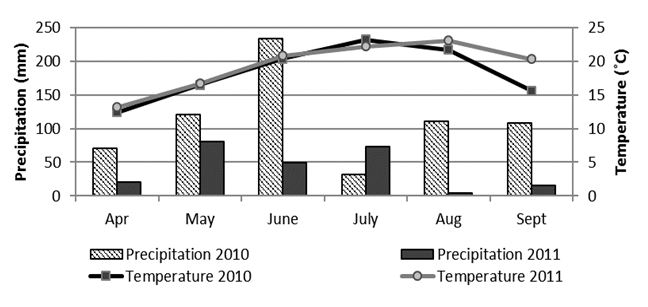
The distribution of the total monthly amount of precipitation and mean monthly air temperatures in the soybean vegetative season for years 2010 and 2011 at the location Osijek are presented inFig. 1. It is apparent from precipitation values that the conditions in the year 2010 were more humid during the growing season than in 2011, but mean air temperatures were similar for both years of the research.
Preparation of methanol extract of soybeans
Milled and homogenized soybean samples were used for ultrasonic-assisted extraction. Extraction of 0.5 g of grinded plant material was made with 5 ml of methanol (containing 1% HCl) for 1 h using an ultrasonic bath (Escarpa and Gonzales, 2000). Samples were centrifuged for 5 minutes at 4 °C and at 9000 rpm. Residue was re-extracted with 5 ml of solvent for 30 min, and then with 2 ml for 30 min. The extracts were then combined to a final volume of 12 ml. The solutions were filtered through membrane filters (0.45 µm pore size). The soybeans dry matter content was determined by drying the milled soybeans at 105 °C to constant weight.
Determination of total phenols
Analyses of phenolic compounds were made using seed samples from plots (three samples per genotype per year). Total phenolic content of each extract was measured as described inWaterhouse (2002). Briefly, 0.1 ml of extract was mixed with 0.1 ml of Folin-Ciocalteu reagent and 1.5 ml of distilled water. After 5 minutes 0.3 ml of 20% (w/v) Na2CO3 was added. The mixtures were vortexed and left at room temperature for 30 min in the dark. Absorbance was measured at 765 nm (Specord 200 Analytic Jena, Germany). Total phenols were calculated from a gallic acid standard curve and reported as mg gallic acid equivalents (GAE) /g of dried weight. The linearity range of the calibration curve was 0.05 to 0.50 mg/ml.
Determination of total flavonoids
Total flavonoid content was determined spectrophotometrically using AlCl3 reagents (Xu and Chang, 2007). One ml of extract was mixed with 4 ml of distilled water and 0.3 ml of 5% NaNO2 (w/v). The mixtures were vortexed, and left at room temperature for 5 minutes. After that, 0.3 ml of 10% AlCl3 (w/v) was added, vortexed and left for 6 minutes. Two ml of 1 M NaOH and 2.4 ml distilled water were added. Absorbance was immediately measured at 510 nm. Total flavonoids were calculated from a catechin hydrate standard curve and reported as mg catechin hydrate equivalents (CAE)/g of dried weight. The linearity range of the calibration curve was 0.01 to 0.08 mg/ml.
Statistical analysis
Analysis of variance (ANOVA) was conducted and used to determine the significant differences between group means using the probabilities of P ≤ 0.01 and 0.05. The cluster analysis is presented by a dendrogram constructed using the single linkage method and employed to group genotypes into classes according to their similarity in terms of their total phenolic and total flavonoid content values. Both analyses were conducted using Statistica 12.0 software (StatSoft Inc., USA, 2013).
Results and discussion
Antioxidant properties of investigated material largely depend on the chemical structure of phenolic compounds, which was previously reported byPrakash et al. (2007) andKumar et al. (2010) who found out that antioxidant activity (EC50) of tested soybean genotypes was in significant correlation (R2 = 0.839 and 0.660) with the total phenolic content (TPC). TPC ranged from 2.330 to 3.227 in 2010 and from 2.121 to 3.164 mg GAE/g of dry weight in 2011 (Table 1). Similar values for TPC were observed by Xu and Chang (2008a,2008b), who reported a range of 2.07-2.90 mg GAE/g in 28 soybean samples prepared by 50% acetone extraction. According toMujić et al. (2011), in several Croatian soybean cultivars phenols were extracted using 80% methanol and total phenolic content ranged from 0.87 to 2.16 mg GAE/g. Higher values for phenols were found in black and brown colored soybeans (Kumar et al., 2010). Their content was 2.5-fold higher when compared to yellow samples (Malenčić et al., 2012). With regard to the specified values, genotype OS-L-100 had the highest value of TPC in both tested years, followed by OS-L-12 and OS-L-17. Genotypes OS-L-101 and OS-L-58 had the lowest values average of the two years (Table 1). Research ofChung et al. (2008) suggested that genotype effects had a significant impact on the total phenolic content of soybeans, and that the differences in TPC values may be partly due to genotypic variability of soybeans.Klepacka et al. (2011) also reported that content of phenolic compounds might be useful as a distinguishing factor for genotype identification. Total flavonoid content (TFC) of investigated genotypes in 2010 varied from 0.433 to 0.659, and in 2011 from 0.428 to 0.580 mg/g of dry weight, expressed as catechin equivalents. The total flavonoid content was similar to a previous report byLee et al. (2011), who reported that TFC was 0.41 mg CAE/g in yellow soybeans. Genotypes OS-L-113, OS-L-17, and OS-L-151 had the highest average total flavonoid content, while genotypes OS-L-27 and OS-L-67 had the lowest average values for both tested years (Table 1). Average values of the two years for both phenols and flavonoids showed variability (LSD0.05) among tested genotypes (Table 1).Dajanta et al. (2013) discovered that cooking (3.74-8.54 mg GAE/g; 1.46-2.06 mg CAE/g) and fermentation (27.05-35.88 mg GAE/g; 1.38-3.50 CAE/g) significantly increased total phenolic and total flavonoid content in yellow and black soybean seeds which additionally supports the idea of using soybean as a highly functional foodstuff.
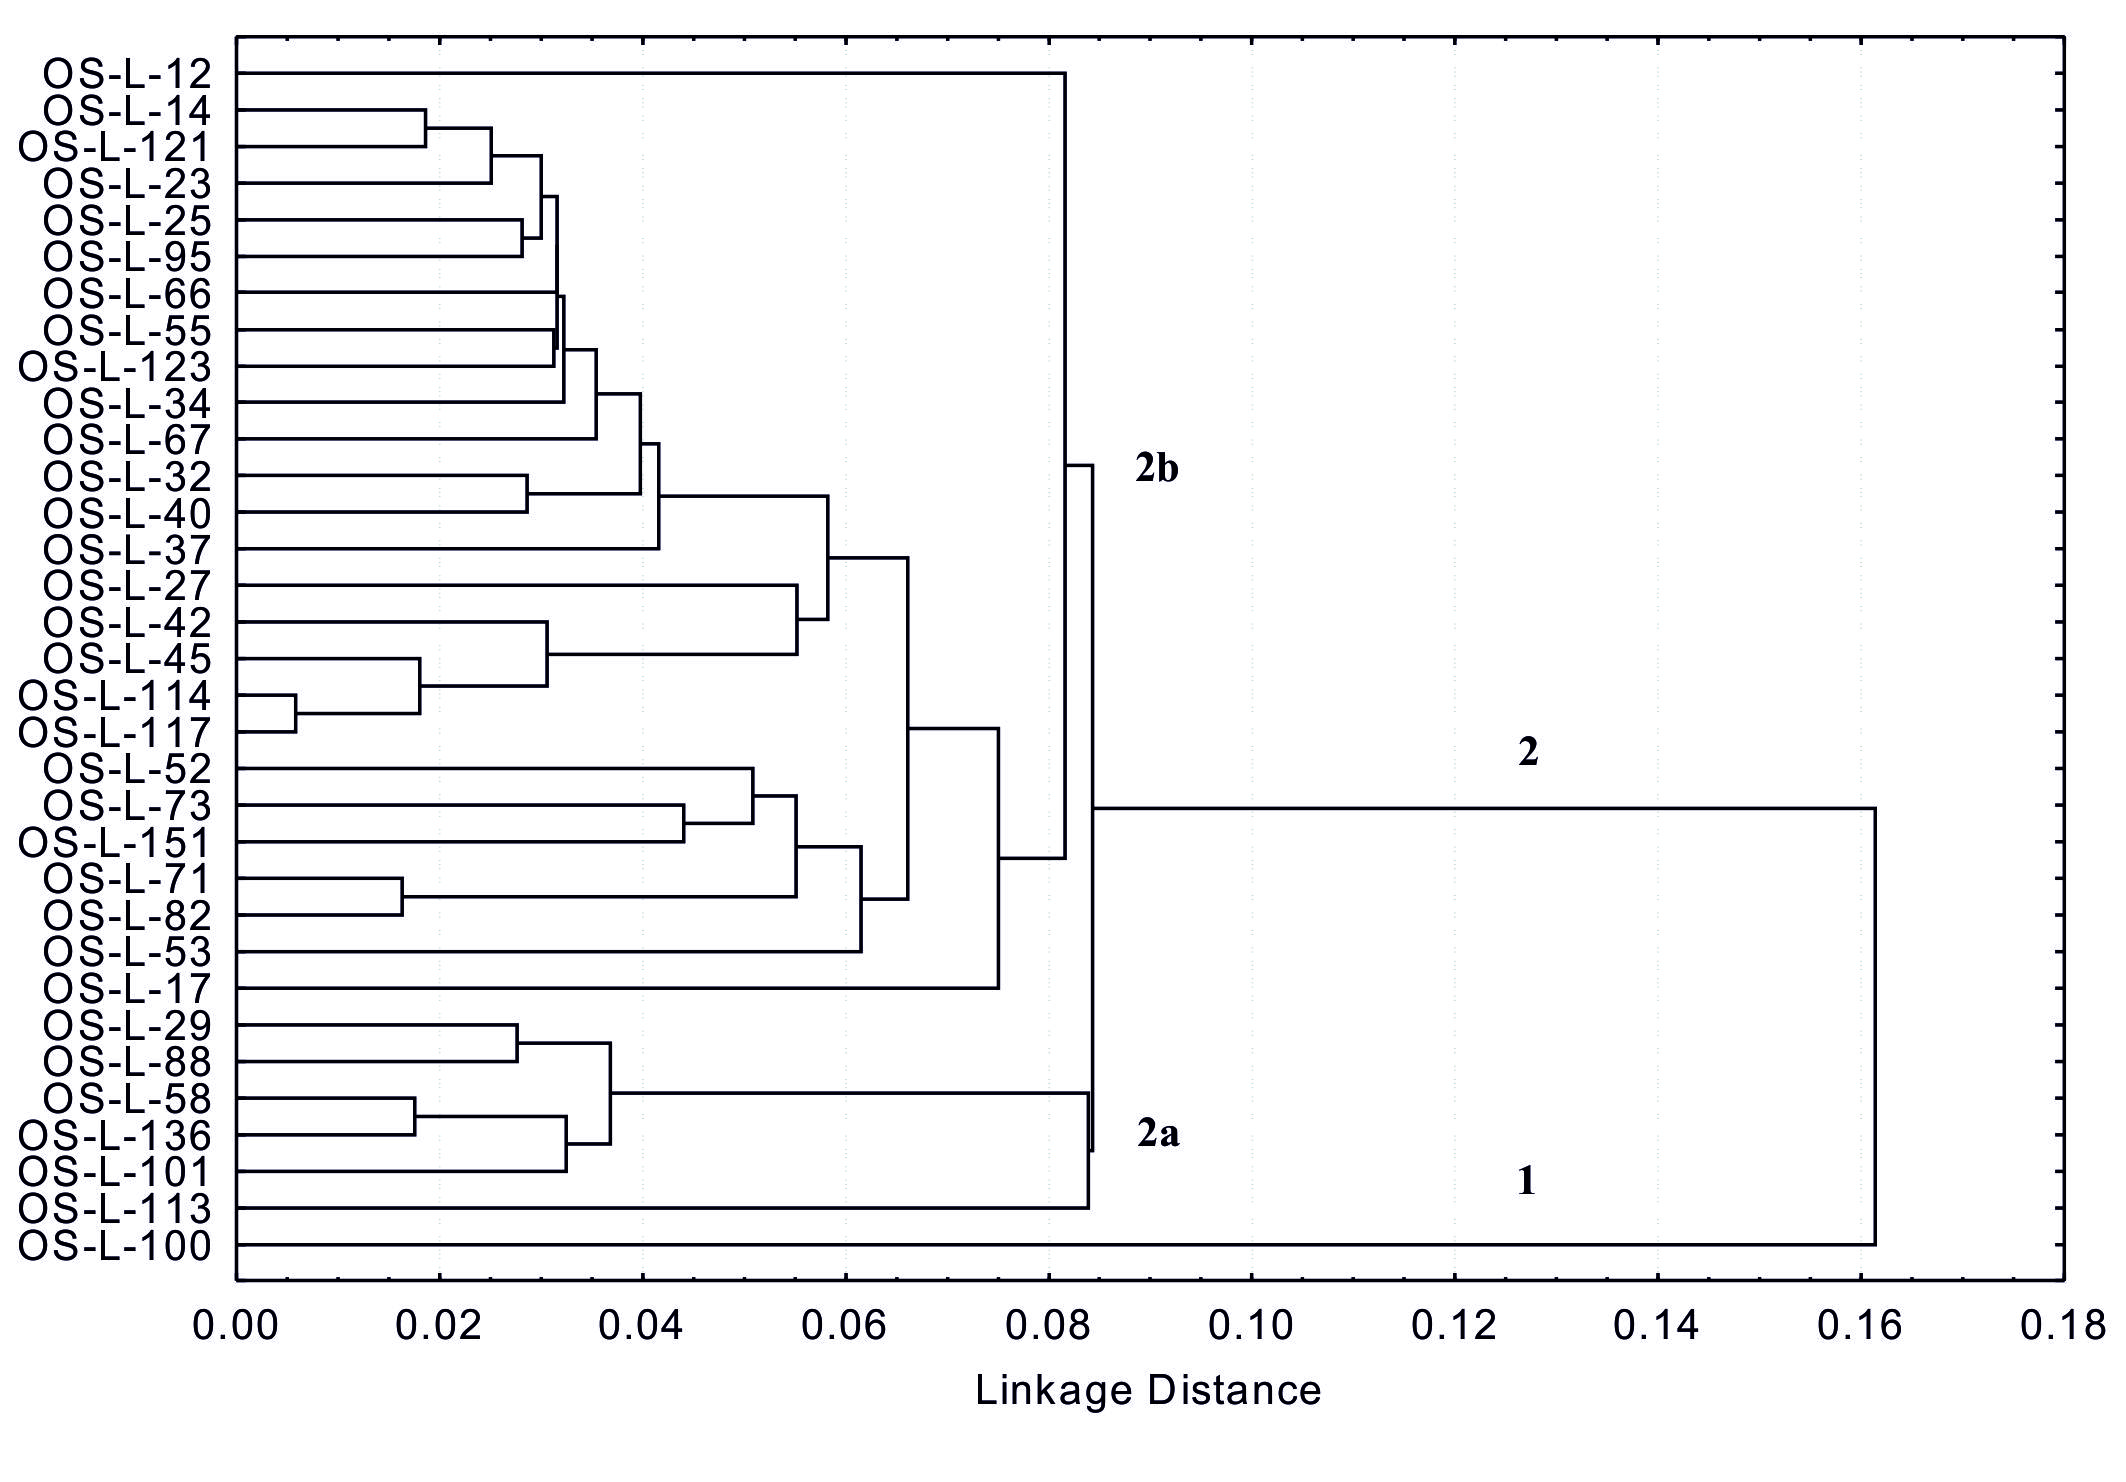
These results also indicate that phenolic and flavonoid content could be a useful additional tool for controlling the quality of soybean grain in selection for breeding programs. Analysis of variance (Table 2) showed a highly significant difference between all tested genotypes for both investigated traits. Differences in interactions of genotype x year and year for total flavonoid content were also significant at levels P ≤ 0.01 and 0.05. Considering the different weather conditions throughout the years of research (Fig. 1), it is evident that the year as a source of variability in tested genotypes did not influence the total phenolic content, while significant influence (P ≤ 0.05) was observed for the total flavonoid content (Table 2).Mujić et al. (2011) also reported significant differences between soybean genotypes for TPC and isoflavone content. Results of several authors show that genetic variability of soybean and environmental conditions both affect the content of seed phenols, (Lee et al., 2011;Tepavčević et al., 2010;Malenčić et al., 2008). According to the cluster analysis by the single linkage method, all genotypes were divided into two main groups (1 and 2), with the linkage distance of > 0.16 (Fig. 2). Group 1 included only one genotype (OS-L-100), while group 2 consisted of the remaining 32 genotypes, which were divided into two major subgroups (2a and 2b). Genotype OS-L-113 was singled out in subgroup 2a as a specific group. Subgroup 2b was also divided in several smaller groups where genotypes OS-L-12 and OS-L-17 stood out as specific groups (Fig. 2). This analysis also showed high variability among genotypes for both tested traits (phenols and flavonoids) and confirms that, if the natural resources of high diversity are available, classical breeding can be a powerful tool for the enrichment of food with beneficial secondary metabolites (Treutter, 2010).
| Source of variation | Degrees of freedom | F value | |
| Total phenols | Total flavonoids | ||
| Year (Y) | 1 | 0.32ns | 14.02* |
| Interaction G x Y | 32 | 7.65** | 8.69** |
Significance level is marked at P ≤ 0.05 (*), 0.01 (**) and ns – not significant.
Conclusions
OS soybean lines in the study exhibited high variability in both tested traits of total phenolic and total flavonoid content. The different amount of precipitation in the two years of research did not influence the content of total phenols, unlike the content of total flavonoids, which was under significant influence of weather conditions. Genotypes OS-L-100, OS-L-12, and OS-L-17 were singled out for the highest content of total phenols, while genotypes OS-L-113, OS-L-17, and OS-L-151 had the highest average total flavonoid content for both years. Results of analyses presented in this paper contribute to the development of the genetic background for improving antioxidant properties of Croatian soybean varieties.