
Introduction
Coffee beans have a complex matrix of many substances which can interact within the human body, e.g. improving its antioxidant activity and stimulating the neural system. Several researches indicate the health benefits of coffee consumption, ranging from enhancing mental performance to fighting cardiovascular disorders, diabetes, and cancer, which contribute to the rising global coffee demand (Lim et al., 2012;Qi and Li, 2014;De Oliveira, 2015). During past few years, coffee drinking was also shown to be helpful in decreasing a risk of social disease, such as diabetes type II, Parkinson and Alzheimer diseases (Chu, 2012). Recently, because of a pro-health and pro-healing status of antioxidant rich products, another coffee beverage has begun to enjoy a great popularity - infusion, prepared using raw, unroasted green coffee beans. Green coffee is believed to accelerate metabolism and therefore it can be helpful in reducing weight, and preventing or overcoming obesity (Stelmach et al., 2015). Physiological studies made on mice suggest that a green coffee extract could be an effective fat absorption inhibitor and a suppressor of its metabolism in liver (Shimoda, et al., 2006). It has been recognized that benefits from consuming green coffee infusions are mainly related to the presence of phenolic compounds, especially chlorogenic acids, which exhibit a certain antioxidant activity (Suzuki et al., 2002). Green coffee beans (GCB) have a mild, green, bean-like aroma; the characteristic aroma of coffee develops during the roasting process. The main constituents of GCB are carbohydrates, both soluble (galactomannan, arabinogallactan), and insoluble in water (cellulose), phenolic species, in addition to polysaccharides, proteins, polyphenols, melanoids, lipids, and minerals (Stelmach et al., 2015). Green coffee beans are rich in phenolic acids, especially in chlorogenic acid, and its related compounds that show hypotensive effects (Shimoda et al., 2006). Chlorogenic and caffeic acids, the main phenolics of green coffee, exhibit antimutagenic, anticarcinogenic and antioxidant activities in vitro, which are linked with the ability to scavenge reactive oxygen species. Additionally, these compounds have been suggested as inhibitors of inflammation and tumor promotion via deactivation of a range of pro-oxidative enzymes such as lipoxygenase - a key enzyme of the arachidonic acid metabolism (Gawlik-Dziki et al., 2013). During roasting, there is a progressive destruction and transformation of chlorogenic acids with some 8-10%, being lost for every 1% loss of dry matter (Clifford, 1999). Thus, GCB seem to be a better source of these compounds.
A few studies have been conducted regarding food supplementation by GCB addition. Our recent study showed that powdered GCB may be used directly, without extract preparation, for wheat bread supplementation obtained from patent flour (Dziki et al., 2015). The aim of the present study was to examine the influence of GCB on the quality of wheat bread obtained from the wholemeal flour.
Materials and methods
Materials
Wholemeal flour (type 2000) contained the following: protein 13.7%, ash 1.98%, falling number 343 s, water absorption up to 500 BU (Brabender Units) 60.3%. The wheat flour was obtained from the local milling industry, the dried instant yeast was obtained from Instaferm® (Lallemand Iberia, SA, Setúbal, Portugal), salt was purchased from the local market. Tap water was used in this study. Green coffee (Coffea arabica) beans (GCB) derived from Kenya were obtained from company Cofeina-Romuald Zalewski, Marki, Poland. Their chemical composition was described in our previous paper (Dziki et al., 2015).
Bread preparation
A straight-dough method was used in an experimental baking test (Różyło, 2014). The wholemeal wheat flour was replaced with GCB flour (particles of ground GCB from Brazil < 0.2 mm) at 1 g/100 g, 2 g/100 g, 3 g/100 g, 4 g/100 g, 5 g/100 g levels (GC1, GC2, GC3, GC4 and GC5, respectively). Furthermore, the following ingredients were used: instant dry yeast (1 g/100 g), salt (2 g/100 g), and water (the amount necessary to obtain dough consistency 350 FU). In the straight dough baking method, the loaves of bread were prepared after the dough had been mixed (8 min) in a slow-speed mixer type GM-2, fermenting and proofing of the dough was performed in a fermentation chamber (ICH 256, Memmetr, Germany, Dusseldorf). The dough was fermented at 30 °C and 75-80% relative humidity (RH) for 60 min (with 1-min transfixion after 30 min of resting). After the end of fermentation, a piece of dough was weighed, divided into loaves of equal mass (300 g) and formed. It wasthen subjected to proofing performed at 30 °C and 75% RH for the right amount of time required for the optimal dough development. The rule which was applied was the following: if, after a light depression of the dough, the surface of the dough returned to its original position, it would mean that the dough was insufficiently developed, while a slight indentation which remained on its surface, meant the optimal dough development. The loaves were baked at 230 °C for 25 min in a laboratory oven (Sadkiewicz Instruments, Poland, Bydgoszcz). Live steam was injected for 1.0 min immediately after the loaves had been placed in the oven. Baking tests were performed in three replicates. After baking, the bread was cooled for 3 h at a room temperature (21 °C) and then wrapped in polyethylene bags.
Bread evaluation
The physical properties of the bread were determined one and three days after baking. The samples were evaluated for bread loaf volume from 100 g of flour (Różyło, 2014). The moisture of crumb was determined by a AACC Method 44-15.02. These assays were performed in triplicate. The pH of the bread crumb was measured using a pH meter (TESTO 206-ph2, Pruszków, Poland) with a penetration probe for semi-solid substances (including baked products).
The color of bread crumb samples was measured (after one day) using a CR-200 Chromameter (Minolta). The analyses were based on the L*a*b* system for breads that were defined by the CIE (International Commission on Illumination), where L* presents the luminance or lightness component, which ranges from 0 to 100; parameters a* (from green to red) and b* (from blue to yellow), are the two chromatic components. These measurements were made in the area derived from the central part of the crumb.
The textural properties of bread crumb (TPA test) were evaluated with the help of the ZWICK Z020/TN2S strength tester. In this study the bread crumb samples (30 mm × 30 mm × 20 mm) were compressed using a capital equipped with a 30 mm plug until a 50% depth at the crosshead speed of 1 mm/s. The samples were compressed twice to give a two-bite, from which textural parameters were obtained: hardness, springiness, cohesiveness and chewiness (Gámbaro et al., 2006). Crumb texture measurements were made in six replicates, on samples cut from the middle part of the loaves.
Extraction procedures
Powdered samples of breads (1 g) were extracted for 1 h with 20 mL of PBS buffer (phosphate buffered saline, pH 7.4). The buffer extracts (BE) were separated by decantation and the residues were extracted again with 20 mL of PBS buffer. Extracts were combined and stored in dark at -20 °C.
In vitro digestion and absorption were performed according toGawlik-Dziki (2012). The samples (1g) were homogenized in a stomacher laboratory blender for 1 min to simulate mastication with the presence of 15 mL of simulated salivary fluid (prepared by dissolving 2.38g Na2HPO4, 0.19g KH2PO4, and 8g NaCl, 100 mg of mucin in 1 liter of distilled water). The solution was adjusted to pH = 6.75 and α-amylase (E.C. 3.2.1.1.) was added to obtain 200 U per mL of enzyme activity). The samples were adjusted to pH = 1.2 using 5mol/L HCl, and subsequently, 15 mL of simulated gastric fluid (300 U/mL of pepsin in 0.03 mol/L NaCl, pH= 1.2) was added. The samples were shaken for 120 min at 37 °C. After that the samples were adjusted to pH = 6 with 0.1mol/L of NaHCO3, and then 15 mL of simulated intestinal juice (prepared by dissolving 0.05g of pancreatin (activity equivalent 4 x USP) and 0.3 g of bile extract in 35 mL 0.1mol/L NaHCO3) was added. The extracts were adjusted to pH = 7 with 1mol/L NaOH, and finally 5 mL of 120 mmol/L NaCl and 5 ml of mmol/L KCl were added. The prepared samples were submitted to in vitro digestion for 60 minutes, at 37 °C in the darkness. After that samples were centrifuged, and supernatants (extracts after simulated digestion, DE) were used for further analysis.
Total phenolics estimation
Total phenols were estimated according to the Folin-Ciocalteau method (Singleton and Rossi, 1965). A 0.5 mL sample of the extract was mixed with 0.5 mL of H2O, 2mL of Folin reagent (1:5 H2O), and after 3 min with 10 mL of 10% Na2CO3. After 30 min, the absorbance of mixed samples was measured at a wavelength of 725 nm. The amount of total phenolics was expressed as chlorogenic acid equivalent (CHA) per gram of dry mass (DM).
Determination of DPPH Radicals Scavenging Activity (DPPH)
Forty μL of methanolic extracts was mixed with 1.80 mL of 6 μM solution of DPPH• in methanol. Absorbance at 715 nm was measured immediately, and after 10 min of incubation. The affinity of test material to quench DPPH free radical was evaluated according to the equation:
where
AC(0) represents absorbance of control at 0 min; AA(t), absorbance of sample after 10 min.
Antiradical activity was expressed as EC50 - extract concentration (mg DW/mL) provided 50% of activity based on a dose-dependent mode of action.
Statistical analysis
Statistical analysis was done at a significance level of α = 0.05 using the software Statistica 6.0, PL (Statsoft, Cracow, Poland). Measurement scores were subjected to the analysis of variance (ANOVA). When significant differences in ANOVA were detected, the means were compared using the Tukey range test.
Results and discussion
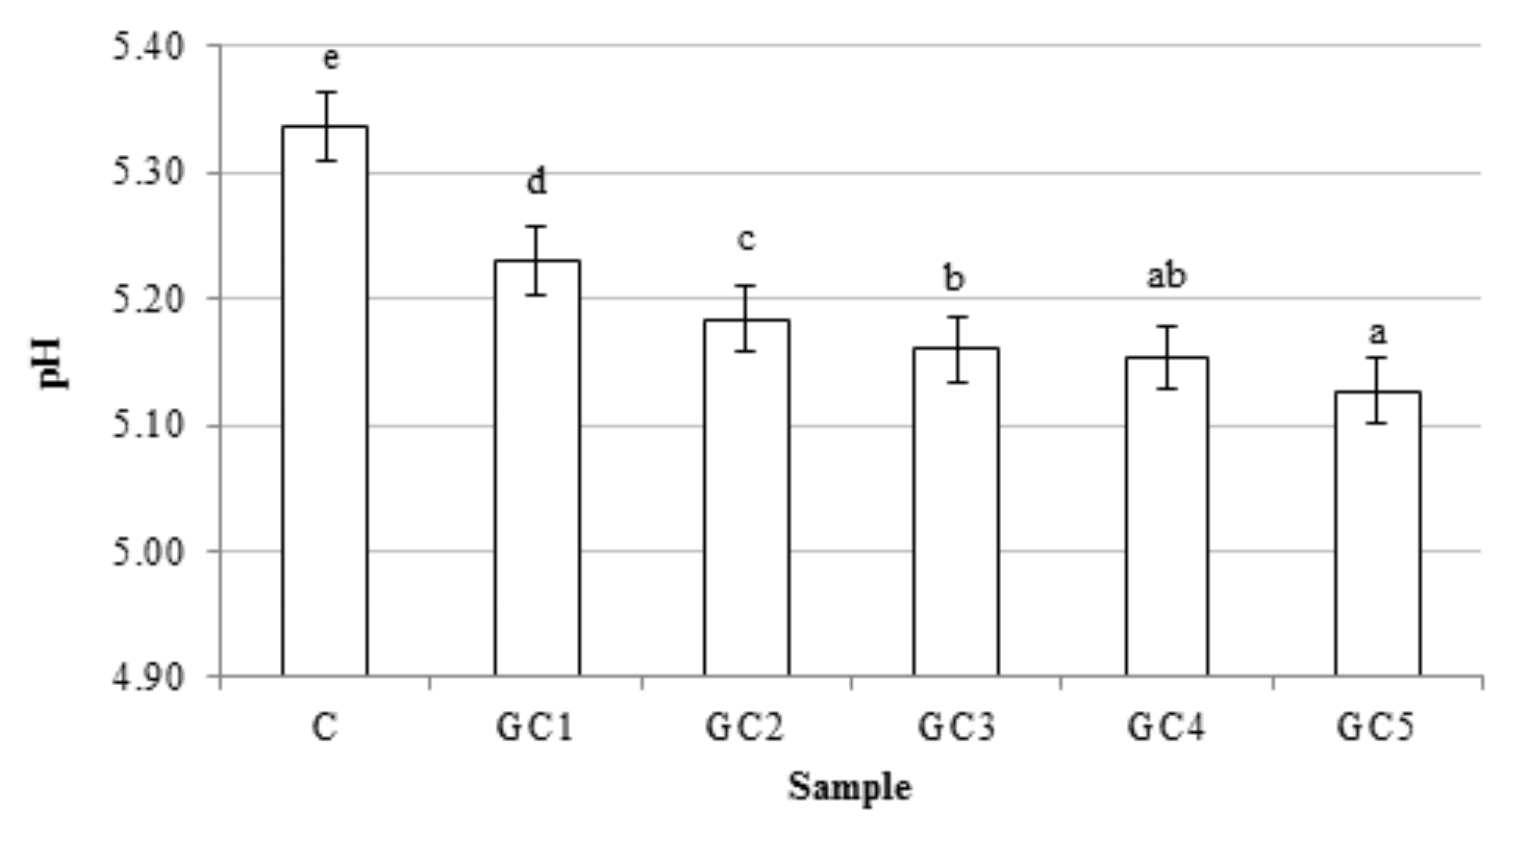
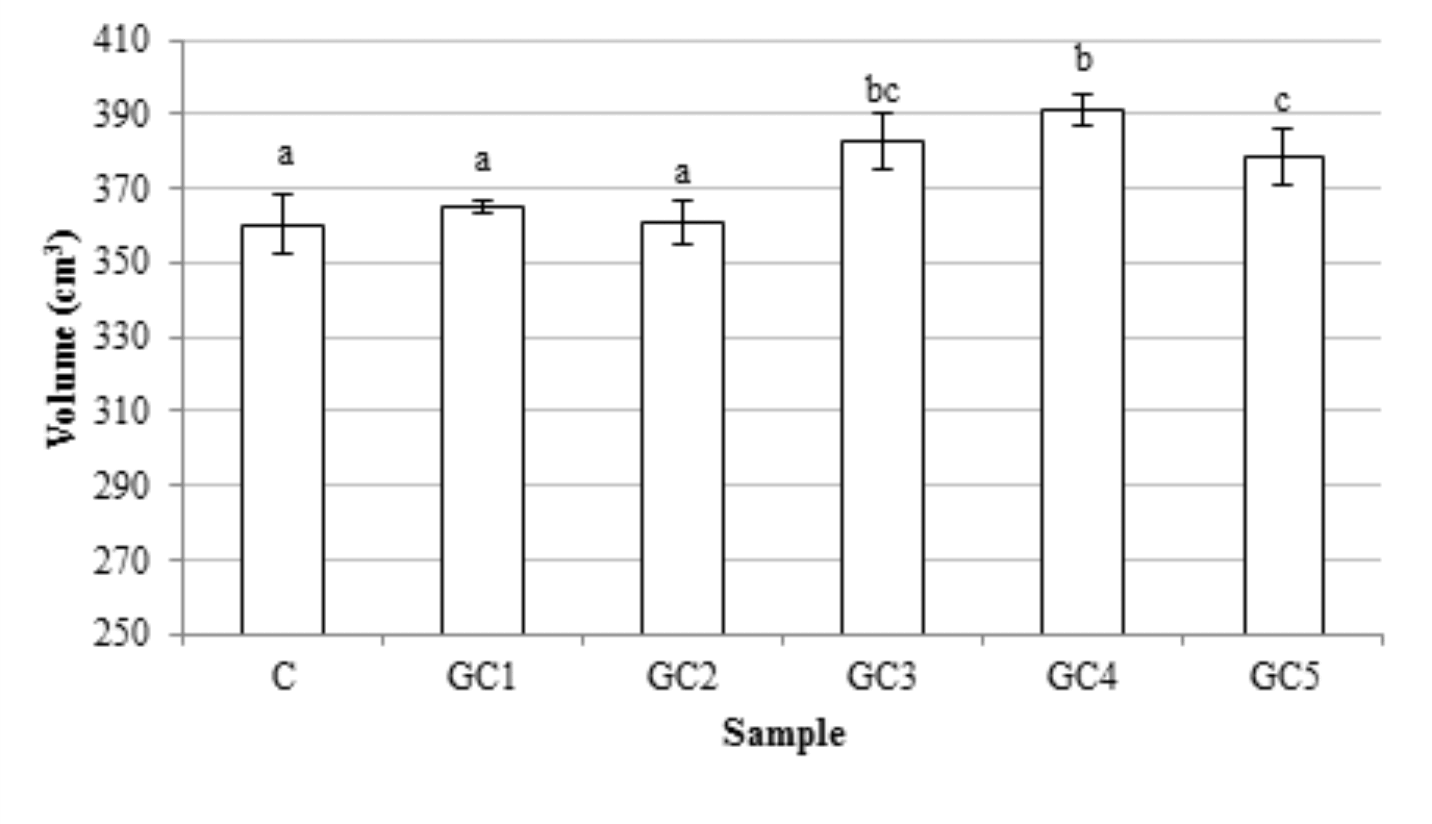
The pH of dough and bread slightly, but significantly changed as a results of the GCB addition (Fig. 1). Those parameters decreased with the increase in the content of GCB. The highest decrease was observed when 1% share of GCB was used. The replacement wholemeal wheat flour up to 2% of GCB had no significant influence on the bread volume. Interestingly, a higher level of GCB in recipe caused a slight increase in the bread volume. The highest value of this parameter was obtained for GC4 bread (Fig. 2). Generally, volume of bread depends on many factors, such as yeast, fermentable sugars, pH, and gas retention, which is affected by the fiber content (Nour et al., 2015). The non-endosperm components (germ, bran) exert a dilution effect on the gluten-forming proteins, restrict the water available for gluten hydration and development, or even physically disrupt the starch-gluten matrix. Therefore, the addition of non-endosperm components usually reduces the bread volume (Abebe et al. 2015;Li et al, 2015). However, during processing of wholemeal flour, the addition of different plant components increases the gas retention capacity during dough fermentation and the increase of bread volume is observed (Boz and Karaoglu, 2013).
The textural properties characterizing the quality of bread crumb are presented atTable 1. Generally, the addition of GCB into wheat flour had a little influence on the crumb texture. The lowest values of crumb hardness after one day of bread storage were obtained for bread with GC3 and GC4. Slightly, but significantly, higher values of these parameters were found for control bread and GC1 and GC2 samples. The longer time of bread storage caused an increase of crumb hardness, the highest in the case of GC3 bread (about 79%). Elasticity of bread changed in the narrow range from 7.2 mm for GC1 to 8.5 mm for GC3 crumb sample. Breads stored for 72 hours were usually characterized by lower values of this parameter. The addition of GCB had no significant influence on the crumb cohesiveness and little influence on the bread chewiness. The longer time of bread storage caused a decrease of cohesiveness and an increase of bread crumb chewiness.
The color parameters of bread crumb are presented inTable 2. The addition of GCB into wheat flour caused a slight decrease in lightness and yellowness of bread crumb from 46.0 to 43.7 and from 14.5 to 13.2, respectively, whereas the redness of bread was almost unchanged.
*C, GC1, GC2, GC3, GC4, GC5 - control bread and bread with 1%, 2%, 3%, 4% and 5% of ground coffee bean, respectively;
**Means with different letter superscript are significantly different (α <0.05)
*C, GC1, GC2, GC3, GC4, GC5 - control bread and bread with 1%, 2%, 3%, 4% and 5% of ground coffee bean, respectively;
**Means with different letter superscript are significantly different (α < 0.05)
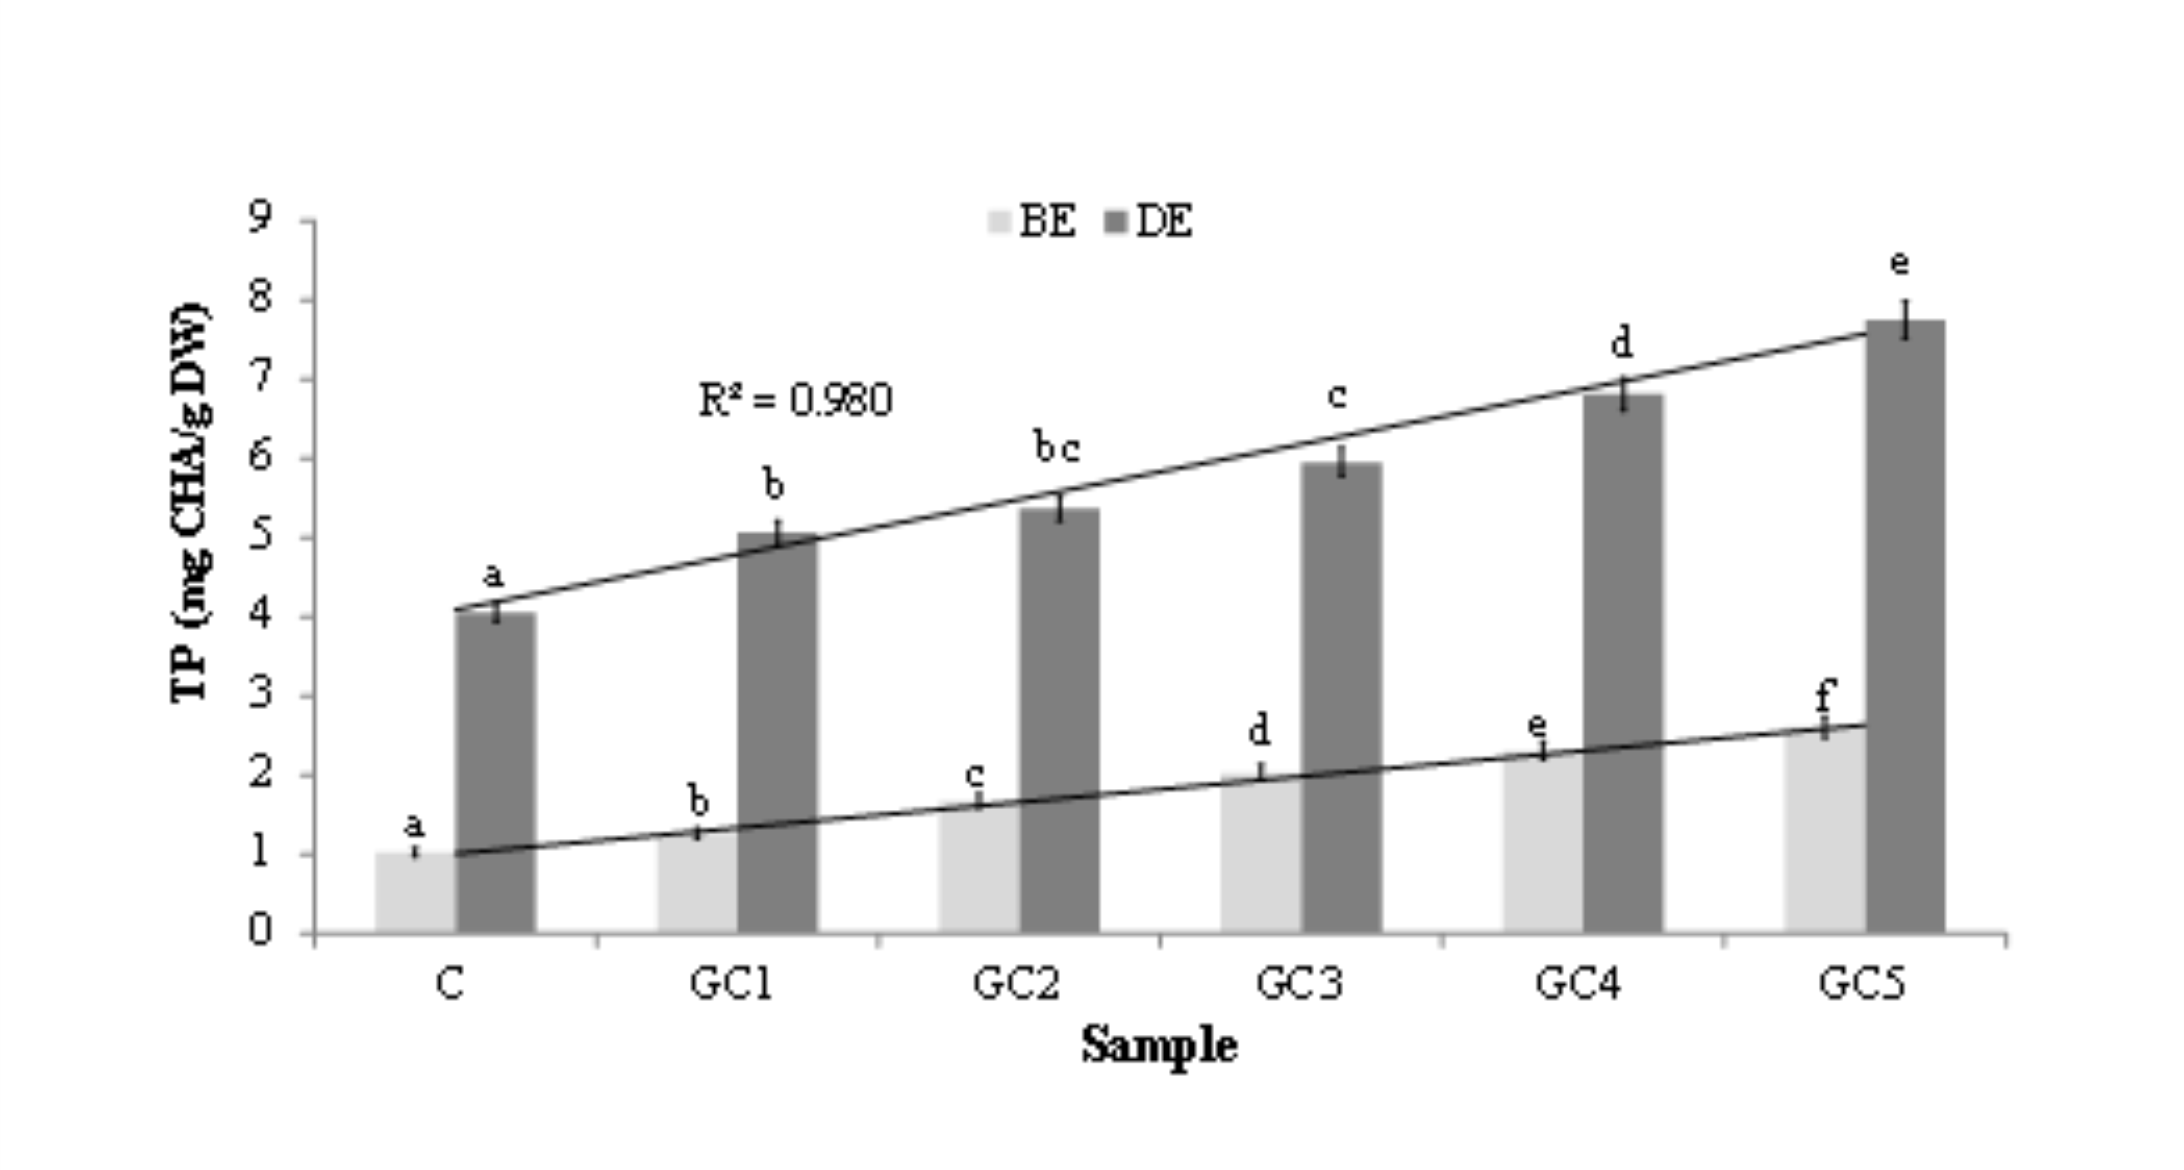
As presented inFig. 3, GCB addition significantly enriched wheat bread with hydrophilic phenolic compounds. Their content was significantly positively correlated with the corresponding percentage of the additive. Importantly, phenolic compounds were highly bioaccessible in vitro, which is confirmed by the results found for the extracts after digestion in vitro. Strong positive correlation was obtained in this case too (Fig. 3). Green coffee beans are rich in phenolic acids, especially in chlorogenic acid (CGA), and its related compounds that show hypotensive effect (Shimoda et al., 2006). Chlorogenic acids (CGAs) content was 3.5-7.5% (w/w dry matter) for Coffea arabica, and 7.0-14.0% (w/w dry matter) for Coffea canephora. The CGAs in green coffee beans consist of three main classes: caffeoylquinic acids (CQAs) with three isomers (3-, 4-, and 5-CQA), dicaffeoylquinic acids (diCQAs) with three isomers (3,4-, 3,5-, and 4,5-diCQA), and feruloylquinic acids (FQAs) with three isomers (3-, 4-, and 5-FQA). These nine kinds of CGAs account for 80% of the content of total CGAs in green coffee beans (Narita and Inouye, 2011).
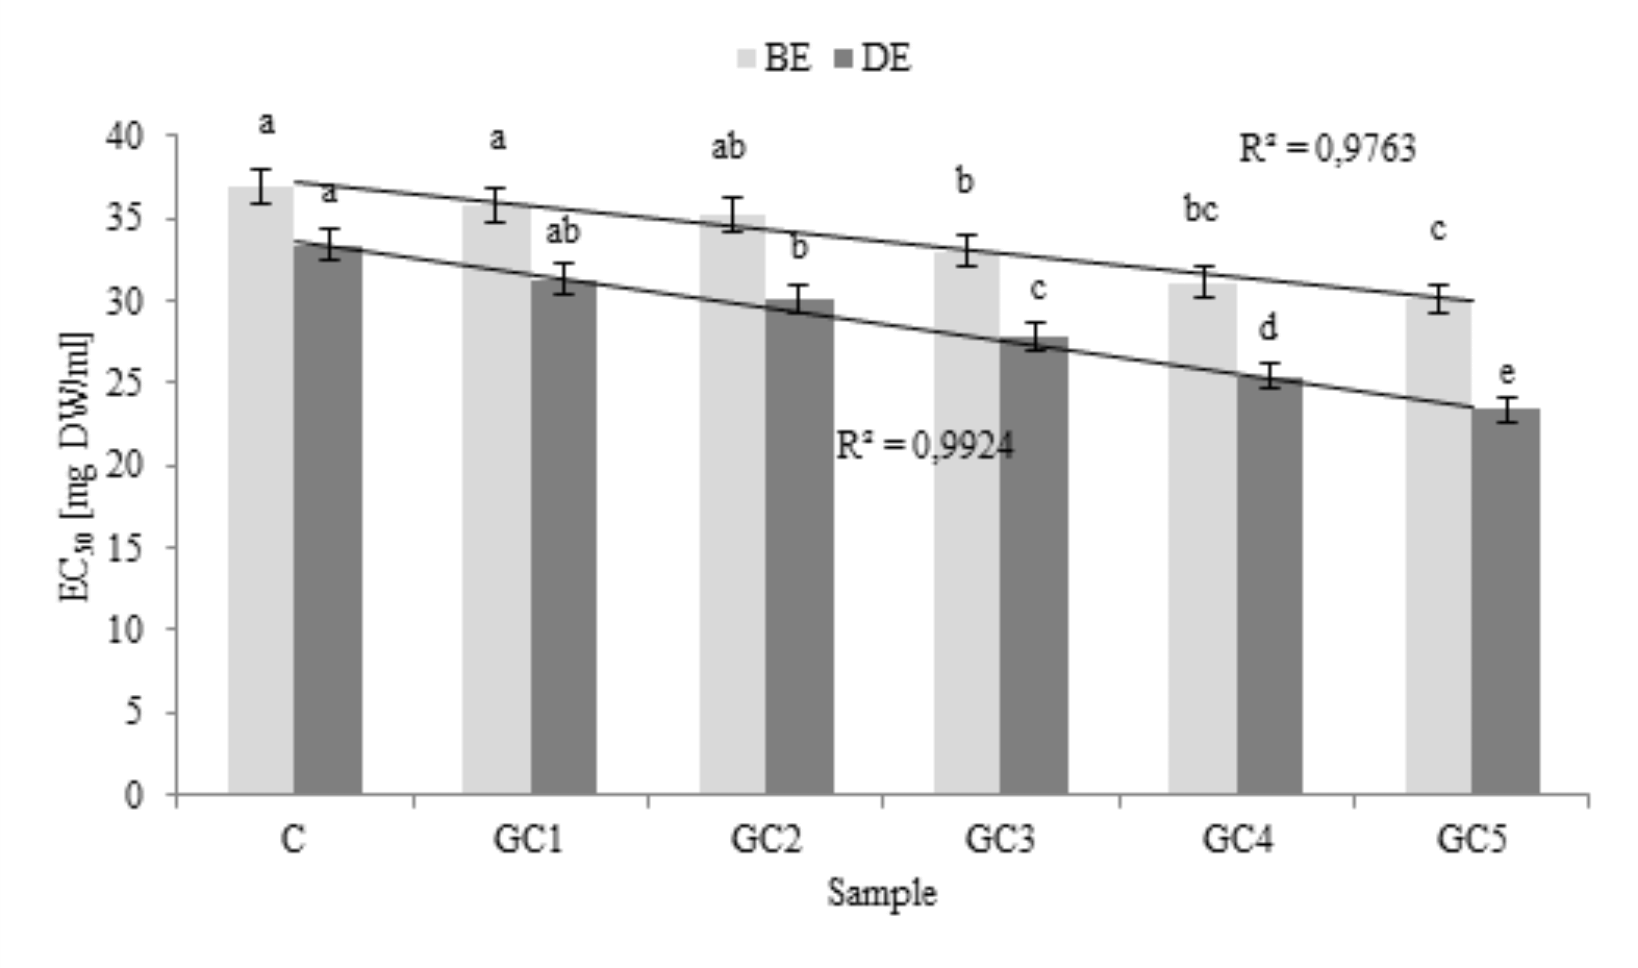
GCB addition significantly influenced the antiradical activity of bread extracts. As presented inFig. 4, functional additive significantly enriched wheat bread with buffer-extractable antiradical compounds. Most importantly, these compounds were bioaccessible in vitro, as evidenced by the results found for potentially bioaccessible compounds (extracts after digestion in vitro). In both cases antiradical activity was strongly correlated with the corresponding percentage of the additive. Our previous study (Gawlik-Dziki et al., 2014;Dziki et al., 2015) clearly showed that GCB are a valuable source of biologically active compounds. These results were also confirmed byBudryn and Nebesny (2013) andBudryn et al. (2013). In turn,Glei et al. (2006) proved that the supplementation of bread with a 1% commercial green coffee extract resulted in enhanced chemopreventive in vitro properties when compared to normal bread. Enriched bread contains more chlorogenic acid and has higher antioxidant activity than normal bread. These properties were associated with an increased resistance of colon and liver cells against H2O2-mediated genotoxicity, which is an important mechanism of chemoprotection. Another source of phenolic acids were cereals. Whole grains contain significant amounts of the strong antioxidant class of o-phenolics that have the ability to scavenge free radicals and chelate metals. Whole wheat and wheat bran contain significant quantities of the phenolics, especially diferulic acid. It has also been suggested that the benefits of these phenolic acids are in their antioxidative properties (Garcia-Conesa et al., 1997).
Conclusions
The results showed that GCB addition has a positive influence on the wholemeal bread volume. The pH of bread slightly decreased as a result of the GCB addition. Generally, the addition of flour from green coffee into wheat flour up to 5% had a little influence on the crumb color and texture. The lowest values of crumb hardness after one day of bread storage were obtained for bread with GC3 and GC4. Besides, addition of GCB significantly enriched wheat bread with hydrophilic phenolic compounds. Their content was significantly and positively correlated with the corresponding percentage of the additive. Phenolic compounds were highly bioaccessible in vitro. Moreover, the GCB addition significantly influenced the antiradical activity of bread extracts.