1. INTRODUCTION
Efficiency and sports are two closely related concepts. Most of the research analyzing efficiency in sports investigates the effectiveness of one or a few sport segments such as player techniques or attack and defense performance, but rarely does it analyze the dependence of sports results on the revenues and costs of respective teams. A few decades ago, efficiency in sports was measured using simple methods. For example, in volleyball, they measured how many points athletes achieved with the same amount of tries and then they calculated the arithmetic mean for each athlete. Besides arithmetic means, they also calculated efficiency by observing the average relationship between two or more variables interrelated in some manner. For example,González-Silva et al. (2016), used multinomial logistic regression to calculate the efficiency of young male and female volleyball players. The main objective of that study was to analyze the variables that predicted setting efficiency in these categories. The study observed almost 6,000 game actions performed by teams that participated in the Under-16 Spanish Championship.
Volleyball is one of the most widely spread played sports in the world (Olympic Programme Commission Report, 2005). This is not that strange considering that almost every second little girl in the world has tried to play volleyball. Some of these girls continued playing professionally and some as a form of recreation. This may probably be the reason why volleyball has been called a “female” sport. The percentage of female athletes in volleyball also lies in the possibility of higher dispersion of male athletes into other team sports. Volleyball is a famous sport in Croatia. There are many teams trying to survive with the limited financial help offered by the Croatian government, especially in Primorsko - Goranska County (PGC). In PGC there are sixteen registered younger cadet teams. The actual number of teams is not known, as they probably do not have enough money to pay the registration fee in order to become a part of an official league. Namely, Croatian volleyball teams especially those involving children are mostly financed through membership fees, minor sponsors and donations.
In 2017, the Opatija Initiative, an initiative for sustainable financing of sports has been initiated. This initiative targets only the five top sports in PGC: football, basketball, volleyball, water-polo and handball. It has been recognized as a very creative concept, even revolutionary, with regard to financing sports and its role in the overall development of Croatian society. The initiative envisages new models of financing team sports from the sale of TV rights, sojourn taxes, betting agencies, municipal taxes and the introduction of tax breaks for sports. The trigger for this initiative lies in the fact that a large number of teams are on the edge of existence. Many are being shut down, and in the long run, the children will simply lose the opportunity to get involved in sports activities at low cost. Today there are more than 200,000 registered athletes in Croatia, and even more important, 100,000 of them are under the age of 18. The Croatian government, on an annual basis, is obliged to allocate fairly the budget means aimed for the financial support of volleyball teams. As this research aims to investigate whether the amount of funds at a team’s disposal, generated through various means i.e. membership fees, sponsors, the government etc. is related to the team’s sporting success, the research findings may serve as a guideline in the allocation of financial support in volleyball. The success of the teams was measured by their results within the season 2017/2018.
In the past, the DEA approach was used for measuring efficiency in other contexts such as financial services (Fiordelisi, Molyneux, 2004), banking (Hauner, 2005), industry (Price, Weyman-Jones, 1996), hospitals (Dervaux et al., 2004) and electricity (Bagdadioglu et al, 1996). In the past 10 to 15 years, it has also been recognized as a common methodology for measuring efficiency in sports, such as football, handball, volleyball, etc. In 2018, Ali Emrouznejad and Guo Liang Yang published an invited paper A survey and analysis of the first 40 years of scholarly literature in DEA: 1978–2016 in which they provided for a list of all publications related to theory and application of DEA from 1978 to 2016. In their study they followed the expansion of DEA use in 3 stages and found that about 1000 papers per year were published in the last period. The five fields with the greatest number of studies using DEA include Agriculture, Banking, Supply Chain, Transportation and Public policy. In a total of 10,300 listed papers, sports papers and relating journals account only for 30 entries.
One of the DEA founders,William W. Cooper, and his coauthors Ramón, Ruiz, and Sirvent (2011) applied DEA to rank basketball players using cross-efficiency evaluation. They applied the output-oriented CCR model with a constant input and the following outputs: adjusted field goal (AFG), adjusted free throw (AFT), rebounds (REB), assists (AST), steals (STE), inverse of turnovers (ITURN), non-made fouls own (NFO) and fouls opposite (FOPP).Ramón, Ruiz, and Sirvent (2012) ranked tennis players through a common set of weights obtained as summaries of DEA profile weights. They used the CCR output-oriented model with the following outputs: percentage of 1st serve, percentage of 1st serve points won, percentage of 2nd serve points won, percentage of service games won, percentage of break points saved, percentage of points won returning 1st serve, percentage of points won returning 2nd serve, percentage of break points converted and percentage of return games won. As no input was considered, they introduced a nominal input with value equal 1 for all players.Alcaraz, Ramón and Ruiz (2013) also did a cross-efficiency evaluation which was carried out without the need to make any choice of DEA weights.
Lozano et al. (2002), performed a relative efficiency assessment of nations participating in the previous five Summer Olympic Games using DEA models to investigate the relation between GNP and a country’s population and the number of gold, silver and bronze medals won. Three output variables were considered: the total number of gold, the total number of silver and the total number of bronze medals won in the Olympics. As for the input variables, they opted to include just two: Gross National Product (GNP) and population. They assumed that the economic power and the demographic power capture the most important factors affecting the expected performance of a nation. They used one linear programming (LP) for each DMU.
De Carlos, Alén and Pérez-González (2017) did a research using the latter study in order to analyze the relative efficiency of the Spanish Olympic Sports Federations in the Olympic cycle 2010-2012 by employing a relational DEA model. In their analysis the data was grouped under 17 variables (4 inputs, 10 intermediate inputs and 3 outputs) which allowed them to simultaneously calculate the efficiency of the system and its different stages and show the impact of public and private financing on sport results.
Finally, it is also important to mention studies correlating financial resources and efficiency scores, and financial resources and the effectiveness and productivity of sport federations.Ghotnian et al. (2018) used data such as amount of resources, facilities, goals and strategies to calculate the efficiency of thirty-nine sport federations.Meza et al. (2015) evaluate the efficiency of Brazilian Olympic Confederations based on the financial resources received and their conversion into results, e.g. medals. They employed two different models, the BCC model and the DEA non-radial model, which is very similar to the BCC model. The DEA non-radial model was formulated using two inputs and three outputs. The first input is represented by the funds coming from the Agnelo/Piva Law that were transferred to each Olympic Confederation by the Brazilian Olympic Committee in 2011. This input measures the amount of money available for each sport investment. The second one is the number of gold medals offered for each sport in the 2011 Guadalajara Pan American Games, as a proxy for difficulty measure in winning a medal. This second input represents the noncontrollable variable of the problem. The outputs are the number of gold, silver and bronze medals won by each sport during the same sporting event.
The above mentioned studies justify the option to use the DEA approach in the analysis of the efficiency of 16 young cadet volleyball teams. The goal of the analysis is to investigate whether and to what extent a team’s financial resources impact the team’s sports results i.e. its efficiency with respect to selected inputs and output. Moreover, a strong hold for this analysis lies in the work ofGuzmán and Morrow (2007);Gutiérrez and Lozano (2014);Moreno and Lozano (2015) whose implementation of DEA in sports using financial inputs/ outputs was very successful.
2. METHODOLOGY
Data Envelopment Analysis (DEA) was first defined by Charnes, Cooper and Rhodes in 1978, who defined it as a methodology that measures relative efficiency of decision-making units (DMUs) by converting multiple inputs into multiple outputs. DEA is a linear programming method that compares the input and output levels of a decision making unit with the levels of other DMUs from its peer group. Namely, the ratio of outputs to inputs shows the relative efficiency of each DMUo (within DMUj) which is then evaluated relatively according to the ratios of all DMUj for j = 1,2,…,n.
As previously mentioned, DEA has numerous applications because it was developed for analysing relative efficiency of non-profit DMUs with heterogeneous inputs and outputs.
2. 1 BASIC CCR AND BCC MODEL
The first model to be used in the analysis is the Charnes Cooper Rhodes model (CCR-model).
This model can be interpreted as the transformation of a multiple output/input ratio into a single
virtual input and a single virtual output that represent a measure of a particular DMU’s efficiency.
Using the obtained data, the efficiency of each DMU will be measured once, which means that n
optimization need to be performed, one for each  .
Let the
  be evaluated based on the
any trial
  for o = 1,…, n.
Fractional linear programming should be solved to obtain input
weight values for
  (i = 1,..., m)
and output weight values marked as
  (r = 1,...,s) variables.
In the mathematical form of fractional programming. this reads as (Cooper, Seiford and Tone, 2006):

subject to 
Variables  represent the output weights,
input weights, output and input values of the
observed
  respectively. The constraint ensures that the ratio of virtual output vs virtual input
for every DMU, including
  , will be less than or equal to unity.
Namely, mathematically, the
nonnegativity constraint is not sufficient for the fractional terms to have a positive value.
The second model used in the analysis is the Banker Charnes Cooper model (BCC model). The BCC model differs from the CCR model because it includes the convexity condition in its constraint. This additional constraint reflects graphically on the shape of the efficiency frontier. The efficiency frontier is spanned by efficient DMUs. The CCR model has thus a linear efficiency frontier while the BCC mode, a piecewise linear efficiency frontier. The BBC model’s piecewise linear shape is a result of variable returns to scale (SeeFigure 1).
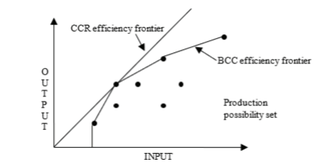
Source: Authors according to theCooper, W., Seiford, L., Tone K.: Introduction to Data Envelopment Analysis and Its Uses, Springer , 2006.
Data Envelopment Analysis models can be output or input oriented. Orientation is chosen according to the nature of the problem or the researcher’s perspective. In an input orientation, the DEA minimizes the input for a given level of output; in other words, it indicates how much a DMU can decrease its input for a given level of output. In an output orientation, the DEA maximizes the output for a given level of input; in other words, it indicates how much a DMU can increase its output for a given level of input.
However, DEA has some drawbacks. One of the main traps of the Data Envelopment Analysis is that efficiency scores are sensitive to the number of included inputs and outputs. Namely, the DEA methodology has limitations regarding the number of inputs and outputs because the efficiency scores can be overestimated in cases when the number of inputs and outputs is too high in regard to the number of variables i.e. observations. According to the studied literature, overestimation can be prevented if the number of inputs and outputs is tied to the number of DMUs (number of observations/ volleyball teams) in the following way (Dyson et al., 2001); n (number of observations) > 2ms, where m and s represent the number of inputs and outputs respectively. Another relevant solution in determining the adequate number of inputs/outputs, according to Raab and Lichty (2002), is given either by the relation n>3(m+s) or according toDespotis (2002), where n≥max {m*s; 3(m+s)}.
2. 2 SUPEREFFICIENCY MODEL
As previously stated, all efficient DMUs, according to data envelopment analysis, are ranked equally in terms of performance. The standard DEA models have a large number of applications and modifications. One of the most important extensions of the DEA model is the formulation of super-efficiency models used for ranking DMUs with an efficiency unity score. The most wellknown super efficiency model is that established byAnderson and Petersen in 1993. This model involves executing standard DEA models (constant return to scale and variable return to scale) under the assumption that the evaluated DMUs are excluded from the reference set.
The super efficiency model is given by (Petersen, Anderson 1993):

subject to 

where  represents the m-dimensional vector of input,
 the s-dimensional output vector,
 the scalar defining the share of the input vector necessary for producing the
 DMU’s
output vector within the frames of referent technology, Z the vector of intensity where
 represents the intensity of the k-unit,δ the non-Archimedean infinitesimal, and e′ the unity
vector of appropriate dimension.
Peterson and Anderson explained the consequence of excluding an evaluated unit from the reference set using a graphical example (more inAnderson, Peterson, 1993) Their model was used as a base for further super-efficiency model development (Tone, 2002).
3. DATA AND ANALYSIS
The data on the 16 analysed young cadet volleyball teams was obtained through questionnaires and interviews with individuals involved in managing the respective teams i.e. club management officials and coaches. The data covered the 2017 – 2018 season.
As only 16 DMUs are observed, we opted to take five inputs and a single output into analysis. Namely, in accordance with the above mentioned theoretical prepositions, the optimal number of observations should be greater than 10 (k >2∙5∙1) if we consider Dyson, or should be greater than 18 (3 ∙ (5+1)) if we follow Raab and Lichty.
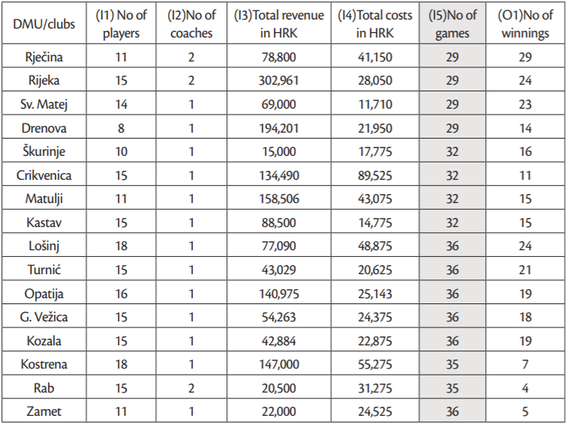
The inputs used are as follows: the number of players (girls) registered, the number of coaches, the number of games played and total revenue and total costs. The number of won games is taken as the output as it is seen as a measure of a team’s success. The revenue of a team aggregates donations and monthly membership fees while total costs include sums paid out to coaches, monthly rent for the gym, costs of medical examinations, transportation costs, registration fees and money paid out for referees. The inputs and outputs were defined in consultation with the coaches/management of young cadet volleyball teams. The number of players is taken as one of the input values because the number of players affects the number of winnings because a greater number of players enables better team management on court; moreover, it also generates more revenue from membership fees. Revenue also contributes to better practice conditions, employment of better coaches with greater experience etc. The number of coaches is the second input as their number enables more efficient work. More coaches provide for the opportunity to have target trainings with individual groups of players, regular training sessions in cases of coach absence etc. Total revenue is the third input used in the analysis because revenue levels determine the number of coaches, the number of away games, the purchase of new equipment which usually motivates players, and better balanced meals before or after away games. All these factors depend on revenue, and according to the interviewed coaches affects sport results. The same, but opposite, can be said for total costs, which is the fourth input.Table 1 shows the values of selected inputs and output.
The initial analysis included 5 inputs. However, one of them, the number of games played, was negatively correlated with the output as well as two other inputs and was, according toSarkis, (2007), excluded from the further analysis (grey column inTable 1). According to the DEA correlation matrix, all other inputs correlate positively among themselves and with the output, except for the fourth input (total costs) which negatively correlates with the output. The second analysis showed that this exclusion did not cause any changes in efficiency scores. Since we wanted to determine whether and how inefficient units can improve their output, having the same level of inputs, output oriented models are used. The DEA SolverPRO Version 11 was used to calculate the efficiency scores the above mentioned data.
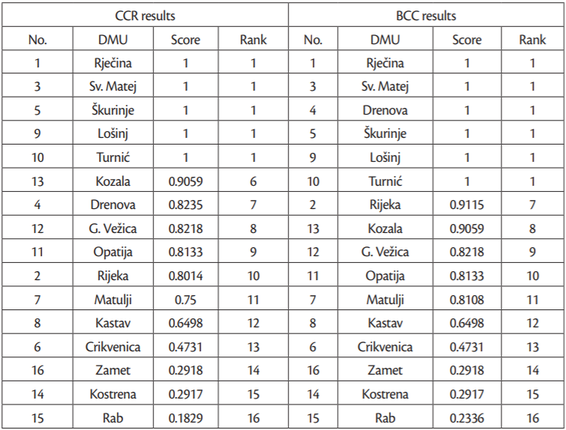
If we compare the results obtained by using the CCR and BCC models, we can notice that according to the BCC model (Table 2) one additional DMU was estimated as efficient. The initial results showed that 31.25% of units (teams) are efficient according to the CCR model and 37.5% according to the BCC model. As this difference is not significant and since only one unit more is estimated as efficient by the BCC model, there is no variable return to scale and the analysis can be continued using just the CCR model. It can be also concluded that 69% of units are estimated above average according to both models (Table 3).
4. RESULTS AND DISCUSSION
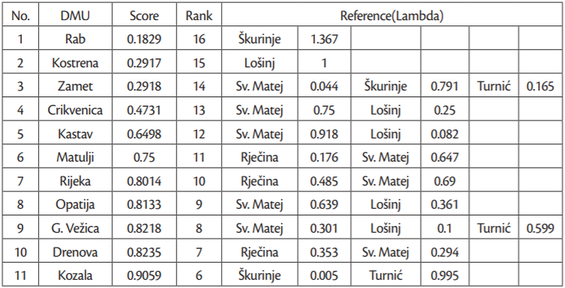
Continuing the analysis with the CCR model, the reference sets were calculated as well as the following projections. The calculated reference sets for inefficient units are presented inTable 4.
The frequency of appearance of a particular DMU in the reference sets confirms its ranking as an efficient unit. Namely, since all efficient units are rated with the maximum value of 1, the re-occurrence of a DMU in reference sets can tell us just how “strong” that evaluation really is. For instance, the DMU Sveti Matej has the highest frequency of appearing in different reference sets, i.e. Sveti Matej showed up as a referent unit in eight of the eleven cases.
A reference set also gives us information which volleyball team from the reference set can be used as a role model for others, the non-efficient volleyball teams, because all teams belonging to a reference set have very similar level of inputs but only the role model team(s) managed to achieve higher efficiency score(s).
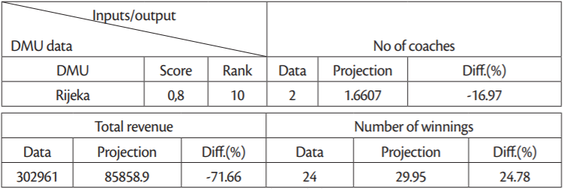
As one of the advantages of DEA lies in the possibility to calculate projections, which may serve as benchmarks for improving efficiency, we calculated the projections for every inefficient unit in our sample. For example, the projections for DMU Rijeka, calculated with respect to the liner combination of two relatively efficient teams from the reference set (Rječina and Sveti Matej), show that Rijeka can improve its performance by as much as 25%. Namely, if we observe the data presented in Table 5, it can be seen that DMU Rijeka can reach the efficiency frontier and increase the number of winnings for approximately 25% (5 more wins) according to the selected inputs because they have an additional coach and more financial resources than other teams. Looking from the input oriented perspective, it can be said that even with decreasing inputs, i.e. less financial resources and less coach engagement their performance can remain at the same level (Table 5).
As mentioned earlier, efficient units were all rated with a maximum value of 1. However, the frequency of their re-occurrence in calculated reference sets indicates that there are differences in terms of efficiency among them. In order to rank them, a super-efficiency model was used. The one we opted for was the Slack based Model (SBM – CCR model) with output orientation developed by Kaoru Tone (2001), as it minimizes weighted l1 distance from an efficient DMU to the production possibility set, excluding the evaluated unit from the set. The results of the superefficiency analysis of observed teams are shown inTable 6.
| DMU | Score | Rank |
|---|---|---|
| Škurinje | 2.1856 | 1 |
| Sv. Matej | 1.929059 | 2 |
| Rječina | 1.592743 | 3 |
| Turnić | 1.069606 | 4 |
| Lošinj | 1.043478 | 5 |
Source: Authors’ calculation
According to the obtained results, the volleyball team Škurinje was estimated as the relatively most efficient DMU. Even though its output score is not the highest, it was ranked as the most efficient DMU because its ratio of inputs to output is higher than those of other DMUs. Namely, its scores are ranked fourth, but its inputs are significantly lower than those of Rijeka, Rječina and Sveti Matej. However, it should be noted that the reference set results indicated that Sveti Matej is the most efficient team (8 out of 11 appearances) which is somewhat confirmed by its ranking according to super-efficiency scores.
5. CONCLUSION
The intention of this paper was to include financial factors as inputs and to investigate whether these factors impact the relative efficiency sports results of young cadet volleyball teams using the non-parametric DEA approach on a sample of 16 volleyball teams in Primorsko-Goranska County with respect to 4 inputs and 1 output. The basic DEA analysis showed that 31.25% of units (teams) are efficient according to the CCR model and 37.5% according to the BCC model, 5 and 6 relatively efficient DMUs respectively. The analysis also showed that financial factors are important, but not crucial, for the efficiency score. The Data Envelopment Analysis enabled us to determine that on one hand, smaller clubs, with smaller financial support, like Škurinje, Sveti Matej and Rječina can be efficient and that on the other hand, clubs with higher revenues, like Rijeka, do not always yield success. Moreover, it may be said that revenue is the main pillar in ensuring the basic conditions for efficient work, but our analysis shows that the number of winnings depends also on the quality of their work and the capacity of players to overcome inequalities in financial inputs. This capacity may result from the team’s enthusiasm, motivation and hard work, factors which have not been included in this analysis but that could surely provide answers to why teams with less financial means achieve better results in relative efficiency scores.
Generally, it can also be concluded that DEA represents a powerful tool in measuring sports efficiency which enables benchmarking between homogeneous units that works in similar conditions. It also enables the creation of reference sets based on which projections can be calculated. Furthermore, it helps club managers to detect the weaknesses and strengths of their teams in order to improve their efficiency or it can help them to find sources of inefficiency.
Most importantly, the results of this study may serve as a guideline for a fairer allocation of state funds and the introduction of new models of sustainable financing of team sports, such as the one proposed by the Opatija Initiative. Namely, the survival of sport clubs, especially those involving children and teenagers are of extreme importance for the development of any society.
In order to obtain more plausible results, the research should be extended to include a larger sample, timeframe (window analysis) and more detailed analysis of financial inputs.
* This paper has been financially supported by the University of Rijeka, project ZP UNIRI 2/19

