
1. INTRODUCTION / Uvod
Marine bivalves are often relocated to different habitats or placed in captive holding facilities for temporary refuge and propagation. This relocation helps assess the impacts of environmental construction, parasite infestations, and various trophic conditions [1-6]. Aquariums with captive holding facilities play a crucial role in tackling both local and global ecological challenges and in shaping environmental and resource management policies. These ex situ management strategies are vital for the propagation, culture, and conservation of marine species [7]. As experimental tools, captive holding facilities provide several benefits over traditional field studies, primarily by enabling the establishment of cause-and-effect relationships between stressors and their effects in natural ecosystems. These facilities are also more logistically straightforward and cost-effective compared to large-scale field experiments [3]. However, the artificial environment can stress the animals, increasing their vulnerability to starvation, disease, and decreased reproductive capacity, which can lead to translocation failure [5,6].
Phenotypic changes and growth rate variations during translocation are fundamental issues related to captive holding facilities for aquatic species [8]. Translocation to captive holding facilities typically increases the growth rate of a variety of organisms [9]. Adaptation to the diet, lower density, and aquarium conditions are additional factors of translocation that can contribute to the increased growth of bivalves [9-11]. In captive holding facilities conditions are homogenous, food is abundant and there is no natural predation [12]. In this context, measuring morphometric characteristics in aquaculture is essential for monitoring and understanding population dynamics of the organism of interest [6,11-16]. Moreover, bivalve morphometry is particularly useful for predicting current conditions, assessing stock and conducting morphological comparisons of species [11,13-17]. The combined effects of food availability, temperature variations, and stocking density significantly influence and complicate the accurate assessment of growth in aquatic populations. Temperature primarily controls bivalve metabolic processes such as filtration, clearance, and ingestion rates [18]. However, the availability and quality of food are crucial for biomass growth and can significantly influence feeding activities [19,20]. Numerous studies have highlighted how temperature, food availability and translocation affect survival rates and immune responses in diverse contexts, including aquaculture, climate change, and parasite infestations [21-25]. In recent years, the interplay between seasonal exogenous factors, such as water temperature and food availability, and endogenous factors, including size and reproduction, has become essential for comprehending the immune response of bivalves [26,27]. This interaction influences the activation of hemocytes, which play a crucial role in various processes within the host species, including immune response, nutrition, and protection against pathogens [24,26]. However, few studies have examined the growth and morphometric characteristics of Pectinidae species in the Mediterranean Sea, particularly in translocated environments or captivity [28-40].
Pectinidae species, commonly found in the Adriatic Sea, are highly valued for their commercial importance [39,40]. Among these, the pilgrim's scallop (Pecten jacobaeus L.), locally known as "capesanta," holds a significant economic role. Additionally, the queen scallop (Aequipecten opercularis L.), variegated scallop (Mimachlamys varia L.), and smooth scallop (Flexopecten glaber L.) are also commercially fished in this region [38,40]. The lucrative market for scallops has spurred efforts to cultivate P. jacobaeus and M. varia, aiming to establish a robust aquaculture industry in the southern Adriatic [30,40]. A. opercularis, with its market value on par with the dwindling wild pilgrim's scallop, presents promising prospects for aquaculture development [33-37]. Cultivating A. opercularis could also help reduce the adverse effects of fishing gear on the seabed [40]. As concerns over the negative impacts of dredging for bivalves grow, there is an increasing focus on captive scallop culture to safeguard wild populations.
Unlike other commercially valuable bivalves such as mussels and oysters in the Mediterranean region, A. opercularis has not yet been observed to thrive long-term in captivity. To provide new insights into the scallop's adaptation to captive conditions, we assessed the queen scallop in aquarium conditions over three months. We first measured the morphometric response and A. opercularis growth under a seasonal range of seawater parameters (temperature, pH and dissolved oxygen). We also identified the total number of hemocytes present in the scallops' hemolymph and determined their survival rate.
2. MATERIAL AND METHOD / Materijali i metode
2.1. Animal husbandry / Uzgoj
In October 2020, 160 specimens of A. opercularis were collected by dredge from a location 2 nautical miles southeast of the Albanež shoal in Istria, Croatia, within the E2 fishing zone (44°43’58.49”N, 13°56’48.94” E). These specimens were transported under humid conditions on ice to an aquarium facility. Upon arrival, scallops without shell damage were selected and placed on the bottom of the round 1900 L tanks (dimension: 165 cm in diameter and 90 cm in height) with a continuous flow-through seawater system and constant aeration. The scallops were acclimated for two weeks under a controlled photoperiod of 12 hours light and 12 hours dark. During this period, water temperature, pH, and dissolved oxygen levels were monitored daily using a data logger (Hanna HI98194, US). The scallops were fed daily with cultured live algae (Tetraselmis sp. and Isochrysis sp.) and freeze-dried algae (Skeletonema sp. from Phytobloom), ensuring each scallop had access to 5.17 × 10⁴ cells. During the feeding period, water flow was halted for 6 hours each day throughout the three-month experiment. Each scallop was tagged with a small plastic number for individual monitoring. Water quality was maintained by exchanging the water in the recirculated systems twice a week and cleaning the tanks of feces and leftover food once per week. Ammonia and nitrite levels were measured using photometric test kits (Machery-Nagel, Nanocolor test 0–68 and test 0–03) to ensure optimal conditions.
2.2. Morphometric measurement and growth rates / Morfometrijska mjerenja i stope rasta
Fifty specimens were processed monthly to evaluate growth parameters. Each sample was weighed (total weight, TW) using a digital balance with a precision of 0.01g. For each queen scallop, shell length (SL), shell height (SH), and shell width (SWd) were measured using a digital caliper.
The growth rates of total weight, shell length, shell height, and shell t width were calculated using the following equations:
Total Weight Growth Rate (GR W) = (Wf - Wi) / t (1)
Shell Length Growth Rate (GR L) = (Lf - Li) / t (2)
Shell Height Growth Rate (GR H) = (Hf - Hi) / t (3)
Shell Width Growth Rate (GR Wd) = (Wdf - Wdi) / t (4)
In these equations, Wf, Lf, Hf, and Wdf represent the final measurements, while Wi, Li, Hi, and Wdi represent the initial measurements of the respective parameters. The variable t denotes the number of days the scallops were kept in captivity tanks.
2.3. Total haemocyte count / Ukupni broj hemocita
Approximately 100 μL of hemolymph was collected directly from the adductor muscle when the shells were opened. To prevent hemocyte agglutination, the hemolymph was mixed with an equal volume of Tris-EDTA buffer (18 mM Tris, 0.45 M NaCl, 13 mM KCl, 16 mM d-glucose, 20 mM EDTA, pH 7.5) and then added to a Neubauer hemocytometer. The total hemocyte count (THC) was calculated as cells per mL. Counts were performed in triplicate using a Leica light microscope at 400x magnification.
2.4. Survival rate / Stopa preživljavanja
To determine the monthly survival rate, live individuals in the tanks were counted. Dead scallops were promptly removed from the experimental tanks to maintain water quality. The survival rate was calculated using the following equation:
Survival rate (%) = 100 − (100 × (N0-Nt) N0 ) (5)
In this equation, N0 represents the number of scallops at the beginning of the experiment, and Nt represents the number of live scallops after time 𝑡.
2.5. Statistical analyses / Statistička analiza
All variables were assessed for normality using the Bartlett test and for homoscedasticity using the Levene test. Specifically, morphology data, growth parameters, and total hemocyte count underwent normality testing with the Shapiro-Wilk test. To evaluate the impact of monthly challenges over the experimental period on growth parameters, a one-way ANOVA was employed. Upon detecting significant interactions (p < 0.05), individual means were further compared using Tukey’s HSD test. Statistical analyses were conducted with Statistica version 9.0 (StatSoft, USA).
3. RESULTS / Rezultati
3.1. Environmental parameters / Parametri okoliša
The recorded environmental parameters from October to December 2020 are shown in Table 1. The monthly temperature showed significant differences (ANOVA, p < 0.05), with maximum and minimum temperature values of 15.335±0.120 °C in October and 14.717±0.311 °C in November, respectively. pH and dissolved oxygen varied within a very narrow range of 7.605±0.180 and 64.858±9.034 mg/L respectively, and did not display a significant difference (ANOVA, p > 0.05).
Table 1 Average conditions (with sd) in tanks during October (OCT), November (NOV) and December (DEC) 2020
Tablica 1. Prosječni uvjeti (sa sd) u spremnicima tijekom listopada (OCT), studenoga (NOV) i prosinca (DEC) 2020.
3.2. Morphometry and growth rates / Morfometrija i stope rasta
The mean morphometric parameters of A. opercularis under the aquarium conditions for three months are reported in Table 2. The increases in these parameters were relatively consistent over the 3 months and showed no significant differences through the period of observation (ANOVA, p > 0.05). The growth performance of A. opercularis in the studied period was recorded to be 18.34±4.08 g, 51.35±3.98 mm, 51.38±3.59 mm and 18.33±2.38 mm for the total weight, shell length, shell height and shell width, respectively. Shell length and total weight showed the same increasing trend from October to November, and consistent growth from November to December, while shell height and shell width increased through three months period.
Table 2 Average of shell length (SL), shell height (SH), shell width (SWd) and total weight (TW) with standard deviation (avg±sd) of A. opercularis (N=50) during October (OCT), November (NOV) and December (DEC) 2020
Tablica 2. Prosječna duljina ljušture (SL), visina ljušture (SH), širina ljušture (SWd) i ukupna težina (TW) sa standardnom devijacijom (avg ± sd) A. opercularis (N = 50) tijekom listopada (OCT), studenoga (NOV) i prosinca (PRO) 2020.
| SL (mm) | SH (mm) | SWd (mm) | TW (g) | |
| OCT | 49.71±5.87 | 49.18±5.44 | 16.96±1.84 | 17.79±3.88 |
| NOV | 51.47±4.04 | 50.65±3.60 | 17.77±2.67 | 18.46±3.64 |
| DEC | 51.35±3.98 | 51.38±3.59 | 18.34±2.38 | 18.35±4.08 |
The growth rates per day recorded for A. opercularis during the study period are reported in Figure 1. From October to December, the time influence on growth rate weight was the lowest, without significant difference (Table 3, p > 0.05), followed by shell width, shell height and shell length which was significantly influenced as time passed (Table 3, p < 0.05). Growth rate length started with rates of 0.058±0.174 mm/day in October, 0.003±0.024 mm/day in November and 0.022±0.026 mm/day in December. The decrease in growth rate height was observed from 0.048±0.159 mm/day measured in October to 0.024±0.109 and 0.026±0.056 mm/day measured in November and December, respectively. Growth rate width started with 0.027±0.070 mm/day calculated in October, followed by 0.018±0.103 mm/day in November and 0.031±0.67 mm/day in December. A slight decrease in growth rate weight was observed from 0.022±0.107 g/day measured in October to 0.003±0.043 and 0.008±0.037 g/day measured in November and December, respectively.
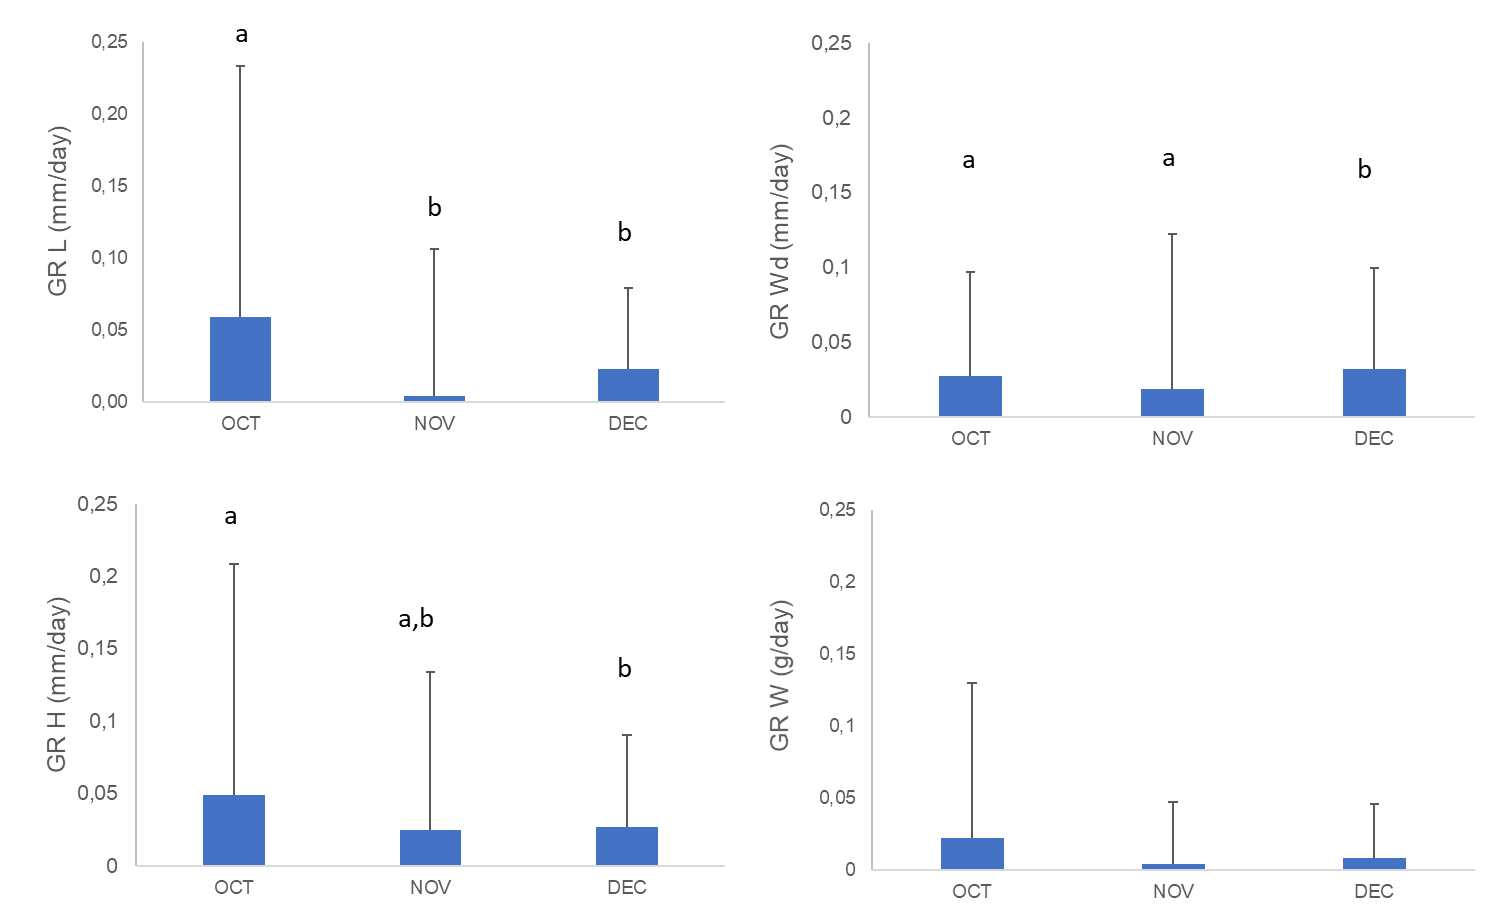
Figure 1 Average of growth rate length (GR L), growth rate height (GR H), growth rate width (GR Wd) and growth rate weight (GR W) with standard deviation (avg±sd) of A. opercularis (n=50) during October (OCT), November (NOV) and December (DEC) 2020. Different letters indicate a significant difference between growth rates per month according to the corresponding Tukey HSD post hoc test, p < 0.05
Slika 1. Prosječna duljina stope rasta (GR L), visina stope rasta (GR H), širina stope rasta (GR Wd) i težina stope rasta (GR W) sa standardnom devijacijom (avg ± sd) A. opercularisa (n = 50) tijekom listopada (OCT), studenoga (NOV) i prosinca (DEC) 2020. Različita slova označavaju značajnu razliku između stopa rasta po mjesecima prema odgovarajućem Tukey HSD post hoc testu, p < 0,05
Table 3 One-way ANOVA results for growth rate length (GR L), growth rate height (GR H), growth rate width (GR Wd) and growth rate weight (GR W) of A. opercularis (n=50) during October (OCT), November (NOV) and December (DEC) 2020. Asterisks (*) indicate a significant difference (p < 0.05)
Tablica 3. Rezultati jednosmjernog ANOVA testa za duljinu stope rasta (GR L), visinu stope rasta (GR H), širinu stope rasta (GR Wd) i težinu stope rasta (GR W) A. opercularisa (n = 50) tijekom listopada (OCT), studenoga (NOV) i prosinca (PRO) 2020. Zvjezdice (*) označavaju značajnu razliku (p < 0,05).
3.3. Total haemocyte count / Ukupni broj hemocita
In general, the total hemocyte count in A. opercularis significantly increased with time in captivity (Figure 2, Table 3); among these, scallops showed the highest number of haemocytes in December (25.846±7.251*106 cell/mL) with statistical difference compared to the October (18.475±4.034*106 cell/mL) and November (23.459±5.106*106 cell/mL) (Tukey HSD test, p < 0.05).
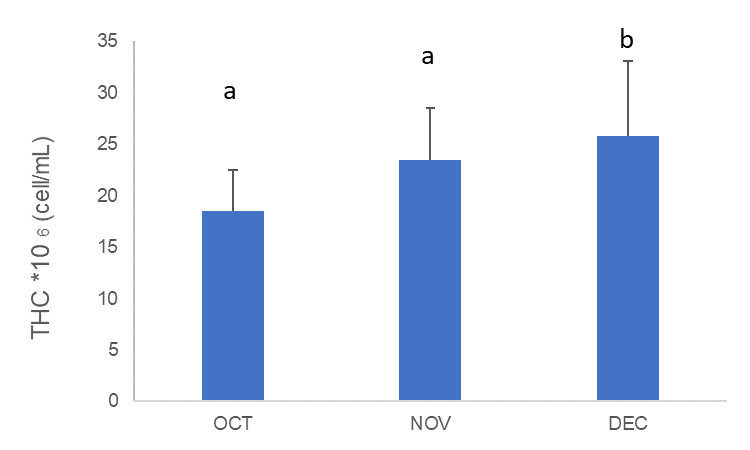
Figure 2 Total haemocyte count (THC) (avg±sd) of A. opercularis (n=50) during October (OCT), November (NOV) and December (DEC) 2020. Letters indicate a significant difference between THC per month according to the corresponding Tuchey HSD post hoc test, p < 0.05
Slika 2. Ukupni broj hemocita (THC) (avg ± sd) A. opercularisa (n = 50) tijekom listopada (OCT), studenoga (NOV) i prosinca (DEC) 2020. Slova označavaju značajnu razliku između THC-a po mjesecu prema odgovarajućem Tuchey HSD post hoc testu, p < 0,05.
3.4. Survival rate / Stopa preživljavanja
The survival rate in scallops was determined as 93.79%, 91.34% and 90.00% in October, November and December, respectively (Figure 3).
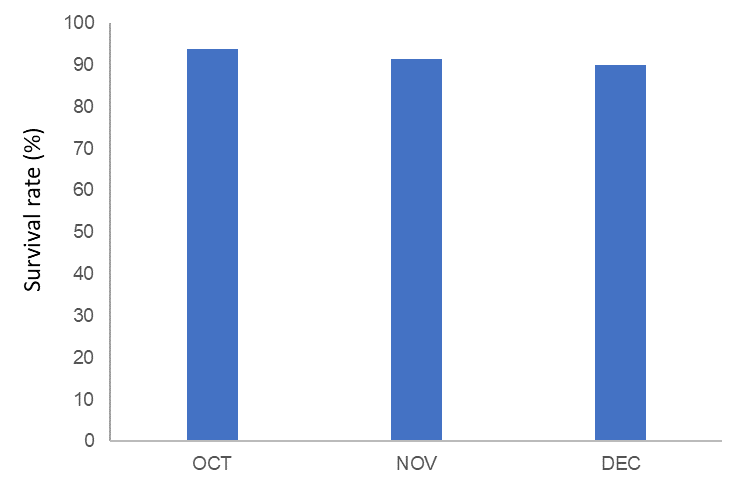
Figure 3 Survival rate of A. opercularis (n=50) during October (OCT), November (NOV) and December (DEC) 2020
Slika 3. Stopa preživljavanja A. opercularisa (n = 50) tijekom listopada (OCT), studenoga (NOV) i prosinca (DEC) 2020.
4. DISCUSSION / Rasprava
Our primary goal was to determine whether queen scallops brought into captivity exhibited survival and growth. The results suggest that queen scallops maintained in captivity and translocated to a new habitat displayed specific physiological changes over three months.
Our study found evidence of a high survival rate (nearly 90%), which may be attributed to the autumn-winter seawater temperatures, pH, dissolved oxygen concentrations but also food availability in the Northern Adriatic. The highest mean survival rate for scallops was observed in cold-temperate environments (93.27%) [9], while lower survival rates were recorded in warm-temperate and tropical regions (73.53% and 68.90%, respectively) [20]. In sea temperatures of 10-15 °C during the winter-spring period, the survival rate of the scallop Pecten maximus averaged between 90-100%, but this rate significantly decreased from May to July when temperatures exceeded 15 °C [19]. A high survival rate of 98.3% was reported for Nodipecten subnodosus spat [16] in captivity, while a lower survival rate of 42.8% was observed for juveniles [1]. Additionally, the bivalves translocated into captivity were free from predators for three months, which likely contributed to the high survival rate [8].
The diets formulated from three species used in this study—comprising two live microalgae and one freeze-dried algae, all cultured in situ—proved to be adequate for ensuring both the survival and growth of individuals over three months. Bivalves in captivity suffer from significant nutritional impairment compared to their counterparts in the wild [7]. Studies have revealed that bivalves consume substantial amounts of unidentified detritus, with estimates ranging from about 50% to 95% depending on the research [6,42]. This high detritus intake is particularly notable in smaller individuals dwelling near the sediment [43]. Our results confirm that queen scallops can ingest significant amounts of nutritional material within eight hours, and individuals on this diet reach peak growth values after three months, likely due to a combination of seawater nutrients and experimental feeding. The size of scallops at the time of translocation is crucial for predictable survival and growth [6], although prolonged captivity of adult species showed limited benefits post-translocation [35]. It was demonstrated that viable Peruvian scallop (Argopecten purpuratus) seeds in the Bahía Inglesa grew better in shell height in the environmental conditions than those kept in captivity [43]. The environmental conditions in captivity are critical, suggesting that superior nutritional conditions in seawater contribute to better growth.
The growth rate of A. opercularis in captivity varied in shell parameters from 0.003 mm/day to 0.058 mm/day, depending on the month. In comparison, the growth rate height of P. maximus in a commercial scale hatchery over the same period ranged from 0.015 to 0.062 μm/day at 15 °C [10]. Additionally, wild Atlantic Sea Scallop (Placopecten magellanicus) exhibited growth rates height ranging from 0.02-0.13 mm/day across different sites at the mouth of Penobscot Bay, Maine depending on the density of lantern nets during the fall. Optimal growth, ranging from 0.11-0.13 mm/day, was observed at low stocking density within a temperature range of 10–15 °C [19]. The daily growth rate height of the giant lion's paw (Nodipecten subnodosus) in the middle part of the Baja California peninsula, Mexico, was rapid during the experimental period, averaging 0.4 mm/day during the first two months of culture [46]. The scallops grew from an initial size of 3 mm shell height in August to 27.19 mm by October. However, over the following months, the growth rate steadily declined in November and December as noted in our research.
In this study, the growth rate weight and growth rate height of the scallops reached levels comparable to the catarina scallop (Argopecten ventricosus) and of lions-paw scallop (Nodipecten subnodosus) fed with a mix of microalgae or with the addition of probiotic cultures [1,16]. Moreover, our results show that queen scallops exhibit growth in weight like it was found in manila clam Ruditapes philippinarumin fed with microcapsule diets but also without extra diet [4]. The negative effects of temperature and stocking density were observed on scallop N. subnodosus growth rate weight, with food depletion ultimately responsible for variations in weight [41]. While limited food availability explains the low growth rates in native areas during autumn, it does not account for the low growth rates in captivity where scallops were fed daily in our study. However, decreasing temperatures significantly slow down most physiological processes in bivalves, including growth, respiration, ingestion and clearance rates [35,38,44,45]. The comparisons between growth rates of A. opercularis in captivity can be compared by using a floating downweller system where individuals of bay scallop Argopecten irradians were grown [47]. These similarities in growth rates and predisposition to grow might be attributed to factors such as water flow conditions and nutrient availability. Both the floating downweller system and the aquarium tanks used in this study allow for regulated water flow, enabling continuous feeding in a predator-free environment. In contrast, in the natural environment, nutrient conditions cannot be controlled, and bivalve growth rates are more affected by fluctuating seawater nutrients and predation. Moreover, both the floating downweller system and the controlled aquarium conditions in our study appear to mitigate what is typically considered a limiting factor for shellfish growth rates: aquaculture density.
Total hemocyte count is widely employed as a pivotal parameter for evaluating the health status of shellfish, given that the quantity and composition of hemocytes undergo discernible changes in response to stressors [24,25,27]. The immune response directly influences the scallop's reaction to external environmental conditions, such as elevated temperature and food availability and endogenous factors, such as the size of the organism and reproductional period on the hemocyte parameters [27]. In this study, the total hemocyte count increased as expected, indicating that the queen scallops adapted well to the captivity conditions. Initially, the total hemocyte count was slightly lower, likely due to acclimatization, but it increased as the bivalves adjusted to the new environment. Moreover, the increase in total hemocyte count could also be attributed to the scallops' adaptation to the amount and quality of food provided in captivity. Scallop hemocytes play a crucial role in nutrient digestion, transport, and excretion [48]. Translocated organisms often need to re-establish homeostasis after environmental changes, as confirmed by our findings on growth rates and total hemocyte count. Research on shellfish growth rates and hemocytes has become more frequent in recent years, though studies on the A. opercularis remain limited.
5. CONCLUSION / Zaključak
Improving scallop culture requires a thorough understanding of the environmental conditions that support good growth and high survival rates. Our investigation identified potential methods to support the growth and survival of queen scallops in captivity. These methods include maintaining optimal food quality and a temperature of approximately 15 °C, which appeared to positively influence scallop health under experimental conditions. The impacts of time in captivity on growth and mortality were most significant in December, resulting in the greatest differences in shell length, body weight, and the highest mortality rates. Our findings suggest that queen scallops (A. opercularis) can survive in captivity for several months, based on various physiological processes and morphological parameters during the adaptation process.
Author Contributions: Conceptualization, I.K., and M.Š.; methodology, A.Ž., I.K., T.P.; validation, A.Ž., N.I., T.P., I.K.; formal analysis, I.K. and T.P.; writing—original draft preparation, I.K.; supervision, M.Š. and P.B.; project administration, M.Š.; funding acquisition, M.Š. All authors have read and agreed to the published version of the manuscript.”
Funding: This study was part of the project “Integrated system of shellfish farming under climate change conditions” funded by the European Regional Development Fund [KK.05.1.1.02.0012].
Conflict of interest: “None.”
Acknowledgments: We would like to thank Dr. Milena Mičić from Aquarium Pula for their support in technical supply. The tanks for the scallop assessment were maintained in the Aquarium Pula.