
1. INTRODUCTION
The tourism industry has experienced a boom in the last few decades in both developed and developing countries, establishing itself as a key driver of global economic growth. The tourism industry exhibits a multiplier effect on the host country's economy by not only generating revenue in its domain but also creating new employment, increasing production, and boosting labour earnings through inter-industry linkages like transport, entertainment, hospitality, etc. (Frechtling and Horváth 1999;Rusu 2011;Pascariu and Ibănescu 2018). According to the World Travel and Tourism Council’s (WTTC) “Global Economic Impact & Trends-2020” , the tourism industry has grown at a rate of 3.5 per cent in 2019, which surpassed the 2.5 per cent growth rate of the global economy. The tourism industry also contributes around 8.8 trillion dollars in the same year, accounting for 10.4 per cent to global GDP and provides approximately 330 million jobs worldwide.
On the other hand, the world that we live in today has entered an urban age. According to the United Nation's “World Urbanisation Prospect: The 2018 Revision”, 55 per cent of the world's population used to reside in urban areas in 2018 compared to only 30 per cent in 1950. The report projects that the urban population's percentage is expected to increase to 68 per cent by the year 2050. Urbanisation has the potential to boost economic growth by providing access to infrastructures and institutions such as transport, proximity to thriving markets, networking opportunities, and government services (Turok and McGranahan 2013,Khan et al. 2018). Such urban facilities harbour investment, foster entrepreneurship, and attract educated, highly skilled, and proficient workers compared to rural areas, all of which are conducive towards economic growth.
The tourism industry's close association with the service and hospitality sector is 'inherently urbanising' in nature (Clavé and Wilson 2017). To attract and host tourists, accommodation facilities such as hotels and resorts, service facilities like restaurants and spa, entertainment spots like shopping malls, theatres, and casinos, etc. are built. It drastically stimulates the local economy and attracts migrant workers from all over the country as thriving tourist spots offer lucrative job opportunities. To further boost the tourism industry, the government also steps in and invests in urban facilities such as clean running water, undisrupted electricity supply, communication and public transport infrastructure etc.
Mullins (1991) andBrooks (2018) refer to the process as "Tourism Urbanisation" which means developing new urban areas specifically designed to attract tourists. Extensive in nature, this type of urbanisation promotes the expansion of town scale, turns rural areas into tourist destinations, and leads to the emergence of new cities and urban landscape. On the other hand, "Urban Tourism" refers to an intensive process where existing cities and towns are spatially restructured and transformed to attract more tourists (Ashworth and Page 2011). It focuses on improving the quality and availability of existing amenities.
Consequently, both tourism and urbanisation have been identified as the major contributors to environmental degradation and CO2 emissions in the world (Al-Mulali et al. 2015;Jebli and Hadhri 2018). Global tourism-related emissions increased from 3.9 to 4.5 billion metric tons of CO2 equivalent annually between the years 2009 to 2013, which is responsible for 8 per cent of the world's greenhouse gas emissions (Lenzen et al. 2018). United Nation World Tourism Organization (UNWTO) and International Transport Forum (ITF) predicts emissions from the tourism industry will account 5.3 per cent of all manmade emissions in the world by year 2030, up from 5 per cent in the year 2016 (Transport-related CO2 Emissions of the Tourism Sector-Modelling Results, 2019). Emissions from transportation alone accounts for more than 80 per cent of total CO2 emissions in the tourism industry (Tang 2015). Apart from transport, there are many other carbon-intensive industries linked with the tourism industry such as hotel and accommodation, entertainment, food, management and maintenance of tourist spots, etc. that contributes towards higher energy consumption and increased emissions of CO2 (Lenzen et al. 2018;Jebli and Hadhri 2018;Danish and Wang 2018).
Likewise, deforestation and the transformation of arable lands associated with urbanisation are identified as a primary source of environmental degradation and CO2 emissions (Zhang et al. 2018;Han et al. 2018). While extensive urbanisation may result in deforestation, obliteration of water bodies, and usurpation of agricultural or arable land, intensive urbanisation can lead to over-exploitation of available resources that may hamper sustainability. In any case, urbanisation results in higher fossil fuel usage and loss of greenery, which is likely to increase CO2 emissions (Wang et al. 2018;Martínez-Zarzoso and Marutti 2011). Moreover, modern urban facilities and employment opportunities contribute to urban migration, which is identified as an essential contributor to pollution and CO2 emissions.
The South Asian countries are advancing to the next stage of development, where they will need an optimal policy framework for the thrust industries to tie-up the development process. [1] Amin et al. (2019) have highlighted the recent momentum in the selected south Asian countries' tourism sector. They have argued that such acceleration is associated with unplanned heavy resource allocation, leading to loss of carrying capacity [2] and escalating environmental degradation in the tourist areas, which may then spill over to the overall economy. On the other hand, unplanned urbanisation is also a threat to green sustainability, and it needs meticulous attention from the policymakers.
Given this background, it is crucial to examine the nexus among tourism, urbanisation, and CO2 emissions in South Asia to ensure long term policy planning that will boost eco-tourism, holistic urban planning, and sustainable economic growth preserving environmental quality. However, most of the existing literature either focuses on the bivariate relationships between tourism-urbanisation, urbanisation-CO2 emissions and tourism-CO2 emissions or overlooks the developing region.
Previously, onlySatrovic and Muslija (2019) have studied the nexus between tourism, urbanisation, and CO2 emissions in the top 10 tourist destinations using data over time period of 1995-2016. By employing a panel Vector Auto Regression methodology, they reveal a negative relationship between urbanisation and tourism. They also find that urbanisation improves the environment's quality by reducing the CO2 emissions in developed countries. It is expected that the citizens of the developed world are very much environmentally aware and prefer sustainable tourism, and their government's urban planning and tourism policies are in line to promote so.
To our knowledge, in the South Asian context, only a few studies analysed the country-specific relationship between tourism and CO2 emission (Liu et al. 2019;Mishra et al. 2019) and urbanisation and CO2 emission (Ali et al. 2019;Franco et al. 2017) in country-specific studies. However, none of these studies focused on the tri-variate nexus among tourism, urbanisation, and CO2 emission for the South Asian countries in a heterogeneity augmented panel framework. So, this paper has attempted to fill the research gap for policy reasons and add value to the existing literature.
It is worth noting that the scenario might be quite different in South Asia. According to the WTTC, the tourism industry registered an annual growth rate of 4.5 per cent in South Asia and constituted 6.6 per cent of South Asia's total GDP in 2018. A country wise tourism growth trend is provided infigure 1. With sustained growth in middle-income households, better connectivity, and government prioritisation of the industry, tourism growth will continue to pick momentum for decades to come establishing tourism as a key driver of the economy in the region.
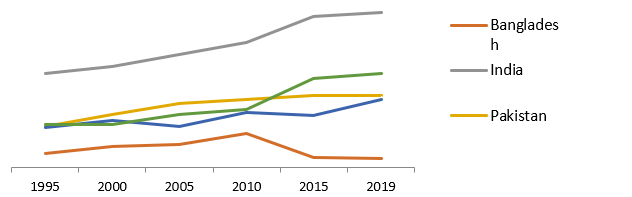
Source: World Development Indicator 2020
On the other hand, South Asia currently hosts 14 per cent of the global urban population, but with high population growth rate and macro-level urbanisation policies, this densely populated region is projected to register highest urbanisation growth rate by the year 2050 where India alone will add 416 million new urban dwellers (Figure 2).
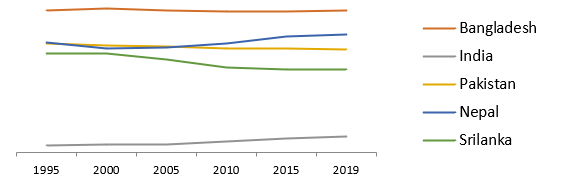
Source: World Development Indicator 2020 .
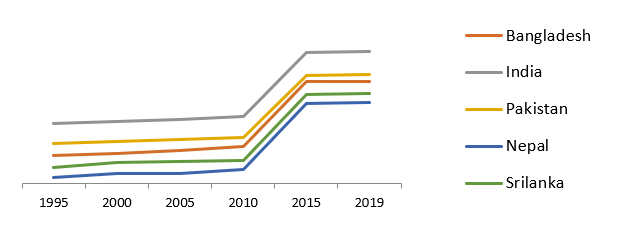
Consequently, CO2 emission in South Asia is increasing over time, as depicted infigure 3. It indicates a detrimental impact on overall environmental quality despite emerging economies of the region, registering some of the highest GDP growth rates in the world. It raises questions regarding the sustainability of economic growth and whether it is translating to a better quality of life and livelihood for its citizen. Therefore, it is of immense importance that South Asia leverages its urban and tourism growth in an environmentally sustainable way, reduce CO2 emissions and balance economic growth and environmental quality to ensure sustainable development. This paper aims to examine the tourism-urbanisation-CO2 emissions nexus in South Asia by providing empirical evidence using panel data of five South Asian countries over a time period of years 1995 -2019. [3]
We employ the Breusch-Pagan Lagrange Multiplier (LM) test, Pesaran's scaled Lagrange Multiplier (LM) test, and Pesaran's Cross-sectional Dependency to examine the stationary properties of the variables. Along with the panel unit root tests i.e., Cointegrated Augmented Dickey-Fuller (CADF) and Cross-Sectional Augmented IPS (CIPS), we also conduct a more powerful Lagrange Multiplier (LM) panel unit root test allowing for a heterogeneous structural break in both slope and intercepts of the series (Lee and Tieslau 2019). To reveal long-run cointegration among the variables, the Durbin-Hausman panel cointegration test and LM Bootstrap Panel cointegration tests are conducted (Westerlund 2008;Westerlund and Edgerton 2007). The Dumitrescu-Hurlin panel test is used to identify the causal relationship between the variables. Additionally, Panel Dynamic Ordinary Least Square (PDOLS), Pool Mean Group (PMG) Auto Regression Distributed Lag model (Panel ARDL), Continuously Updated Fully Modified OLS (Cup FMOLS), Generalised Linear Model (GLM) are conducted for estimating the long-run coefficients.
The rest of the paper is organised as follows. Section 1 describes the literature review; section 2 provides a detailed overview of data and methodology, section 3 reports the test results and their implication, and section 4 contains a conclusion with policy recommendations.
2. LITERATURE REVIEW
A brief literature review, divided into three prongs, is presented here. The first prong discusses the relationship between tourism and urbanisation. While many papers have successfully established dependency and causal relation between urbanisation and tourism, the exact causal direction among these two variables is still debatable.Luo et al.(2015) examine the consequence of urbanisation on tourism development of China's Guangdong province over a time period of 1996-2011 in a panel framework. Using Fixed Effect (FE), Random Effect (RE), and pooled OLS regression, they reveal that urbanisation has a positive but uneven effect on tourism in four Guangdong regions. Using panel data from 1999 to 2012,Zhao and Dong (2017) conduct a fixed-effect estimation and a two-step Generalized Method of Moments (GMM) estimation and find that the tourism agglomeration had a positive impact on urbanisation in China.
On the other hand,Guo et al. (2015) analyse the dynamic panel data for 31 Chinese provinces from the years 2000 to 2010 using Modified Cobb-Douglas and FE regression models. They reveal urbanisation has contributed positively towards tourism revenue growth in China.Naudé and Saayeman (2005) use Generalized Least Squares (GLS) estimation, dynamic panel regressions, and Arellano-Bond first-step GMM estimation using cross-section data and panel data for the years 1996-2000 for 43 African countries. Their results show that urbanisation has a significant positive impact on international tourist arrival.
The second prong of literature discusses the dynamic between tourism and CO2 emission.Dogan and Aslan (2017) examine the associations between energy consumption, economic growth, CO2 emissions, and tourism for the Organization of Economic Co-operation and Development (OECD) countries. Using the cross-sectional dependency, heterogeneity and other robust panel methodologies, they find a long-run relationship between the variables. Additionally, they establish one-way causal relationship from tourism to CO2 emissions using the Emirmahmutoglu-Kose panel Granger causality test.Katircioglu et al. (2014) assess the long-run relation between tourism-driven energy usage and CO2 emissions using data for Cyprus. Using a conditional Granger causality analysis, they show that international tourism works as a facilitator for increased energy consumption that eventually leads to increased CO2 emission.Eyuboglu et al. (2020) assess short-run and long-run relationships between tourism and CO2 emission, controlling for economic growth and energy consumption, and using Turkey's data for the year 1960-2014. They reveal that tourism positively affects CO2 emission, mainly due to higher energy consumption in the transport sector.Zaman et al. (2017) study the relation between tourism transportation expenditures, CO2 emissions, and energy consumption using panel data for 11 transition economies between the years 1995-2013. Their results support "energy led emissions hypothesis" and reveal that international tourism transportation expenditures positively impact CO2 emissions in the long-run.
However, there exists another school of thought that believes tourism might contribute towards reducing CO2 emission, especially if renewable energy and regulatory policies are taken into account.Jebli et al. (2014) conduct a panel data analysis using data of central and South American countries for the years 1995-2010. They reveal that renewable energy and tourism can reduce CO2 emissions.Al-Mulali et al. (2015) study how tourist arrival can affect CO2 emissions using panel data from 48 top international tourism destinations. They show that only in European countries, tourism arrival has an insignificant impact on CO2 emissions due to their strict environmental policies. Their findings suggest that tourist arrivals may reduce CO2 emissions in the long-run with proper policy implementation as tourists prefer natural beauty and less pollution. Moreover, tourism revenue can be used as an incentive for reducing emissions and promoting sustainable tourism.Koçak et al. (2020) delve further into the causality between tourism development and CO2 emission by examining panel data of the top 10 most visited countries worldwide from the year 1994 to 2014. Their empirical findings using continuously updated fully modified and continuously updated bias-corrected (CUP-BC) regression model suggest tourism arrival is associated with increased CO2 emission while tourism receipts can reduce CO2 emission as countries may redirect earnings from the tourism sector to introduce sustainable practices for further expansion of the sector.
Dogru et al. (2020) conduct an empirical analysis using the Environmental Kuznets Curve (EKC) model with panel data of 35 OECD countries between 1995 -2014. They found tourism development reduced CO2 emission only in three countries, namely Canada, Chechia, and Turkey, while the rest of the 33 countries EKC hypothesis did not hold. They concluded that countries that adopt sustainable practices for tourism development experienced a reduction in CO2 emission and can achieve economic growth through tourism expansion in the long-run. On the other hand, countries that practice unsustainable means such as deforestation, excessive use of fossil fuel, etc., to promote mass tourism will experience a higher level of environmental pollution, and CO2 emission. Since developing countries are more likely to adopt unsustainable practices, tourism expansion is expected to cause higher CO2 emission in lower-income countries.Shi et al. (2020) present similar results using data of 147 countries for the year 1995–2015. Applying IPAT and a panel model, they found that the impact of tourism on CO2 emissions gets higher as countries' income level decreases. In lower-income countries, CO2 emission increases by 0.072 per cent, and in higher-income countries CO2 emission increases by 0.059 per cent due to 1 per cent increase in the net inflow of international tourists.
Lastly, in the third prong, we review literature that explores the relationship between urbanisation and CO2 emission.Zhou et al. (2015) explore the linkage of urbanisation on CO2 emissions in China using regional panel data for the years 1990-2012. Using Stochastic Impact by Regression on Population, Affluence, and Technology (STIRPAT) methodology, they find that increased utilisation of urban lands promotes China's CO2 emissions levels.Wang et al. (2018) investigate how different types of urbanisation affect CO2 emissions using data between years 1990-2013 in the Pearl River Delta, a financially enriched region in China. A panel data regression identifies land and economic urbanisation as major contributors to CO2 emissions in the region.Martínez-Zarzoso and Maruotti (2011) have examined the dynamics between urbanisation and CO2 emissions in developing countries using data of years 1975-2003. They find an Inverted-U shaped link between the variables indicating CO2 emissions levels increases during the initial urbanisation stages.Adebayo et al. (2020) analyse panel data of emerging economies such as Mexico, Indonesia, Nigeria, and Turkey for the year 1980 – 2018 using STIRPAT and PMG ARDL methodology. They report urbanisation has a positive impact on CO2 emission but unidirectional causality running from CO2 to urbanisation.Salahuddin et al. (2018) have used panel data of 44 Sub Saharan countries in Africa between 1984 and 2016. Using second-generation panel regression methodologies with cross-sectional dependency and heterogeneous slope coefficients, they provide evidence that urbanisation causes higher CO2 emissions in the region.
3. DATA AND METHODOLOGY
3.1. Model
We follow the argument ofSatrovic and Muslija (2019) andKoçak et al. (2020)[4], and use the following equation for econometric estimation in this paper
(1)
Here, CO2 = CO2 emissions in kilo tons, UP = percentage of the population in urban area and TA = International tourist arrivals. The percentage of the urban population is used as a proxy to quantify urbanisation in this paper (Satrovic and Muslija, 2019;Martínez-Zarzoso, 2008) and the number of international tourists’ arrival as a proxy for tourism (Amin et al., 2019).
We have taken annual data of 5 South Asian countries i.e., Bangladesh, India, Sri Lanka, Nepal, and Pakistan, from 1995 to 2019. Because of data unavailability, other South Asian countries were excluded from this study. The data were collected from the World Development Indicator (2020), and we have taken the logarithm of the data to make the data set more compact. A descriptive statistics of the panel data set is provided inTable 1. [1]Satrovic and Muslija (2019) applied Vector Auto Regression (VAR) based Impulse and showed that shocks to tourism and urbanisation explain the CO2 emission in the sample countries. On the other hand,Koçak et al. (2020) used the tourism augmented STRPAT model to check impact of the tourism on CO2 emission.
3.2. Methodology
3.2.1. Cross-sectional Dependence Tests
First, we check for cross-section dependency among the variables using Breusch-Pagan Lagrange Multiplier (LM) test (1980), Pesaran's scaled Lagrange Multiplier (LM) test, and Pesaran's Cross-sectional Dependency (CD) test (Pesaran 2004). If there is no cross dependency in the data set, we can use the first-generation panel unit root test. However, if cross dependency is present in panel data set, we should conduct second generation panel unit root tests for a more reliable estimation.
3.2.2. Panel Unit Root Tests
The standard second generation panel unit root tests like Cointegrated Augmented Dickey-Fuller (CADF) and Cross-Sectional Augmented IPS (CIPS) tests are applied to identify the presence of unit root and assess the stationarity of each variable (Pesaran 2007). Panel Unit Root Test with Structural Break is conducted as well to verify whether a structural change in time series has influenced the unit-roots test results. (Perron 1989).
Lee and Tieslau (2019) propose the Lagrange Multiplier (LM) panel unit root test with level and trend shift. It allows heterogeneous structural breaks in the slope and intercepts of the data set. The test depends on a transformation procedure, which makes it invariant to the nuisance parameters. Therefore, it is more potent than the popular panel unit root tests.
3.2.3. Durbin-Hausman Panel Cointegration Test
Applying Durbin–Hausman panel cointegration test, we investigate long-run cointegration between the variables. (Westerlund 2008), Here, the existence of cointegrated variables are assessed using two separate tests. Durbin-Hausman panel statistics are applied if the cross-section is homogenous, and Durbin-Hausman group statistics are applied when the cross-section is heterogeneous. The null hypothesis for both tests assumes no cointegration among the variables against the alternative hypothesis, assuming presence of cointegration. We also conduct an LM Bootstrap Panel cointegration test (Westerlund and Edgerton 2007) with and without trend to examine long-run cointegration. The null hypothesis of LM bootstrap test assumes a cointegrating relationship among the variables against the alternative hypothesis of no cointegration.
3.2.4. Causality Test
The direction of causality has been identified using the Dumitrescu-Hurlin causality test. Using Granger non-causality panel data model designed byDumitrescu and Hurlin (2012), it is possible to test for causality even in the presence of heterogeneity.
Here, the null hypothesis is
And the alternate hypothesis is
We assume there are N1 < N individual processes when there is no causality between x and y. Here, N1 is unknown but satisfies the condition of 0 < N1/N < 1.
Here null hypothesis is there is no causality when N1 = N
If N1 = 0, there is causality among all the individuals in the sample.
3.2.5. Estimation of Long-Term Cointegration Estimations
We apply a number of regression estimation techniques such as panel–dynamic ordinary least square (PDOLS), Pooled Mean Group Auto Regression Distributed Lag model (PMG ARDL), and Continuously updated fully modified ordinary least square model (C-up FMOLS).
For panel analysis, the Dynamic OLS (DOLS) has been extended byKao and Chiang (2001). This estimation technique uses the following equation
(2)

Here q denotes the lag or lead order, which is generally chosen by info criterion. The DOLS has the advantage of controlling endogeneity in the model by augmenting proper lead and lagged differences.
In the unrestricted form of ARDL model
(3)

We can re-parameterize this equation as a vector error correction model, and by restricting β as a common element across all countries, we can write.
(4)

Based on the PMG model’s regulatory assumptions, the estimates are assumed to be consistent and asymptotically normal for the stationary and non-stationary explanatory variables (Amin et al. 2021).
Bai and Kao (2005) have proposed a continuously updated Fully Modified Ordinary Least Square model (C-up FMOLS) using a non-parametric approach for cross-sectional dependent panel data. These estimators are consistent and correct endogeneity problems, serial correlation, incidental trends, and spuriousness induced by unobservable common shocks.Bai (2009) has estimated the following model
(5)
Where a vector of common latent factor is, is vector of factor loading and is an idiosyncratic error.
Finally, we conduct a generalized linear model (GLM) regression, as it is more efficient in the presence of heteroskedasticity and autocorrelation. GLM models are an extension of the ordinary least square model (OLS). In GLM, each outcome of Y is estimated using the following model.
(6)
Here g is the link function that relates linear function (X with the response variable.
Moreover, unlike OLS, GLM does not assume that residuals follow a normal distribution having zero mean and constant variance. Instead, the variance is a function of the predicted value of y.
4. RESULTS
Table 2 reports results of Breusch-Pagan LM, Pesaran scaled LM and Pesaran CD tests to check presence of cross sectional dependency. The null hypothesis for all three tests assumes no cross-section dependency in residuals and the alternative hypothesis assumes cross-section dependence in residuals. Based on our result, we reject the null hypothesis at the 1 per cent statistical significance level for all variables. It confirms cross-sectional dependency among variables of interest, i.e., tourism, urbanisation, and CO2 emissions across the chosen countries.
| Tests | Test Statistics |
| Breusch-Pagan LM | 184.244*** |
| Pesaran scaled LM | 38.962*** |
| Pesaran CD | 13.499*** |
Note: *** and ** refers to the statistical significance level at 1% and 5% respectively.
Once the presence of cross sectional dependency is confirmed, second generation panel data methodologies i.e. CIPS and CADF tests are conducted to ensure robust findings. The null hypothesis of these tests assumes presence of unit root.Table 3 presents the results of the CIPS and CADF panel unit root tests result which shows null hypothesis cannot be rejected. It confirms the presence of unit root at level, therefore rendering all variables non-stationary at level. However, with intercept and trend, all the variables become stationary at the first-difference according to CIPS test results as the null hypothesis gets rejected. CADF test also reports similar findings except for Ln percentage of urban population which remains non-stationary at first difference.
Note: ***, **, and * show statistical significance levels of 1%, 5% and 10% respectively.
Furthermore, we run a panel unit root test with a structural break to ensure that the variables are stationary in structural breaks. This test allows for heterogeneous structural breaks in both the intercepts and slopes of each cross-section unit and corrects cross-correlations in the panel. The null hypothesis is that series has unit root in all cross-sections. The alternative hypothesis is that series is stationary in cross-sections.Table 4 shows that all the variables show unit roots in multiple structural breaks at levels. This means our variables are not mean-reverting and non-stationary at level even though we have a structural break at the level. Therefore, we have to implement the first difference to ensure our data is stationary.
Note: ***, **, and * show statistical significance levels of 1%, 5% and 10% respectively. Break dates are in parenthesis.
Since, results fromTable 3 and4 confirm our variables are not stationary at level, pre-cautions must be taken as this may result spurious coefficient estimates unless cointegration among the variables can be confirmed.Table 5 and Table 6 present the result for Durbin-Hausman Cointegration test and Bootstrap panel Cointegration test respectively.
The Durbin-Hausman test considers null hypothesis of no cointegration against alternative hypothesis of cointegration. We reject the null hypothesis of no cointegration for both group and panel test at 1 per cent significance level and confirm the existence of panel cointegration among tourism, urbanisation and CO2 emissions in the long-run.
The LM bootstrap panel cointegration test assumes the null hypothesis of cointegration in the panel for all units against the alternate hypothesis of no cointegration in the panel. We fail to reject the null hypothesis and conclude that the variables of interest i.e. tourism, urbanisation and CO2 emissions are cointegrated in the long-run.
| DH_Group | p-value | DH_Panel | p-value |
| 16.827*** | 0.000 | 9.807*** | 0.000 |
Note: *** refers to the significance level at 1%.
| Constant | Constant and Trend | |||
| Test | Test Statistic | Bootstrap P-Value | Test Statistic | Bootstrap P-Value |
| LM Bootstrap | 26.599 | 0.120 | 18.286 | 0.678 |
Table 7 reports the results derived from the Dumitrescu-Hurlin panel non-granger causality test. It shows unidirectional causalities running from urbanisation to tourism, urbanisation to CO2 emission, and tourism to CO2 emission. The results are significant at a 1 per cent significance level. The intuition behind the unidirectional causality running between urbanisation and CO2 emissions can be explained using the "urban tourism" theory byMullns (1991). International tourists have great concerns regarding security, comfort, and connectivity in developing countries. Urbanisation facilitates infrastructures for easy connectivity, transport, and accommodation, which are sure to attract more international as well as local tourists.
Note: ***, **, and * show statistical significance levels of 1%, 5% and 10% respectively.
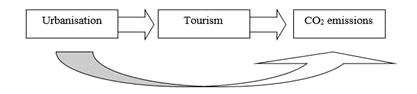
Consequently, the unidirectional causality running between tourism to CO2 emissions is supported byAmin et al. (2019), where they show tourism leads to increased energy consumption in the long-run, leading to increased CO2 emissions in South Asian countries. Additionally, the tourism industry stimulates the transport, entertainment, and food industry, all of which require heavy energy usage and very much carbon-intensive (Lenzen et al. 2018;Zaman et al. 2017). Finally, urbanisation leads to deforestation, consumption of arable land, construction of roads, highway, and other infrastructures leading to higher CO2 emissions via increased use of cars, buses, and other forms of transport, which explains the unidirectional causality between urbanisation to CO2 emission (Zhang et al. 2018;Han et al. 2018).
The impact of urbanisation on tourism is also consistent with the findings ofRico et al. (2019),Salahuddin et al. (2018), andZhao and Dong (2017), who argued that urbanisation in forms of infrastructure construction, economic migration, and tourism expansion practices increase CO2 emissions significantly. On the other hand, tourism’s contribution to increased CO2 emission is supported by findings ofKoçak et al. (2020),Dogru et al. (2020),Amin et al. (2019), andDogan and Aslan (2017), etc.
After that, we run several regression models to estimate the cointegration factor (Table 8). PDOLS estimation shows that if tourist arrival increases by 1 per cent, CO2 emissions will rise by 3.045 per cent, and if urbanisation increases by 1 per cent, there will be a 3.36 per cent increase in CO2 emissions. PMG ARDL estimation shows if tourist arrival increases by 1 per cent, then CO2 emissions will increase by 5.070 per cent. If urbanisation increases by 1 per cent, there will be a 4.55 per cent increase in CO2 emissions.
| Variables | PDOLS Estimation | PMG ARDL | C-up FMOLS |
| LnTA | 3.045**(1.63) | 5.070***(0.59) | 3.609***(0.72) |
| LnUP | 3.360(1.73) | 4.553(5.60) | 5.713(6.75) |
Note: ***, **, and * show statistical significance levels of 1%, 5% and 10% respectively. Standard errors are in parenthesis.
Continuously Updated (C-up) FMOLS estimation shows if tourist arrival increases by 1 per cent, then CO2 emissions will increase by 3.609 per cent. If urbanisation increases by 1 per cent, there will be a 5.713 per cent increase in CO2 emission.
It is noteworthy that all 3-estimation generated statistically significant estimator for the explanatory variable tourist arrivals, but urbanisation remains statistically insignificant across all the tests. Therefore, we conduct a panel heteroskedasticity test as the presence of heteroskedasticity can result in spurious correlation. Null hypothesis assumes that residuals are homoscedastic. Alternative hypothesis is that residuals are heteroskedastic. Based on results fromTable 9, we reject null hypothesis which confirms the presence of heteroskedasticity,
| Type | Likelihood Ration Value |
| Panel Cross-Section Heteroskedasticity LR Test | 33.645*** |
| Panel Period Heteroskedasticity LR Test | 102.966*** |
Note: ***, **, and * show statistical significance levels of 1%, 5% and 10% respectively
| Variables | GLM Estimation |
| LnTA | 3.151***(0.60) |
| LnUP | 3.677***(1.27) |
Note: ***, **, and * show statistical significance levels of 1%, 5% and 10% respectively. Standard errors are in parenthesis.
Therefore, lastly, we conduct an estimation using the GLM method that inherently accounts for heteroskedasticity. In GLM estimation, both tourism and urbanisation yield positive and statistically significant results at a 1 per cent significance level. It shows if tourist arrival increases by 1 per cent, then CO2 emissions will increase by 3.151 per cent and if urbanisation increases by 1 per cent, there will be a 3.677 per cent increase in CO2 emission (Table 10). These results are also consistent with our previous estimations. The estimated coefficients are consistent withKoçak et al. (2020) andDogan and Aslan (2017). Even though the underlying relationships are compatible with the previous studies, the magnitudes are highly elastic. One of the possible reasons is the developmental characteristics of the selected South Asian countries. Since these South Asian countries are developing countries, they are more likely to adopt unsustainable practices for urbanisation and tourism expansion. Therefore, these factors will contribute to a higher level of CO2 emission than developed countries.
5. CONCLUSION AND POLICY RECOMMENDATIONS
Tourism, urbanisation, and CO2 emissions are three variables that are of utmost interest in the South Asian context as the region's current and future economic growth and sustainable development prospects are deeply interlinked with these factors. However, we find that this particular topic was neglected in recent literature, especially in developing countries. So, we have examined the possible interrelationships between tourism, urbanisation, and CO2 emissions for selected South Asian countries from 1995 to 2019.
Considering a panel framework, we have initially investigated the presence of a cross-sectional dependency in the variables. Then we have employed panel unit root tests (CIPS, CADF, and LM), panel cointegration test (Durbin-Hausman); and panel causality test (Dumitrescu-Hurlin) in this paper. Finally, we have estimated the variables' long-run coefficients using the Cup-FMOLS, Panel ARDL (PMG), and Panel DOLS estimation techniques in the long-run.
We have found unidirectional causality running from urbanisation to tourism, urbanisation to CO2 emission, and tourism to CO2 emission. Such unidirectional causality highlights that the rapid urbanisation and the subsequent boosts in the tourism industry adversely impact the environment by increasing CO2 emissions in South Asia. Our finding is also supported by the GLM test, where we find that a 1 per cent increase in tourism and urbanisation can raise the CO2 emissions by 3.151 per cent and at 3.677 per cent respectively.
Our findings have significant policy implications in the context of developing countries where urban planning is more likely to be inefficient and inept. To accommodate tourists and increase tourism revenues quickly, unplanned constructions and rapid urbanisation projects are taken, which might attract tourists in the short-run but can drive away tourists in the long-run due to increased pollution and destruction of natural beauty (Shi et al. 2020;Salahuddin et al. 2018;Martínez-Zarzoso and Maruotti 2011,). Moreover, with increased urbanisation and booming tourism industry, it is expected that CO2 emissions will also increase due to higher energy consumption coupled with the loss of greenery (Koçak et al. 2020;Amin et al. 2019;Zaman et al. 2017).
We recommend that the South Asian government should adopt long-term urban planning policies by providing the opportunity to exploit economies of scale associated with expensive public infrastructures such as mass transits, large scale recycling and waste management plans, etc. Secondly, policies encouraging renewable energy use must be integrated with long-term urban planning and tourism promotion strategies. The promotion of renewable energy can replace fossil fuel usage, and then the CO2 emissions can be curbed by a significant amount (Khandker, et al. 2018). All these policies are aligned to promote sustainable tourism that inherently encourages the use of renewable energy, waste management, and recycling considering the assimilation capacity of the ecosystem, energy-efficient transport, and eco-friendly accommodations, etc.
One of this study's main limitations is the small sample size, as the panel data set includes 375 observations. The inclusion of more data would provide more robust findings. However, due to data unavailability, that was not possible.
One avenue of extending the paper is to study the link between the variables at the disaggregated level in South Asia. Since the use of renewable energy is gradually increasing in this region; it would be interesting to explore how such sustainable practices affect tourism, urbanisation and CO2 emission in long-run. We also like to extend this research by incorporating the Covid-19 pandemic in the analysis of the South Asian region through the lens of the paper's variables. The post-pandemic scenario may require a stimulus package for the promotion of the tourism sector and generation employment for the newly unemployed workers. These are, however, left for future research.