
1. INTRODUCTION
The popularity of the internet has driven rapid online linkage and transmission of huge amounts of information in various fields. Search engines locate correct information from a huge amount of available information. Businesses can investigate consumers’ behavior by searching the frequency of their keywords and messages on websites. Governments also make use of keyword rankings.
Internet marketing analysis shows that product-related keyword rankings reflect consumers’ interests. In other words, the higher the product keyword ranking, the greater the possibility that potential customers may be converted into actual consumers. Therefore, information search behavior can be considered a type of consumer behavior. According to the Taiwan Network Information Center’s study, “Survey of Wireless Internet Usage in Taiwan 2016,” 72.6% of citizens use the mobile internet. Sightseeing and tourism-related information is searched for by 24.7%.Ho et al. (2016) constructed a behavioral model of travel information with smartphone users, constructed byHo, et al. (2016), revealed significant differences from traditional consumer behavior.
Economic factors such as the exchange rate, personal income, and price level significantly affect the demand for international tourism. The cost of travel obviously varies according to exchange rate variations. Higher personal income generally facilitates the ability to travel and to consume. The price level of a destination country is a reference point for tourists. It can also be used as an alternative variable for basic environmental construction, tourism facilities, and product quality (Zhang and Jensen 2007). However, higher price levels also increase travel costs.
Other than economic factors, political risks, the cultural landscape, sanitation, tourism facilities, weather conditions, and other items, can be reviewed in online media reports, social website recommendations, and relevant websites’ evaluations and comments. In 2001, 85% of internet users used search engines (Wang 2001). Searching behavior can be classified into keyword searching and web indexing. Keyword searching is based on inquiries. Users obtain information based upon the keywords they enter. In web indexing, users acquire information by reading a webpage and its related links. Online searching allows users to collect a quantity of information and may reduce uncertainty about destination countries. Online information is easily organized and provides a better search profile in terms of timing and geography. Therefore, to evaluate attentiveness and interest in consumption, it is appropriate to adopt searching behavior and frequency as proxy variables.Choi and Varian (2009) analyzed online searches to predict sales of household products and the number of tourists.
This study, the first to consider both economic variables and information behavior together, analyzes tourism demand to improve the relevance and predictive ability of active searching in the tourism industry. The study’s subjects are the 13 most popular Taiwanese tourist destinations in 2016. Factors relevant to international tourism are studied by examining standard economic factors plus information searching about these 13 countries, from 2008 to 2016. The study’s results can assist government tourism departments frame policies and help the tourism industry design marketing activities.
The study is organized as follows: Section 2 presents a literature review, Section 3 derives the theoretical model and the regression model, Section 4 presents the data and the empirical results, and Section 5 offers a conclusion.
2. LITERATURE REVIEW
Correlations between international tourism and economic variables in the literature focus on the number of inbound tourists, the exchange rate, national income, and price level.Nieh and Choi (2002) discussed the impact of economic variables on the number of inbound tourists to Taiwan and tourism foreign exchange earnings from 1956 to 2000. Economic variables included Real Gross Domestic Product (RGDP), the Consumer Price Index (CPI), and the Exchange Rate (ER). They applied a vector autoregressive model and an error correction model to examine the dynamic relationship between long- and short-term impacts. Results given by the impulse response function show that Taiwan’s ER has a maximum effect on the number of inbound tourists in the short term. In addition, variance decomposition results reveal that variations of the ER and RGDP are important factors that influence the number of inbound tourists. However, the number of inbound tourists leads to major fluctuations in foreign exchange earnings from tourism compared with the other variables. In the long term, RGDP foreign exchange earnings from tourism greatly influence the number of inbound tourists, according to the vector error correction model.Liu (2006) studied the number of inbound tourists in Taiwan from 1999 to 2005 under various administrative, cultural, geographic, and economic conditions. He defined two economic factors, the ER and trade volume, as proxy variables and adopted a panel data method to precede the empirical research. His results show that these two economic factors affected the number of inbound tourists to Taiwan.
Cheng (2010) used a panel data econometric model method to discuss how the per capita GDP, CPI, relative Taiwanese ER, and the previous number of tourists to Taiwan impact the number of tourists arriving to Taiwan. The study showed that while annual, average per-capita GDP had a positive effect on the number of visitors to Taiwan, its influence was minimal. Moreover, the number of tourists visiting Taiwan previously had a positive and significant influence on the number of future tourists. Contrary to expectations, CPI did not provide effective statistical results. However, Taiwanese ER provided a contrasting result regarding the number of inbound tourists.Toh, Khan and Koh (2001) andWebber (2001) analyzed how the overall variables, such as price, income, and ER fluctuations impacted tourism demands.Lim and McAleer (2002) applied an error correction model to analyze the influences of real income, tourism prices, real ER, and transportation costs on the number of tourists traveling from Malaysia to Australia. The results revealed a long term, balanced relationship between transportation costs, ER, and international tourism demand. Using CPI and ER,Kulendran and Witt (2003) used seasonal data from 1978 to 1995 to analyze the number of tourists traveling from Britain to Europe and the United States.Song and Witt (2003) analyzed the impacts generated by GDP, real trade balance, tourism price, CPI, and other contingencies on the number of tourists traveling from Germany, Japan, Britain, and the United States to South Korea.Song, Witt, and Jensen (2003) adopted five quantitative models to analyze real consumption expenditures, real living expenses, CPI, the price of tourism in other countries, and trends over time, suggested that these factors influenced the number of tourists traveling from Germany, Holland, Norway, Sweden, Britain, and the United States to Denmark between 1969 and 1993.Han et al. (2006) used an ideal-approximation demand model to study how economic variables affected tourism demands of American travelers in Europe. The model demonstrated how relative price, ER, and expenditures influenced tourism demand Competitive prices were an important factor for American travelers to France, Italy, and Spain but were irrelevant for Britain. Furthermore, the demand model found no significant difference between the alternative price index when the tourism price index was absent. Using a Generalized Method of Moments,De Vita (2014) studied the ER’s impact on international tourism demand, using data from 27 Organization for Economic Cooperation and Development (OECD) countries, as well as some non-OECD ones. For the 27 OECD countries, inbound tourism statistics between 1980 and 2011 were the independent variables. The results, which showed that different ERs affected tourism demand differently, supported maintaining a relatively stable ER, which is important for attracting international tourists.
Convenience and universality are two advantages of using the internet to search for information. Using economic statistics derived from the internet,Ettredge et al. (2005) predicted the U.S. unemployment rate.Mishne and De Rijke (2006) used Facebook’s National Happiness Index to estimate economic gain.Choi and Varian (2009) applied keyword search frequency in Google to predict unemployment rates, demand for cars, and the relative attractiveness of tourist destinations.Guzman (2011) used information provided by Google searches to predict inflation rates. In the finance field, by accessing Google’s Search Volume Index (GSVI),Da et al. (2011) proposed investor attention as a proxy variable. Later, the use of GSVI for capital market investment target pricing, liquidity, and return volatility was studied byBank, Larch, and Peter (2011) andDrake, Roulstone, and Thornock (2012).Luo et al. (2013) used empirical GSVI results to show that investor attention is a significant explanatory variable of abnormal rewards and trading volume. These studies indicated that open information can accelerate the transfer of marketing information and promote market efficiencies.
Travel planning is facilitated by searching for information on the internet. Member, a Japanese company that investigated internet use in ten countries, including Taiwan, found that Google’s search engine ranked first among all search engines in 2016. Hence, users’ internet search patterns can be analyzed through Google.Choi and Varian (2012) used Google Trends data as the explanatory variable in a self-regression model to predict the number of preferred tourist destinations.Bangwayo-Skeete and Skeete (2015), who used time-series samples obtained from Google Trends to construct a travel demand prediction model, showed that Google Trends can predict tourists’ intentions, a finding that augments tourism income.Park et al. (2017), by establishing a time series model incorporating Google Trends’ variables that combined internet data and keywords, was able to predict short-term Japanese tourist visits to South Korea. This prediction model was more accurate than the standard time-series model.Li et al. (2017) also used search engine query data to predict the demand for tourism destinations, including the number of tourists and hotel occupancy rates. They also used a generalized dynamic factor model to validate the prediction of the number of tourists visiting Beijing. Overall, this method has a better predictive ability than the traditional model.
Earlier studies show that both economic variable analysis and internet searching behavior can uncover why international tourists visit Taiwan. However, the relevant question of international tourists visiting Taiwan does not yet connect internet search behavior to the demand model. Therefore, the present study attempts to identify the factors that affect the quantity and quality of international tourism. Rather than looking at them individually, it considers both economic factors and internet search behavior together. In addition to economic factors, the study proposes that the potential predictive ability of active internet searching reveals tourism trends faster by analyzing time-series data acquired from many countries. This study can be used as a reference for policy determinations and operations strategies by governments and the tourism industry to provide better travel quality and satisfaction, and higher tourism revenues.
3. THEORETICAL MODEL
According toMorley (1992), the personal utility function is as follows:
where uijt denotes a person’s utility at timet when traveling from countryito country j, denotes the number of trips from country i to country j, qit denotes the quantity of other products consumed by a person, and ojt denotes the relevant qualitative tourism factor in destination country j. The constraint condition of income, attached to the number of tourists, is as follows:
where cijt denotes average expenditures traveling from country i to country j, and pit and Iit denote the consumer price level and personal income in countryi, respectively. Hence, the problem of searching for a maximum value utility function under the constraint condition can be expressed as follows:
The demand function of a person who travels from country i to country j is obtained using a Lagrangian function:
The first-order conditions of this problem give the following set of equations:
.
.
.
The solution of this set of equations gives the optimum levels of consumption of other goods (q*) and an optimum number of trips (n*):
Total demand, which sums all individual demand functions, can be expressed as
Assume that the demand function is a coefficient-fixed variable multiplicative function, such that Equation (7) can be expressed as follows:
Equation (9) can be formulated by taking the log value of Equation (8):
where, are β1, β2, β3, β4 the parameters to be estimated. Equation (9) shows the total demand function of traveling from country i to j country.
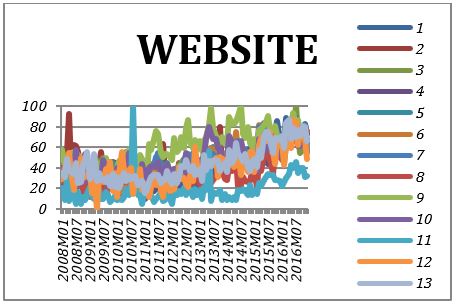
Since GSVI proposed investor attention as the proxy variable, it can also be applied as a preference variable that affects the demand function. Search behavior can be classified into news and websites. Search keywords on the internet and destination-related news and websites also affect travel choice. Therefore, GSVI related to news and websites, which represents the awareness factor of travel in destination country j, is respectively denoted as NEWSt and WEBSITEt. The model can be represented as
where β1, β2, β3, β4 are the influence parameters of the total factor to the number of tourists, and β5, β6 are the estimation parameters that refer to the influence of internet search behavior on tourism quality and the number of tourists.
4. DATA ANALYSIS AND EMPIRICAL RESULTS
4.1. Data Analysis
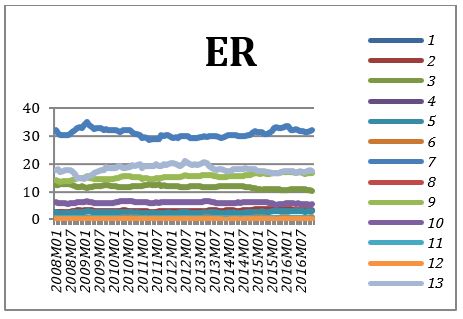
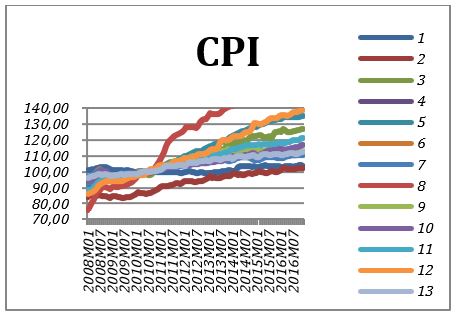
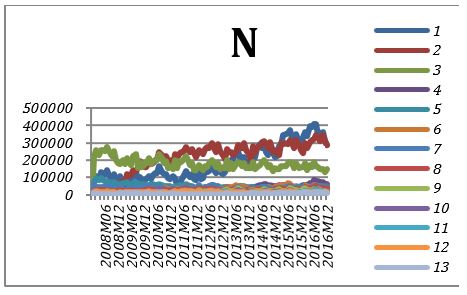
According to the total tourism demand function in Equation (9), the variableNIJtthat must be elucidated is the number of tourists traveling from Taiwan to other countries. Taiwan’s consumer price level PIt is represented by the amount spent on other commodities. The price level of the destination country JPJtand the ERIJt are the explanatory variables of travel expenditures. The income proxy variable that refers to Taiwan is per-capita GDP. The keywords and the search behavior for related news are the proxy variables,
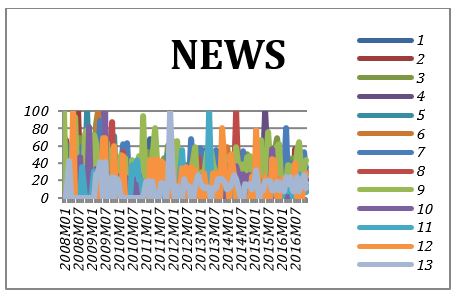
where and represent the frequency with which a news event and a keyword were searched for in a specific area and about a specific topic, respectively. Therefore, NEWS and WEBSITE are percentage variables between 0 and 100. For the sake of simplicity, the present study uses the destination country’s name plus tourism (e.g., Japan + tourism) as the keyword and news search trend indexes. The variables and data sources are summarized inTable 1.
According to statistics provided by the Bureau of Tourism in Taiwan, the top 13 countries (more than 95% of the total number of tourists, denoted by Index 1–13, in order) are chosen as the first stops for Taiwanese tourists traveling abroad in 2016. These countries are Japan, Mainland China, Hong Kong, South Korea, Macao, Thailand, the United States, Vietnam, Singapore, Malaysia, the Philippines, Indonesia, and Australia. Because of their geographical proximity and similar cultural customs, the data show that the Asian countries are always the first stop for Taiwanese tourists traveling abroad.
| Variable | Abbreviation | Data Source |
| Number of tourists traveling from Taiwan to other countries | N | Tourism Bureau, Ministry of Transportation and Communications, R.O.C. |
| Consumer price index in the destination country | CPI | IMF |
| Exchange rate between New Taiwan dollars and the currency in the destination country | ER | IMF |
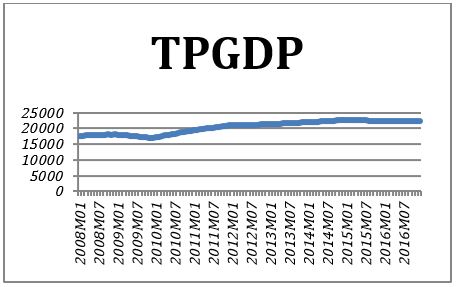
| Average personal gross domestic product in Taiwan (U.S. Dollars) | TPGDP | IMF |
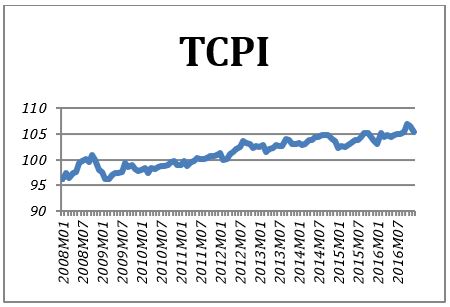
| Taiwan consumer price level | TCPI | IMF |
| Google search trend index (news) | NEWS | https://trends.google.com |
| Google search trend index (keywords) | WEBSITE | https://trends.google.com |
Note:
1. Monthly data were collected from January, 2008 to December, 2016. The average interpolation method was used to calculate monthly values from quarterly data TPGDP.
2. To facilitate international comparisons, the PGDP and TPGDP are denominated in U.S. dollars.
3. CPI and TCPI in destination countries and in Taiwan are based on 2010 data.
Because the Google Search Trend Index began in 2008, economic data from January, 2008 to December, 2016 were extracted. Except for the TPGDP, which is quarterly, all data are monthly. Therefore, monthly data occurs most often. TPGDP was converted from quarterly to monthly by interpolation. Figure 1 shows all data per level variable, with unreasonable outlier data being excluded. It is noteworthy that in the March, 2008 observation, for variable N with the number 0, there were 107 monthly observations for Mainland China. For other countries, 108 monthly observations are used. Such a dataset is called an unbalanced panel model.
Table 2 shows the descriptive statistics of level variables. In terms of the number of Taiwanese overseas tourists (N), Mainland China had the highest average number among the 13 countries, and Australia had the lowest. Japan showed the most tourist volatility, and Australia the showed the least. The countries with the highest and lowest average CPI were Vietnam and China, respectively. Indonesia had the most volatile price level, and Japan had the most stable. The most and least volatile ER occurred in the United States and Vietnam, respectively. The greatest average NEWS was in Hong Kong, and the lowest was in Australia. The consumer price level in Taiwan had maximum and minimum values of 106.99 and 96.13, according to TCPI records. This means that the consumer price level in Taiwan was stable. Finally, the value of Google news searches was much lower than that of keyword searches.
Monthly economic time series, which are characterized by seasonal patterns of climate, customs, production cycles, and holidays, interfere with time series data, making research analysis more complex. Seasonal adjustment refers to the seasonal factors implied in the time series. For the economic data to accurately reflect business cycle changes, which is helpful for research and analysis, these factors are adjusted by statistical methods.Blakely’s (2013) seasonal adjustment method (X-13ARIMA-SEATS), released by the Bureau of the Census, was adapted to the study data (except for the percentage variables NEWS and WEBSITE, as with zero values). After excluding seasonal changes, the impact of other factors on tourism demand was more accurately analyzed. As shown in the previous literature (Gil-Pareja et al. 2007;Fourie and Santana-Gallego 2012), to study the main determinants of tourism volume, the log of Equation (8) is needed for estimation. However, because NEWS and WEBSITE contain many zero values, the logarithm cannot be considered. The log values of seasonal adjustment time-series data (N, CPI, ER, TPGDP, and TCPI) were used for the following analysis.
By calculating the variables’ correlation coefficient matrix,Table 3 shows whether collinearity exists between variables for all observations.Table 3 also shows that the covariances of N and CPI, ER and CPI, and ER and TPGDP are negative, while the covariances of other variables are positive. The correlation coefficient of TPGDP and TCPI is approximately equal to 0.89, and the rest are less than 0.7. The correlation coefficient between these variables may be positive or negative. Therefore, since the probability of collinearity between the variables is relatively low, it can be used to estimate the parameters of the regression model.
Note: The index of countries 1–13, in order, denotes Japan, Mainland China, Hong Kong, South Korea, Macao, Thailand, the United States, Vietnam,Singapore, Malaysia, the Philippines, Indonesia, and Australia.
Note:
1. The level value of data series collected are monthly data from January, 2008 to December, 2016.
2. The Index 1-13 of countries, in order, denotes Japan, Mainland China, Hong Kong, South Korea, Macao, Thailand, the United States, Vietnam, Singapore, Malaysia, the Philippines, Indonesia, and Australia.
4.2. Empirical Results
The data can be obtained by tracking specific subjects over a time, while estimating the econometric model of the demand function for specific countries. A model with data over time for the same cross-section units is called the panel data model. The panel data model allows using the information by only considering time periods or cross sections. In addition, it is more realistic than a single time series model or a simple cross-section model, thereby facilitating in-depth analysis. Panel data models are popular measurement tools. Because an unreasonable observation of N for Mainland China on March, 2008 is excluded, an unbalanced panel model is used for this country.
Note: Log values of data series N, CPI, ER, TPGDP, and TCPI, and level values of NEWS and WBSITE, are from January, 2008 to December, 2016.
To avoid spurious regression when the variables are non-stationary, the four-unit root test on all the variables were run to examine whether the same unit root existed between different cross sections. The null hypothesis asserts that the variables have a common unit root process among different individuals for an LLC test (Levin et al. 2002). An individual unit root process is assumed for a null hypothesis of Im, ADF, and PP tests, which are in a non-stationary state. However, the alternative hypothesis says that when the variables do not have the same unit root (LLC) or individual unit root (Im, ADF, and PP), they are in a steady state.Table 4 presents the verification results, which show that N, NEWS, and WEBSITE reject the null hypothesis for all four tests; that is, the variables are stationary. Because the judgment rule occurs in the majority of these four tests, CPI rejects the unit root null hypothesis by the LLC and PP test, according to the main LLC test, and regards it as a stationary variable. However, most p-values cannot reject the null hypothesis of the four tests for ER, TPGDP, and TCPI as the majority rule of these four tests, which implies that they are not stationary. Therefore, a first-order difference (DER, DTPGDP, and DTCPI) for non-stationary variables is needed to stabilize them before proceeding to the regression model estimation. The unit root test is further carried out on the first-order difference of all robust, stationary variables (DN, DNEWS, DWEBSITE, DER, DTPGDP, and DTCPI). Then, the result that all variables reject the null hypothesis is derived. In other words, they all are stationary variables.
The dependent variable, derived from the demand function, is the number of Taiwanese people going abroad, and the independent variables are the economic and search behavior variables. It is also worth considering whether a feedback relationship exists that affects the search index by the number of people traveling abroad. By taking N, NEWS, and WEBSITE, respectively, as dependent variables, this gives three regressing equations. DER, DTPGDP, DTCPI, and CPI are the common independent variables.
We now consider the random and fixed-effects’ assumptions on unobserved effects in the panel data model. Unobserved effects are captured in two ways: using different time periods for the same individual (the “period” manner) and different country characteristics over the same period (the “cross-section” manner). Since DTPGDP and DTCPI are the same explanatory variables for all countries in a specific year, period effects cannot be estimated. The null hypothesis of Hausman tests (1978) implies that a random effects’ estimator is consistent; otherwise, they would be inconsistent. Hausman statistics determine the suitability of the models inTable 5. They all reject the null hypothesis by p-value, showing that the fixed-effects’ estimators are more appropriate for cross sections. Then, redundant fixed effects and Wald tests compare fixed effects, and a pooled OLS estimator is used. Under the null hypothesis, fixed effects are redundant in cross sections.Table 6 shows that the associated p-values strongly reject the null hypothesis that fixed effects are redundant. For robustness, a Wald statistic was computed, using the fixed-effects dummy variable estimator, under the null hypothesis =0. This implies that a pooled OLS estimator is more appropriate and that alternative, fixed effects are significant. The results of the Wald test inTable 7 also show that the all null hypotheses are rejected, suggesting that fixed-effects estimators are preferred.
The fixed-effects approach in cross sections was used sequentially in the regression equation, with N, NEWS, and WEBSITE as the dependent variables. The cross-sectional weights’ covariance matrix estimates are shown inTable 8, Panel A. Panel-corrected, standard error, robust covariance estimators are simultaneously estimated inTable 8, Panel B. From the regression’s empirical results, with N as a dependent variable, the effects of CPI, WEBSITE, and DTCPI on N are statistically and significantly positive, while the effects of NEWS on N are statistically significant but negative. When the CPI of destination countries increases by 1%, the demand elasticity of N rises to 0.246%. The number of Taiwanese visitors to countries rises as the search index of the travel webpage of the destination countries and the difference CPI in Taiwan increases. The empirical results of the regression equation, with NEWS as a dependent variable, show that N, WEBSITE, DTPGDP, and DER are statistically significant, while WEBSITE, DTPGDP, and NEWS have the same directional change and N and DER present a negative relationship to NEWS. The different increase in Taiwan’s two-period average national income shows that the ability to travel, as well as the popularity of searches for tourism news about destination countries, has increased. When Google searches in the travel webpages of destination countries increased by 1%, the popularity of travel news searches for destination countries increased by 0.225%. However, a difference between the ER and the number of tourists from Taiwan presents a negative relationship with the news search index. Empirical results of the regression equation with the dependent variable WEBSITE show that the estimated coefficients of all explanatory variables are statistically significant, except for DER and DTPGDP. N, CPI, NEWS, and WEBSITE, which follow the same direction of change as the average monthly CPI of the destination country. When the number of tourists from Taiwan and the search index of traveling news increase, the search index of the destination country’s travel webpage will rise. A 1% change in the search index of traveling news caused a 0.086% change in the search index of the traveling webpage (in the same direction). While the DTCPI and the WEBSITE show a negative relationship, a DTCPI rise indicated that since income available for travel abroad decreased, the search for travel webpages in destination countries also declined. To further confirm the robustness of the estimation results, panel-corrected, standard error, robust covariance methods are used. The same effects are listed inTable 8, Panel B.
Based on earlier estimation results, the impact of economic factors on the demand for travel abroad in Taiwan is not the same as that found in earlier literature (e.g., the effect of ER is different from that inNieh and Chou 2002). This may be because the independent variables and the models used in each study are different, but the influence of search behavior and the conclusions are similar to those in the literature. The present study first discusses separately the impact of the search index based on news and webpages, which is not only statistically significant but also changes in the same direction as the search index of travel webpages for the destination country where people are traveling. That is, when the search index for travel webpages grew, the number of Taiwanese tourists visiting the country also increased, but the search index for the country’s travel news turned negative. It is worth noting that WEBSITE and N have statistically significant explanatory powers for each other. Another noteworthy conclusion is that when the number of tourists going abroad rises, the search index of the country’s travel webpages also increases, but the search index for travel news decreases. This situation may arise because the news also contains negative reports, which affects people’s willingness to travel to certain countries. On the other hand, webpage searches are decided by the users of the information themselves, who already have travel plans or who are willing to make them. Hence, these information users can be regarded as potential customers. By collecting information, these potential customers can easily be converted into actual consumers. Therefore, the frequency of keywords searches has a positive relationship on the number of Taiwanese overseas tourists. The relationship between this search behavior and the number of tourists can be used as a reference for relevant government units and the tourism industry.
In addition, the empirical results show that the monthly changes of Taiwan’s ER and its per-capita GDP do not have statistically significant effects on the number of Taiwanese overseas tourists. When the ER represents travel costs and Taiwan’s per-capita GDP represents a proxy variable for personal income, there is no statistical impact on the demand for traveling abroad when personal income changes.
Note:
1. Log values of data series N, CPI, ER, TPGDP, and TCPI, level values of NEWS and WBSITE, are used from January, 2008 to December, 2016.
2. DN, DCPI, DER, DNEWS, DWEBSITE, DTPGDP, and DTCPI stand for differenced variables.
3. ***,**, and * represent the null hypothesis, rejected at the 1%, 5%, and 10% significance levels, respectively
Note:
1. Log values of data series N, CPI, ER, TPGDP, and TCPI, level values of NEWS and WBSITE, are used from January, 2008 to December, 2016.
2. The differenced variables DER, DTPGDP, and DTCPI are used as independent variables after taking log values.
3. ***,**, and * represent the null hypothesis, rejected at the 1%, 5%, and 10% significance levels, respectively.
Note:
1. Log values of data series N, CPI, ER, TPGDP, and TCPI, level values of NEWS and WBSITE are used from January, 2008 to December, 2016.
2. The differenced variables DER, DTPGDP, and DTCPI are used as independent variables after taking log values.
3. *** denotes that the null hypothesis is rejected at the 1% significance level.
Note:
1. Log values of data series N, CPI, ER, TPGDP, and TCPI, level values of NEWS and WBSITE, are used from January, 2008 to December, 2016.
2. The differenced variables DER, DTPGDP, and DTCPI are used as independent variables after taking log values.
3. ***,**, and * represent the null hypothesis, rejected at the 1%, 5%, and 10% significance levels, respectively.
5. CONCLUSION
The present study considers effects generated by numerous variables on Taiwanese overseas tourism. The number of Taiwanese tourists visiting the top 13 countries, economic variables, and information searching features were analyzed. According to the estimation results of the panel data model, while N and NEWS, DER and NEWS, and DTCPI and WEBSITE showed a significant negative relationship, they followed the same direction of change as between N and WEBSITE, CPI, DTCPI, NEWS and WEBSITE, DTPGDP and WEBSITE, and CPI.
From the estimation parameters of economic variables, it can be seen that CPI and DTCPI have significantly positive impacts on the number of Taiwanese overseas tourists. DTPGDP and NEWS move in the same direction, which implies that Taiwan’s average national income increase stimulated travel and that the popularity of tourism news in destination countries has increased. The negative relationship of DTCPI and WEBSITE might be due to the rise in DTCPI, indicating that income available for travel abroad has decreased. Therefore, the search for travel webpages in destination countries declined as well.
Regarding information factors, the frequency of Google searches for travel news about a destination country has a statistically significant and inverse impact on the number of Taiwanese overseas tourists. This indicates that the effectiveness of online search behavior is different from that of other variables. With regard to public news searches, the effect deliberately created by the media has the opposite effect on overseas travel demand. Keyword searches, which reflect the frequency of web visits by general users, increase the inclination of Taiwanese to travel abroad, likely because travel webpages illustrate pleasant experiences. The positive relationship between NEWS and WEBSITE means that more travel webpage searches increase the number of searches for travel news. WEBSITE and N statistically and significantly explain each other. If a good strategy exists, there is a positive cycle between these factors.
This study contributes to the empirical research results of search behavior in the tourism industry. Information users can be regarded as potential customers, who, by collecting information, can easily be converted into actual consumers by marketing processes. Tourism-related government units and the tourism industry can use these empirical results to build tourism and to control price levels to meet long-term goals. In the short-term, users’ search trends and intentions can be quickly and easily obtained, and this information then can correctly predict tourists’ demands and travel itineraries, as well as strengthen the quality of tourism services. In terms of web content design, it is possible to increase the accuracy of keyword searches and allow previous tourists to assist in marketing through experience sharing. This is the best way for the industry to promote tourism. Such an approach can increase international tourist inflows and improve the quality and prosperity of the tourism industry. It also provides the greatest benefit to information users.
Note:
1. Log values of data series N, CPI, ER, TPGDP, and TCPI, level values of NEWS and WBSITE, are used from January, 2008 to December, 2016.
2. DER, DTPGDP, and DTCPI stand for differenced variables after taking log values.
3. ***,**, and * represent the null hypothesis, rejected at the 1%, 5%, and 10% significance levels, respectively.
4. Method: Cross-section with fixed effect and cross-section weights’ covariance in Panel A.
5. Method: Cross-section with fixed effect and robust, corrected, standard error covariance in Panel B.