
1. INTRODUCTION / Uvod
Vessel performance, the caliber of the crew, the environment, management issues, etc., all have an impact on the complicated system of waterways in Vietnam. Waterway accidents can cause significant financial losses, casualties, and environmental damage. It is therefore essential to evaluate how safe the waterway traffic is. High-speed passenger vessels, integrated river and ocean-going vessels, container ships, and oil tankers are among the vessels that must now have AIS and VHF on board [1-2]. One of the main issues for the shipping industry, as well as for the security and economy of the entire globe, and Vietnam in particular, is vessel navigation. Some critical points and buoys in navigational channels are tagged with fake AIS signals for easy identification in crowded regions, i.e. in locations with high vessel traffic, particularly in places where navigation infrastructure is not adequately developed to fulfill the demands of the sea. The maritime traffic is a real challenge to handle with the increasing demand. The system for effectively gathering, integrating, and analyzing data relates to marine navigation. By using historical data mining approaches [3–4], the fundamental issues of anticipating vessel traffic situations along navigational channels were resolved. A prototype system is validated with the suggested fixes. The experimental findings demonstrate the viability and efficacy of the suggested techniques and use in practice. The recommendations for appropriate methods use historical data sources of AIS [5].
Ship classes are becoming complex sensors as the digital revolution of the maritime industry continues to grow to support more energy-efficient marine and vessel operations and to meet the challenges of new legislation. The result of the combination of modern communication systems and advanced sensor technologies is significantly improved vessel connectivity, which allows for the collection and analysis of a large amount of operational data. Specifically, the synchronization and analysis of data from various sources will undoubtedly speed up decision-making for operators and improve vessel performance management in critical areas including energy and fuel management, emissions control, machinery and equipment monitoring, and route optimization. Thus, data mining will benefit the shipping sector by providing fresh insights and added value to improve decision-making, asset tracking, and fleet-wide optimal application, which is the main purpose of this study. With the aim to present a framework for analyzing historical vessel data in order to predict traffic conditions in the channels where real-time data collection is insufficient in certain areas, the main contributions of this work are as follows:
Presenting a solution to collect, integrate, and analyze data related to maritime traffic, then estimate the traffic status. The proposal is suitable for each navigational channel, thus increasing the accuracy and usefulness of the management information.
Suggesting a Maritime Traffic State Prediction (MTSP) model that aims to help improve management systems and applications. We determine historical maritime traffic data from AIS for vessel kinematic information with MMSI vessel codes.
Proposing the MTSP model based on Long Short-Term Memory (LSTM) Networks to predict the route of vessels in navigational channels in case of real-time data collection failure or discrete data loss. The evaluation results, which used the developed prototype and the collected data sources, were thoroughly analyzed to confirm the feasibility and effectiveness of the proposed methods.
The rest of the paper is organized as follows: Section 2 describes an overview of the relevant contents; The related knowledge and problem formulation with the MTSP model based on LSTM network is covered in Section 3; Section 4 describes the results and evaluation of testing process. Finally, conclusions and a potential research direction for the study in the future are presented in Section 5.
2. RELATED RESEARCH / Srodna istraživanja
2.1. Overview of maritime data mining connected to classification and analysis algorithms / Pregled rudarenja podataka u pomorstvu povezanih s algoritmima klasifikacije i analize
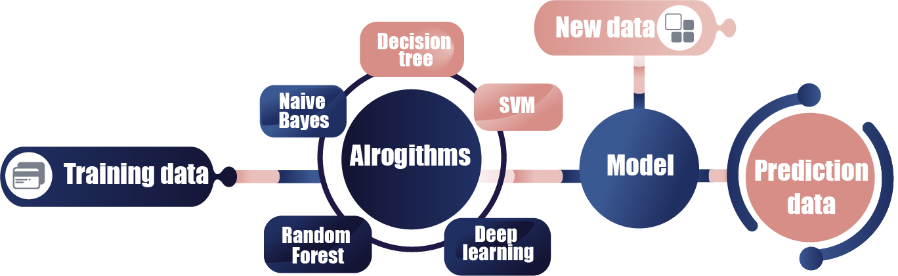
Figure 1 Maritime traffic state prediction system
Slika 1. Sustav za predviđanje stanja pomorskog prometa
In maritime big data management, marine data is categorised into one or more given classes using classification models. These models are trained on a historical dataset with labels [6]. Assigning labels to data items is the process of classification. The goal of the classification challenge is to identify a variety model that allows the determination of the class to which the latest information belongs. In this section, we examine some modern analysis and application methods for processing maritime big data [6-19] as follows:
Decision Tree Algorithm: A hierarchical category graph used in classification is called a decision tree, which is based on a series of rules and is a popular tool for data mining and classification, e.g. fuzzy-rough decision trees to learn about the behavior of vessel types [6]. The decision tree has the following classification model: First, the internal node is used for testing on an attribute; Second, the leaf node uses a label/description of a class label; And last but not least, the Branch from an internal node with the result of a test on the corresponding attribute.
Naive Bayes Algorithm: Bayes' Theorem is a mathematical theorem that calculates the probability of the occurrence of a random event A given that the related event B has occurred. Naive Bayes Classification (NBC) is the algorithm based on probability calculation applying the Bayes theorem. This algorithm belongs to the Supervised Learning group and is an example of using Bayesian Networks from AIS data [7].
Support Vector Machine Algorithm : Support Vector Machine (SVM) is an algorithm that belongs to the Supervised Learning group that is used to divide classification data into separate groups [8-9]. Imagine we have a dataset consisting of blue and red points placed on the same plane. What about more complex datasets that cannot find a straight line to divide? We need to use an algorithm to map that data set into more dimensional space ( n dimensions), thereby finding a hyperplane to divide [10-11]. Here, the author only introduces the SVM algorithm but does not go into it.
Random Forest Algorithm: Random Forest (RF) is a set of ensemble models. The Random Forest model is very effective for classification problems because it mobilizes hundreds of smaller internal models with different rules at the same time to make the final decision [12]. The unit of RF is the decision tree algorithm, in the number of hundreds. Each decision tree is randomly generated from resampling (bootstrap, random sampling) and using only a small set of random features (random features), from all the variables in the data. In the final state, the RF model usually works very accurately, but in return, it is impossible to understand the working mechanism inside the model because the structure is too complicated.
Deep learning Algorithm: The Long Short-Term Memory (LSTM) network consists of memory blocks, each containing a cell state and three gates [18-19] including the input gate (controls how the input can change the cell state), the output port (sets which part of the cell state to output), and the forged gate (decides how much memory to keep).
Remark 1: Maritime data is collected from many different sources and does not have integrated links. Therefore, it is necessary to develop an integrated management system to improve the efficiency of data exploitation to support maritime safety, such as predicting the possibility of collisions and monitoring vessel mooring wharves.
2.2. Specific time-series data based AIS / Specifični AIS temeljen na vremenskim serijama podataka
In particular, the vessel kinematic information, including latitude (lat), longitude (lon), speed over ground (SOG), and course over ground (COG), plays a critical role in evaluating optimal navigation routes, and predicting the future path of a vessel over specific time-series data based on relevant historical data requires analyzing an array of AIS data [13]. It is denoted by equations (1), (2), (3) [14-15]
(1)
The vessel's historical path (The original AIS data for the MMSI vessel, code of 525100764, expressed by Southern Vietnam Maritime Safety Corporation), which is expressed in Table 1, is represented by a sequence of observation points , where < if . Therefore, it is necessary to carry equally sampled observed data to obtain a series of as follows:
(2)
The process of encoding complicated vessel motion data in this space feature poses a significant challenge. Therefore, the solution used is to expand the feature space by one higher dimension. The "four-hot" representation vector is used to separate lat, lon, SOG, and COG data into and bins [16], respectively. The vector is expressed by
(3)
Table 1 The original AIS data sample for the MMSI vessel code of 525100764
Tablica 1. Izvorni uzorak AIS podataka za MMSI brodski kod 525100764
Remark 2: Depending on the weather and traffic, different features of vessels traveling along the comparable route will be observed. In case of dealing with large inertia vessels, and complex propulsion systems, it is necessary to predict the safe routes.
3. PROBLEM FORMULATION AND METHODS / Definiranje problema i metode
3.1. Dynamic visualization of the vessel movement tracks in Vungtau port / Dinamička vizualizacija putanja kretanja plovila u luci Vungtau
Nowadays, vessels are becoming complex sensors concentrated as the maritime industry's digital revolution gathers increasing volume to support more energy-efficient marine and vessel operations and support handling the challenges of new legislation. The result of the combination of modern communication systems and advanced sensor technologies is significantly improved vessel connectivity, which allows for the collection and analysis of a large amount of operational data. Specifically, the synchronization and analysis of data from various sources will undoubtedly speed up decision-making for operators and improve vessel performance management in critical areas including energy and fuel management, emissions control, machinery and equipment monitoring [17], and route optimization. Thus, data mining will benefit the shipping sector by providing fresh insights and added value to support improved decision-making, asset tracking, predicting, and fleet-wide optimal application. The methodology used in this study focused on mining maritime traffic from historical vessel data, and consists of two stages: data collection and classification in the first stage, together with the required measurement metrics; analysis, and prediction of marine traffic states using tools or algorithms in the second stage.
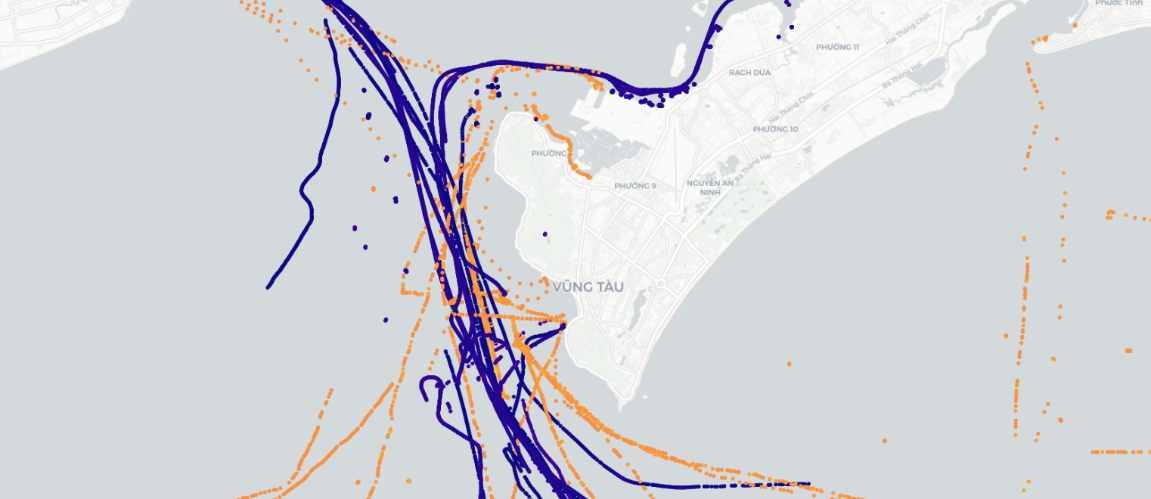
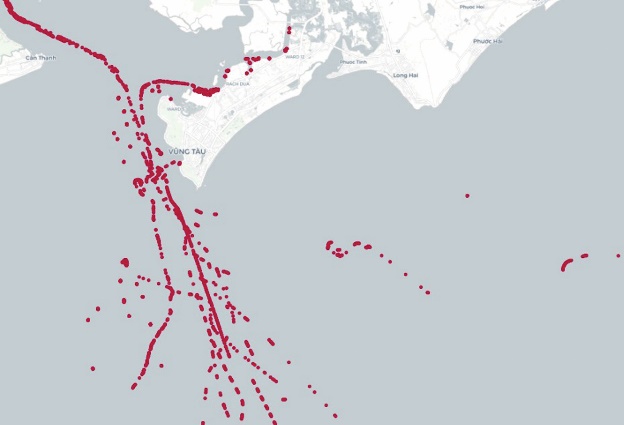
Figure 2 Dynamic visualization of the vessel movement tracks in Vungtau port
Slika 2. Dinamička vizualizacija putanja kretanja plovila u luci Vungtau
Maritime traffic-related data is collected from various sources from existing fixed monitoring systems. As we know, static data, dynamic data, and auxiliary data are three types of data, based on the sample of data collection types. One of the sample data used in this paper is described in Table 2. For clarity, we used sample data of dense maps visualized for July 27, 2019, and Fig. 2 shows the dynamic visualization of the vessel movement in Vietnam's southern region. Obviously, the more data is collected, the greater the chances that the system will estimate traffic conditions timely and accurately. To be more precise, we use the vessel's dynamic visualization to estimate traffic circumstances almost in real-time. This allows us to provide suitable models for managing and predicting maritime traffic conditions, even when data segments are missing.
Table 2 Classification of data collection
Tablica 2. Klasifikacija prikupljanja podataka
Visualizing the initially collected AIS data helps the authors take an overview of the collected dataset. Consequently, the data preprocessing avoids missing data, which leads to the loss of the crucial features of the dataset. The authors determine the coordinate area in order to extract suitable data for the evaluation process based on the data visualization. In addition, data fields (such as ship name, call sign, and band) that do not affect the goals of training the prediction model are removed in order to increase processing speed. In this study, the visualization data array focuses on vessels with continuous paths and docking in the coastal area of Vung Tau City, with features of type and MMSI identifier and vessel dynamic data (lat, lon, SOG, and COG).
The labeled data, which expressed the Fairway Maritime Traffic (FM-Traffic), may be used for prediction models in data mining techniques. The model assesses the FM-Traffic and channel conditions where time-series data is not available due to previous vessel data. Fig. 2 depicts the suggested structure for the marine traffic state prediction model, which is summerized as follows:
Step 1 – Summarizing dynamic data: This step conducts data pre-processing and labeling following the FM-Traffic, i.e., labels are in the set of (tag block times, lon, lat, SOG, COG, heading). As shown at the beginning of this section, the traffic conditions, including FM-Traffic, are already available in the historical vessel data. Concretely, the FM-Traffic can be calculated directly from velocity extracted from historical vessel data, or it could be the output of this data mining model (ref. Step 3);
Step 2 – Proposing the MTPS model: As discussed, suitable mining data are named based on historical vessel data (i.e., the MF-Traffic data for the traffic conditions). The system becomes an experiment by applying deep learning algorithms;
Step 3 - The DL algorithm proposal: The maritime traffic state prediction model proposed in Step 2 is applied to analyze the actual data to determine the label/FM-Traffic considering real-time data loss or discrete data loss.
Upon obtaining the above-described generic structure (Fig. 1), we need to establish the most important data to efficiently train the model. The fact that the traffic in each channel differs and changes regularly is one of the problems here. For the spatial path, we divide the route network into channels based on the ENC, where each channel is short enough to take into account that the variance of traffic conditions at any location in a channel can be ignored. In terms of time, we divide the time into time frames based on which the collected data is integrated and analyzed. Following the data separation method mentioned above, this model is quite weightless and yet possible in practice. This basic format is simple enough that it can be collected and integrated with any device that uses VHF frequencies, as presented in our previous work [25].
3.2. Management integration system / Integracijski sustav upravljanja
The management system consists of four main components, namely the API server, the application, the computing server, and the database server, as shown in Fig. 3 below:
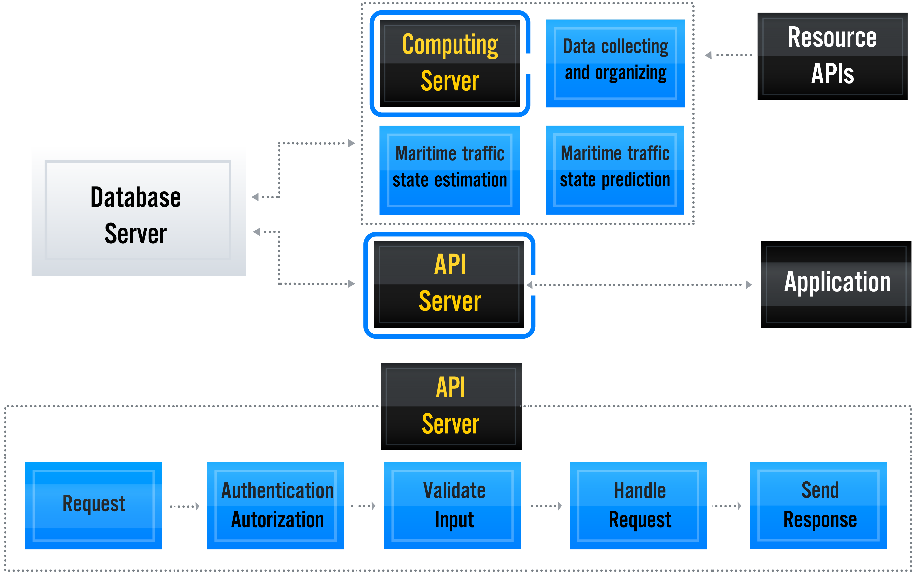
Figure 3 Structure of the management system
Slika 3. Struktura sustava upravljanja
API server: The core component of the system is the server, which processes user requests. The server is established in NodeJS – an open-source, cross-platform framework. When users request the application, the data is retrieved from the database, processed, and then sent back to the users. The request life cycle includes receiving and identifying user requests, validating data, and processing requests.
Computing server: The computing server processes the data submitted by users or the AIS. Hence, the computing server performs calculations to return the speed corresponding to the vessel’s navigation status on the application map. At the end of each cycle, the Computing Server will update the user's speed and reputation score. If for some routes there is no enough data to calculate the speed, the computing server will refer to other data sources from resource APIs to ensure that the vessel's navigational status is always fully displayed. Moreover, the directory structure of the computing server is almost identical to the directory structure of the API Server. The computing server only computes and stores data, while the API server defines the endpoint access points.
Database server: The database server has the task to store data from the AIS identifying information system and process and compute data on the system. As this is a real-time system with big data, the database must have the following features: easy access to vast information; the need for a geospatial database for the navigation system; and confidentiality to protect the vessel’s data.
Application: This application is expressed on an online platform that handles communication with users. The program allows users to view the status of vessels. Additionally, the application is responsible for determining the vessel's route and collecting data for communication with the API server.
The system is architecturally constructed in a modular form with great flexibility, which enables scale growth with sensor stations (AIS, HMIS, etc.) and working positions (operation desk, training desk). At the same time, the system enables information-sharing interfaces with traffic management centers. Moreover, the system provides features suitable for each task defined based on the primary purpose of the user, including AIS subsystem, VHF, MIS, ENC, and Hydrometeorological data [24-25]. In conclusion, the general description of the system components demonstrates the relationship between the system utilization and each function, but in this study we focus on improving the application to support maritime safety.
3.3. Maritime traffic state prediction model based on LSTM network / Model predviđanja stanja pomorskog prometa temeljen na LSTM mreži
In the past ten years, concerns about maritime traffic safety and security have become evident due to the difficulties created by the increasing demand for additional vessels with greater capacity and velocity. To ensure the navigational safety, prevent collisions, and improve the effectiveness of vessel management, predicting the trajectory of vessels is essential. A relatively recent development for complex geographic applications is the addition of effective machine learning technologies to accurately predict trajectories. However, the complexity of the maritime environment and issues with data quality, particularly in the Vietnam Sea Port, which has a high density of vessels, hinder the reliable vessel trajectory predictions. On the other hand, with the system structure selected in Figure 3, the input data is processed and analyzed numerically, stored in Resource APIs, and then aggregated and filtered, with the data fields being separated. Subsequently, the 04 data fields (lat, lon, SOG, COG) selected for the prediction model are also the input data of the Maritime traffic state prediction model [25]. In addition, the MTSP model has not yet been implemented in any maritime management system in Vietnam, which motivates us to propose a solution based on the support of Deep Learning to provide the system with the following superior features. In this study, we suggest the MTSP model based on the LSTM network (LSTM is one of the deep learning algorithms as mentioned) to evaluate suitable paths for vessels along routes and experiments established on data collected from the AIS system through Resource APIs provided by Southern Vietnam Maritime Safety Corporation. The proposed model used for analyzing maritime traffic data has the following characteristics:
Highly accurate dynamic data analysis results due to direct processing in time-serial format with quick feature extraction;
Standardized time-serial data sets with maritime traffic data collection systems facilitate the development of MTSP models;
The LSTM algorithm has a 3-gate structure that enables the processing of multi-layered data feedback. This allows the algorithm to extract deeper data features than the normal RNN algorithm [26].
The LSTM network sequentially computes the input vessel path data string with the hidden vector , in which the memory cell corresponding to the input vector (at the current time step ) and the hidden state (at the previous time step ) update the hidden state inside expressed by [20]
(4)
where represents the element product, describes the sigmoid function, and is the hyperbolic tangent function. Besides, and indicate the input gate, forget gate, and output gate, respectively. We get, and express the cell input activation vector and cell state, defined as follows:
(5)
The input weight matrices are represented by and , with being the bias terms. The weight matrix subscript indicates the input-output connection. is the implicit forgetting gate matrix, and is the input-forgetting matrix. The encoder codes the vessel's kinematic state sequence one state at a time into a hidden state sequence. We employ an encoder-decoder architecture to solve the prediction problem of mapping one data sequence to another, specifically defining the mapping function . The initial encoding function is represented by [20]
(6)
where is the neural network parametrized by that maps input sequence to an internal representation data sequence . Each hidden state combines bidirectional recurrent neural network (RNN) with a state of size .
The encoder layer computes the representation of the input sequence, which created the context representation by the aggregation function. The decoder repeatedly uses this context representation to generate the output prediction. We use the average pooling over time (AVG) to reduce the sequence to a single context vector as
, (7)
for computing the mean value of each hidden unit. Each context feature is defined as
(8)
The symbol represents the parameterization of the autoregressive decoder function to predict the future vessel path at each period with the previous state as follows [21]:
(9)
where denotes the RNN hidden state with being the planning descriptor and being the context vector. Finally, the output prediction response of length is given by
(10)
To evaluate the quality of the prediction model response, the authors employ the root-mean-square-error (RMSE) [22-23] method to estimate the average error value of the squares between the predicted path and the actual path , which is defined as
(11)
LSTMs initially tried to replicate human decision-making by utilizing machines to process large quantities of data. Advanced LSTM systems introduce autonomous vessels, which can operate independently without human intervention and have a lower mistake rate than human-operated vessels. Deep learning is gradually altering the maritime industry's traditional operational processes, especially in mining maritime traffic from vessel data as mentioned in this paper.
4. RESULTS AND EVALUATIONS / Rezultati i procjene
4.1. LSTM network / LSTM mreža
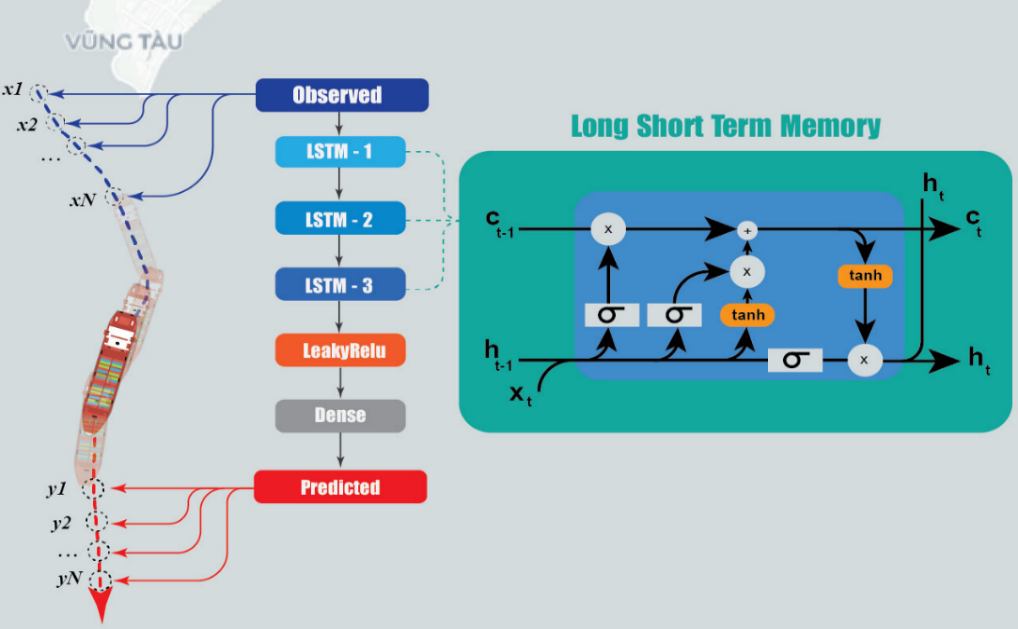
Figure 4 MTSP model based on LSTM network
Slika 4. MTSP model temeljen na LSTM mreži
In this work, we use an encoder-decoder architecture to implement an input-output mapping function to predict future pathways. Based on a sequence of monitored states and past data describing the relative path of the vessel, the LSTM neural network architecture consists of three main phases: encoder, aggregation function, and decoder illustrated in the vessel path prediction in Fig.4. Therefore, to predict the safe path of a vessel in the selected case study, we built the proposed MTSP model based on the LSTM network, which includes the following steps:
Step 1: Synthesizing decoded AIS data in the standard format *.CSV;
Step 2: The preprocessing of the dataset removes error components during collection and arranges data over time;
Step 3: Implementing visualization of the initial dataset to verify the characteristics of maritime vehicle paths;
Step 4: Setting the dataset into a training and a validation set in a ratio of 8:2 using values in Table 1;
Step 5: Standardizing and extracting features of the data set, starting with equation (1);
Step 6: Training the prediction model by applying the LSTM algorithm for 50 epochs and evaluating the model's response using the optimal function (11);
Step 7: Testing the MTSP model (Fig. 4) using historical data extracted from the VungTau seaport of the Southern Vietnam.
This study employed the LSTM network to develop the path prediction model, executed in Python 3.6. The activity results are shown in Fig. 5, the setting up for 50 epochs training using a learning rate of 0.0005.
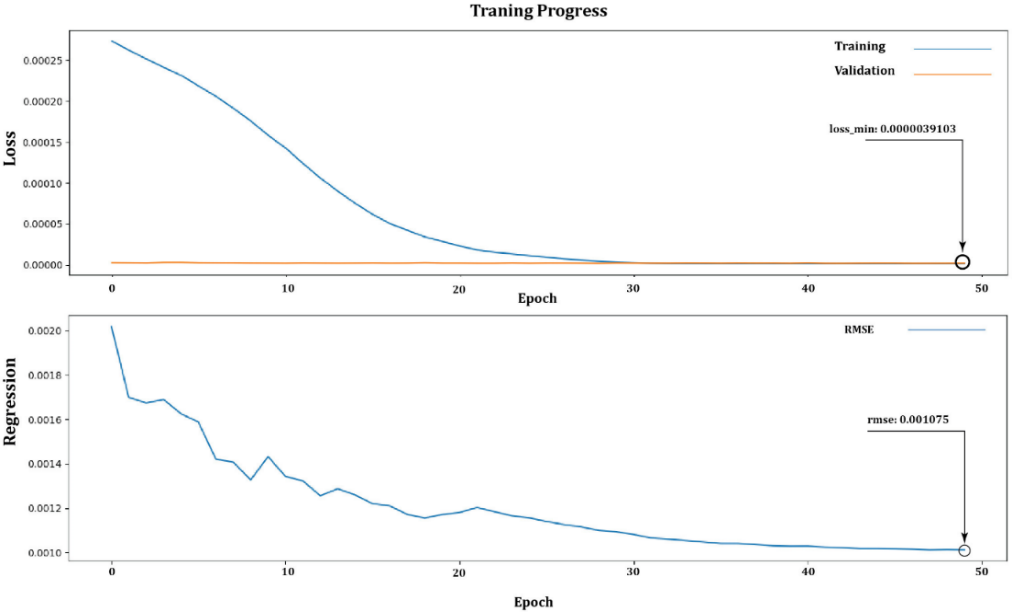
Figure 5 The regression and loss of LSTM network training process
Slika 5. Regresija i gubitak procesa testiranja LSTM mreže
4.2. Case study experimental results / Eksperimentalni rezultati studije slučaja
The optimal values including regression value attained 0.001075 in training, and the loss value reaches 0.0000039103. Besides, a set of historical vessel data from the AIS system is used as input data for the training prediction model to provide a safety path, as shown in Fig. 6. Thus, Fig. 6a illustrates the route taken by a vessel while departing from the wharf and moving towards the sea with the MMSI code 636018224 (indicated by the light-red line). Similarly, the blue line in the figure shows the path followed by the vessel while arriving from the sea to the wharf with the MMSI code 574999621. Finally, the dataset for the same type of vessel visualizing the maritime traffic conditions in VungTau port is indicated in Fig. 6b with vessels Type-1 (on the left side) and Type-3 (on the right side). Finally, the case study experimental results are shown in detail in Fig. 7, the predicted path of the vessel (red line) tracking follows the historical path (blue line) of this vessel.
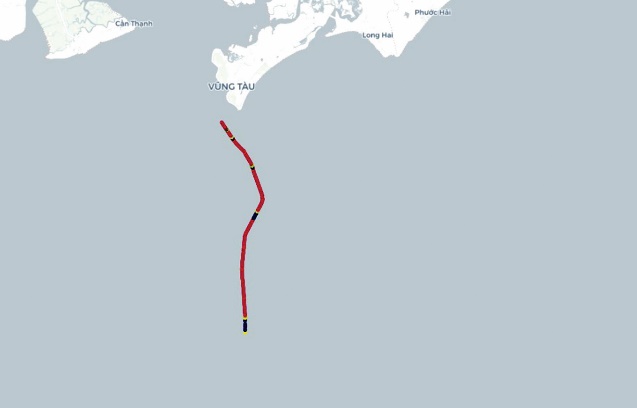
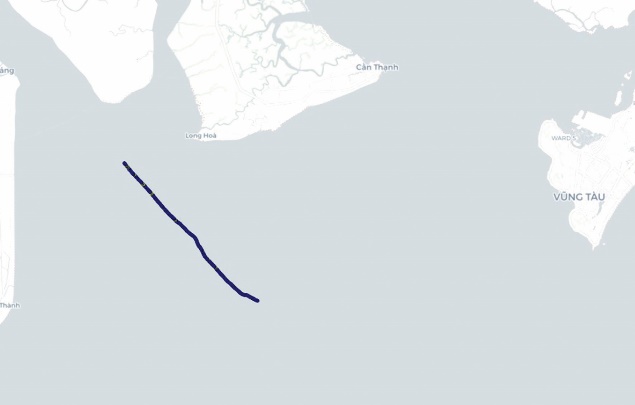
a) The visualization samples of the historical vessel path visited (blue line) – exit (red line) from Vungtau Port ( based on AIS Data in 2019) / Uzorci vizualizacije povijesne putanje plovila (plava linija) – izlaz (crvena linija) luke Vungtau (na temelju AIS podataka 2019.)
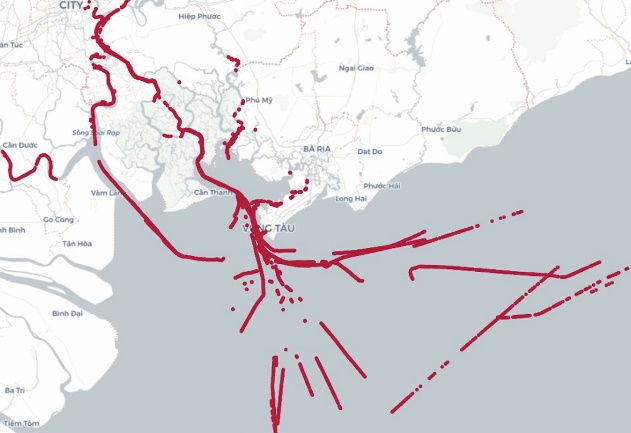
b) The visualizing sample sets of historical AIS data from vessels / Vizualizacija skupova uzoraka povijesnih AIS podataka s plovila
Figure 6 Input data for the creation of a model to predict the path of a vessel in Vietnam's southern sea region
Slika 6. Ulazni podaci za izradu modela za predviđanje putanje plovila u južnom morskom području Vijetnama
The proposed model was tested for the cargo vessel traveling channel coming at VIETSOVPETRO wharf, where there is a complicated traffic situation with many vessel types. Based on historical data (blue line) of the same type moving along the channel, the LSTM prediction model extracts a safe path (red line) for the vessel to move in case of docking at the wharf. The case study experimental results are shown in detail in Fig. 7.
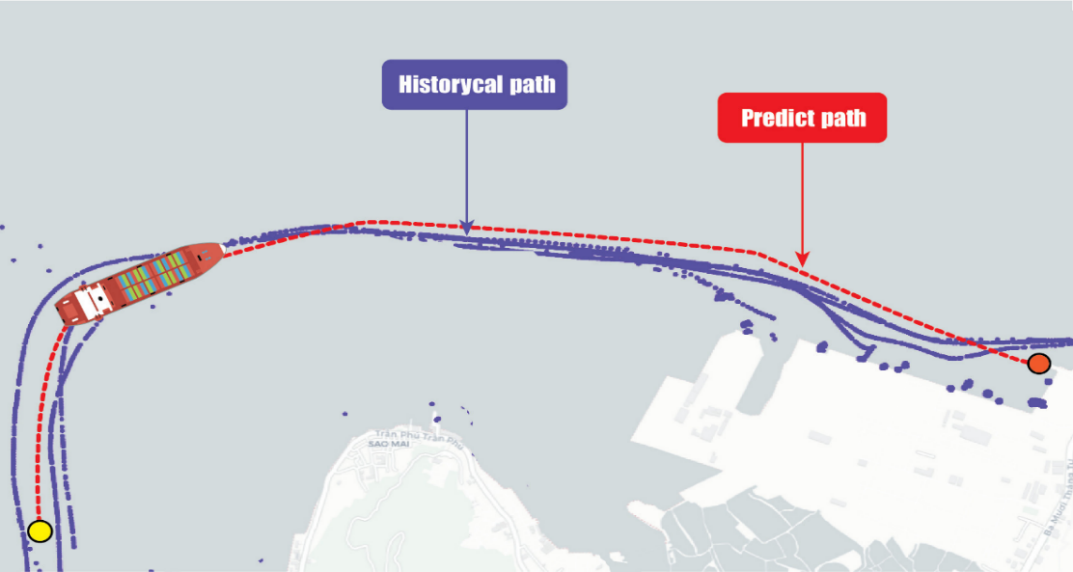
Figure 7 Predicted vessel path for arrival at VIETSOVPETRO wharfs in southern Vietnam
Slika 7. Predviđena putanja plovila za dolazak na VIETSOVPETRO pristanište u južnom Vijetnamu
4.3. Evaluations / Procjene
In general, the system displays marine traffic data calculation and updating and indicates adequate reaction times with initial operation at Vungtau Port, Vietnam. Tests were carried out on using the proposed model from the collected and distributed traffic data as well as obtaining traffic information from the AIS system. The results (Figure 6 and Figure 7) outline the management integration system, which, once implemented, will enhance the operational efficiency of the region's specialist maritime management. The system serves the common benefit of the community and guarantees national security and defense in terms of financial efficiency. Therefore, determining its effectiveness is difficult. However, from a socioeconomic standpoint, the initiative has the following consequences:
Support for Maritime management system includes monitoring navigation in narrow channel locations, anchorage positions, berthing, and leaving the wharf;
Support for maritime activity monitoring and management, tracking vessel position, the direction of movement, and speed of vessels.
In the future, the model can develop new application features in ensuring maritime safety by predicting the possibility of collision, predicting the risk of running aground, determining the closest point of approach, monitoring cargo anchorage locations, monitoring and indicating current vessel status to reduce risks to vessel, property, and people, as well as environmental pollution hazards. The advanced and modern technologies in state management methods can be used to increase the attractiveness and competitiveness of the seaport system. In addition, it actively contributes to the gradual perfection of specialized management in the maritime sector through international conventions to which Vietnam is a signatory. To this end, the concerns highlighted in Remark 1 have been addressed and the issues thus resolved.
5. CONCLUSION / Zaključak
This paper presents several algorithms, including Decision Tree, Naive Bayes, Random Forest, and selected LSTM to specify which model is most appropriate. We determine a new approach to predict vessel traffic conditions in navigational channels based on historical data from the AIS identification information system. We provided a framework for efficient collection, integration, and analysis of maritime traffic-related data to provide an accurate and timely status estimation. In addition, the problem of lack of data in some areas of the navigation channel is still one of the major challenges, and solving it by data mining method based on collected historical data is the solution. The recommended deep neural network algorithm can easily be integrated into a program that runs on a computer or web application to facilitate the mining of historical vessel data for marine traffic and is ready to be used through the application. In conclusion, synchronizing and improving maritime traffic is an issue that needs to be addressed, and this is a potential research direction for the study in the future.
Author Contributions: Xuan-Kien Dang: Conceptualization, Methodology, writing – review and editing; Tuan-Anh Pham: Data curation, formal analysis, numerical data calculation; Žarko Koboević: Review and editing; Viet-Dung Do: Data curation and computing, writing - original draft preparation. Thi-Duyen Anh Pham: Review and English editing.
Conflict of interest: The authors state that there is no conflict of interest.
Acknowledgement: The authors would like to thank the Artificial Intelligent Transportation LAB, the Ho Chi Minh City University of Transport and Maritime Department, University of Dubrovnik, Croatia for providing facilities and scientific and technical support.