
INTRODUCTION
The experiencing of food and beverages is integral in tourism for both the tourists and the destination (Torres 2002;Lin et al. 2011). In the United Kingdom (UK), culinary tourism is estimated to be worth $8 billion each year (Manolis 2010). In South Africa, it is estimated that foreign tourists spent R2,5 billion on food in 2016 (South African Tourism 2017). This amounts to 14,45% of the total amount international tourists spent while in the country (South African Tourism 2017), and highlights the importance of tourists’ culinary satisfaction and preferences to the national economy.
Culinary preference is a term that assumes that at least two different items are available, and a decision is made to choose one item over another (Rozin and Vollmecke 1986). There is a general scarcity of studies that examine culinary tourism and the culinary preferences of tourists (Torres 2002;Cohen and Avieli 2004;Ignatov and Smith 2006;Chang et al. 2010;Williams et al. 2014). Many questions therefore beg an answer, including what the level of culinary satisfaction of international tourists is, and what the relationship between the importance of culinary-preference themes and the culinary satisfaction of international tourists to South Africa is.
In-depth knowledge of the determinants of tourists’ culinary preferences could make an important contribution to the economy and the development of quality culinary-tourism services and products that lead to satisfaction (Fields 2002;Mak et al. 2012). Satisfaction arises when tourists’ expectations are met (Ryan 1994) and is dependent of the tourists’ expectations before visiting, relating to their actual experience at the destination (Fields 2002). It is the tourists’ satisfaction that, in turn, results in benefits for destinations and tourism stakeholders.
1. LITERATURE REVIEW
Governments and tourism organisations should take more interest in developing the local food sector (Stanley and Stanley 2015).Okumus and Cetin (2015) state that the use of local food in destination marketing has gone unnoticed. On a positive note, countries such as France, Italy, Taiwan and Thailand have demonstrated the potential of culinary tourism. These countries have actively promoted local food, which has resulted in local food becoming a distinct market segment, a supplement to other tourist attractions and a point of differentiation from other countries (Abraham and Kannan 2015). Many destinations now use food, beverages and culinary experiences as attractions (Robinson and Getz 2014).
South Africa, however, has almost completely ignored culinary tourism and its potential (Singh and Bhoola 2016). To further grasp the importance of promoting culinary experiences in the South African tourism context, the National Tourism Sector Strategy (NTSS) objectives must be considered. The NTSS is the National Department of Tourism’s strategy for the tourism sector of South Africa. The following two NTSS objectives relate to the current study: “Diversify and enhance tourism product offerings”, and “Improve tourism skills and service excellence” (National Department of Tourism 2017, 27 and 30). In the quest to attain the two above-mentioned objectives, international tourists’ culinary preferences become a critical point of interest.
1.1. Culinary preferences
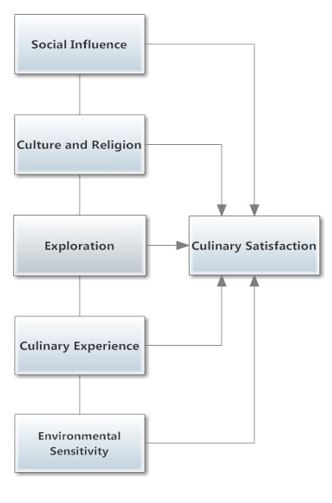
The literature reveals a number of possible determinants of tourists’ culinary preferences. Main culinary-preference themes include social influence, culture and religion, exploration, the culinary experience and environmental sensitivity.
Social influence is an important issue. The tasting of food is an opportunity to meet with family and others (Su 2015). Socialising and togetherness enrich tourists’ experiences and are desirable while travelling.Kim et al. (2009) andKim and Eves (2012) state that this theme reveals that food has a role in ego enhancement and self-satisfaction. “Eating in the ‘right’ restaurant and being seen to eat there has always been an important means of drawing status distinctions”, saysFields (2002, 39 and 40). Reference groups have also been found to be influential in culinary-travel decisions (Sparks 2007), as have ratings on travelogues such as TripAdvisor, which has 340 million users and four million listed restaurants (Smith 2016).
International tourists in Ghana reported concern regarding a lack of information available to identify assorted local foods, suspicion of being cheated, and difficulty in ordering local foods, causing them to avoid these foods (Amuquandoh 2011). This can be remedied with better use of internet marketing resources and by using a wide range of communication tools (Sánchez-Cañizares and López-Guzmán 2012;Stanley and Stanley 2015). Communicationis a frequent cause of tourists avoiding local culinary establishments, even if they wish to visit them (Cohen and Avieli 2004;Abraham and Kannan 2015).
The second culinary-preference theme is culture and religion. Authors have often documented that culinary preferences are influenced by cultural dislikes for certain foods and dietary laws in religion (Steptoe et al. 1995;Chang et al. 2010;Horng and Tsai 2010;Amuquandoh 2011;Falguera et al. 2012;Mak et al. 2012). What is considered unacceptable food in one culture may be considered delicious in another culture. For example, raw fish is enjoyed by most Japanese, but is considered unhealthy by most Chinese (Su 2015). In Thailand and Japan, seafood is considered vegetarian (Horng and Tsai 2010), while vegetarians from other countries may refuse to eat it. Similarly, Israelis departing for Asia are commonly concerned that they may not find anything they are willing to eat there. Some of them even take along basic foodstuffs, such as instant meals and crackers. A number of these concerns and precautions are attributed to culturally unacceptable food such as cat, dog and reptile meat, as well as the Jewish dietary laws known as Kashrut or kosher (Cohen and Avieli 2004). Learning about the cultural and religious differences in tourists’ eating habits could assist in improving food service and the customer satisfaction of tourists (Quan and Wang 2004).
Exploration emerges as the third culinary-preference theme. The need forself-development may ultimately influence tourists’ culinary preferences. Research indicates that “foodies” want to be educated when travelling (Baruah 2016). Cooking classes and trade shows in tourist destinations give tourists the opportunity to be creative and better themselves (Tikkanen 2007;Daniel et al. 2011).
Armed with the latest guidebooks, some tourists are on the lookout for the trendiest destinations to explore (Croce and Perri 2010). Trends such as craft beer and garage wine may also be of importance to tourists wanting to explore new horizons. Craft beer was first produced in the seventies, and is now being sold by thousands and consumed by millions (Aquilani et al. 2015;Elzinga et al. 2015). It has been found that the opinion on craft beer differs across cultures (Gómez-Corona et al. 2016), and that most beer consumers who have tasted craft beer consider it to be of a higher quality than commercial beers (Aquilani et al. 2015). Concerning garage wines, many believe that it was a fad and that the style is not very fashionable any longer (Decanter 2007). Nevertheless, a fair number of garage-wine enthusiasts remain (Ronco 2015).
The fourth culinary-preference theme is the culinary experience. Tourists are increasingly rejecting low-cost, mass-produced food, opting for local, fresh food that reflects the authenticity of the destination and the local culture (Burusnukul et al. 2011;Barcelona Field Studies Centre 2015;Su 2015). Eating local food for the first time has been found to be a really exciting experience (Kim et al. 2009), and ultimately, finding that “hidden” local restaurant is the goal of many tourists (Fields 2002).
When choosing a restaurant, the location is important (Restaurant Engine 2015;Argyle 2016), as is the child-friendliness to tourists with children. Families spend a significant amount of money on dining out (White Hutchinson 2007;McDonald 2014), and children have been found to be moderately influential when restaurants are chosen (Chen et al. 2013).
The fifth and final theme is environmental sensitivity. Environmental sustainability and an aversion to food containing possibly harmful additives is demonstrated increasingly in society (Steptoe et al. 1995;Ottman 2017). Organic products have been claimed to be more respectful to the environment than conventional products, but objective analyses of the environmental benefits of organic farming are not as clear (Falguera et al. 2012).Napolitano et al. (2013) also found that consumers prefer organic items to conventional items because of the potential positive effects of organic farming on product safety and quality. However, consumers did not have a preference between organic and conventional items when the decision was based purely on a blind tasting.
This demonstrates the positive impact of information regarding organic farming techniques, including higher levels of animal welfare, a lower impact on the environment and product safety. The price difference between organic or functional foods and their conventional counterparts is often too great for consumers to change their food-consumption habits. Many consumers are, however, willing to pay more for animal-welfare-oriented production than for organic production (Steptoe et al. 1995;De Jonge et al. 2015).
1.2. Culinary satisfaction
A major benefit that could be derived from the critical assessment of the culinary preferences of tourists is culinary satisfaction (Ryan 1994;Quan and Wang 2004;Mak et al. 2012;Andersen and Hyldig 2015;Lagerkvist et al. 2017). A universally accepted definition of satisfaction does not exist, but most definitions agree that level of satisfaction includes a goal the customer wants to achieve (Mason and Paggiaro 2012). For the purposes of this study, culinary satisfaction is defined as the fulfilment of the tourist’s culinary expectations.
Multiple factors have been found to influence culinary satisfaction (Andersen and Hyldig 2015;Lagerkvist et al. 2017). For example,Kim et al. (2009) andKim and Eves (2012) state that eating local food while travelling plays a role in self-satisfaction.Updhyay and Sharma (2014) similarly mention that stakeholders could emphasise localisation and traditional and historical significance in order to increase the patronage and satisfaction of foreign tourists in India.
In fact, cuisine can enhance the level of overall satisfaction experienced on a trip (Quan and Wang 2004;Mak et al. 2012).Sánchez-Cañizares and López-Guzmán (2012) found a significant correlation between satisfaction with food and satisfaction with a Spanish city, confirming that food holds considerable weight in how tourists perceive their overall trip. Because of the importance of culinary satisfaction and its testability among a tourist sample, it was the only benefit of culinary-preference knowledge focused on for this study. The literature review can thus be summarised as illustrated inFigure 1, with the five culinary-preference themes influencing culinary satisfaction.
2. METHODOLOGY
2.1. Questionnaire
The aim of the questionnaire used in this study was threefold. Firstly, the aim was to establish the determinants of the culinary preferences of international tourists to South Africa. Secondly, it was to determine the level of culinary satisfaction while in South Africa. Thirdly, it was to conclude the relationship between the determinants of culinary preference and culinary satisfaction. The newly developed, structured questionnaire was based on the literature review as well as on existing questionnaires (Torres 2002;McKercher et al. 2008;Amuquandoh 2011;Sánchez-Cañizares and López-Guzmán 2012;Chatibura 2015).
The questionnaire had three sections. Section A captured the respondents’ socio-demographic characteristics; Section B focused on the respondents’ culinary preferences; and Section C focused on the respondents’ culinary satisfaction while in South Africa. Section B required respondents to rate 32 items relating to their culinary preferences on a five-point scale to indicate their importance, ranging from “not at all important” (1) to “extremely important” (5). Eleven questions were asked in Section C regarding culinary satisfaction during this trip to South Africa. The answer categories from which respondents could choose for this section ranged from “very dissatisfied” (1) to “very satisfied” (5) on a five-point ordinal scale.
2.2. Sample and survey
Data collection took place from May 2016 to August 2016. The questionnaires were distributed at the busiest airport on the African continent (Writer 2016), with foreign departures of 2 327 439 people in 2015 (Statistics South Africa 2016). International tourists departing South Africa via O.R. Tambo International Airport were the study sample and the respondents were randomly approached to participate in the research. A sample of 600 respondents was initially targeted to ensure a representative sample. This far exceeds the recommended sample sizes of 384 (Krejcie and Morgan 1970) and 400 (Leedy and Ormrod 2014) for large populations.
2.3. Statistical analyses
Exploratory factor analysis (EFA), Spearman rank correlations and structural equation modelling (SEM) were utilised to analyse the data. Factor analysis was used to identify groups of highly interrelated culinary-preference and culinary-satisfaction determinants that reveal underlying themes (Leedy and Ormrod 2014). EFA was conducted in order to group the variables and to determine a factor structure for both the culinary-preference variables and the culinary-satisfaction variables. Since it was unknown how many factors were present, a confirmatory factor analysis could not be performed and the EFA was preferred. Benefits of factor analysis include that it is an effective method of ascertaining predominant patterns among variables and it presents data in a form that can be easily interpreted (Babbie 2013). A limited number of factors were preferred, compared to having 32 culinary-preference items in a conceptual model.
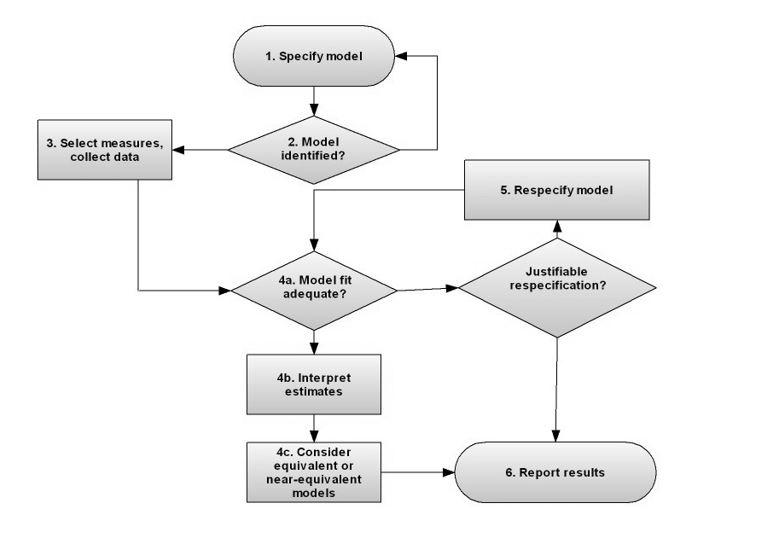
Spearman’s rank order correlation examines ranked variables and was therefore used to determine whether correlations exist between the culinary-preference and culinary-satisfaction factors (Kline 2016). The results from this statistical test were used to compare to the model developed through SEM. Lastly, SEM was used to empirically test the conceptual framework of tourists’ culinary preferences to determine whether it was valid (Malhorta et al. 2013;Leedy and Ormrod 2014). SEM therefore tested the relationship between culinary preference and culinary satisfaction. SEM has been defined as a theory-driven, data-analytical approach to evaluate the causal relationship between variables (Kruger et al. 2014). An advantage of this statistical modelling tool is that it makes use of multiple measures that avoid the risk of measure-specific error (Weston and Gore 2006).Kline (2016) explains SEM in six steps, as depicted inFigure 2. These steps will be elaborated on in the results.
3. RESULTS
In total, 627 questionnaires could be used for analysis and are reported on.
3.1. Socio-demographic, travel profile and culinary satisfaction
The sample was relatively young, as most of the respondents (78,66%) were under the age of 46 years. Almost half (49,28%) the respondents were from African countries. Additionally, the sample consisted of Americans (18,66%), Europeans (17,38%), Asians (10,53%) and Australians (2,39%). More men (58,49%) than women (41,51%) completed the questionnaire. Most of the respondents (75,12%) indicated that they held a university degree.
This was the first visit to South Africa for 43% of the respondents, and more than half the respondents (51,38%) stayed in the country for less than one week. Only 20,7% of the respondents indicated that they were in South Africa for leisure purposes. An equal percentage of the respondents (20,7%) stated that they were visiting friends or relatives, whereas 37,71% of the respondents were in South Africa for business.
Half (50,43%) the respondents displayed neophilic tendencies and chose to “always” try local cuisine. Food neophobia is a food-related personality trait that influences tourists’ food consumption (Mak et al. 2012). Neophobic individuals tend to avoid novel and unfamiliar food, while neophilic individuals are attracted to novel foods (Blichfeldt and Halkier 2014).Burusnukul et al. (2011) andMak et al. (2012) state that, based on this concept, persons commonly prefer foods with which they are familiar. Just over a third (36,35%) of the respondents indicated that they were neither neophilic nor neophobic, as they occasionally tried local cuisine, and 13,22% were neophobic, preferring cuisine they were used to.
When asked whether they were following any religious, health- or weight-related diets, 87,34% of the respondents stated that they were not. The 12,66% who were following diets were following a great variety of different diets for different reasons. The diets and reasons most frequently cited included vegetarian (25% of the respondents following a diet), halal (14,71%) and vegan (7,35%). Other noteworthy diets were low-carbohydrate (5,88%) and weight-loss diets (5,88%). It should be noted that the diet cited most often in this study, namely vegetarianism, made out only 2,76% of the total sample. This finding is curious, as there are an estimated 375 million vegetarians worldwide (Figus 2014).
Regarding their culinary satisfaction, respondents were highly satisfied with their overall culinary experience while in the country (mean = 4,112). Of all the culinary-satisfaction items, respondents were most satisfied with the affordability of cuisine in South Africa.
3.2. Testing the conceptual model
The number of questionnaires that formed part of the study (627) exceeds the requirement of 300 for SEM analysis (Tabachnick and Fidell 2001). For this analysis the 32 items in Section B and the 11 items in Section C of the questionnaire were used. SEM was used to empirically test the influence of the conceptual framework of culinary preferences on culinary satisfaction (Figure 1). The steps applied to conduct SEM as perKline’s (2016) sequence (seeFigure 2) are detailed next:
3.2.1. Step 1: Specify the model
Based on the literature review, the research hypotheses are expressed graphically as a conceptual model (this was done inFigure 1). Independent variables in SEM are referred to as exogenous variables, and the dependent variables are endogenous variables (Kline 2016). The exogenous variables were the culinary-preference factors (which include all the culinary-preference items listed in the literature review), and the endogenous variable was the culinary-satisfaction variable. Although it is stated in the conceptual model as one variable, it was determined through the EFA that there are three factors that comprise culinary satisfaction. The hypotheses to be tested through SEM are stated in Step 3, as these were determined after the EFA had been conducted. However, it can be noted here that it was hypothesised through the literature review that all the culinary-preference factors would have a direct relationship with culinary satisfaction.
A principal component analysis factor analysis with oblique rotation (Oblimin with Kaiser Normalisation) was undertaken for the culinary-preference and culinary-satisfaction factors (see Appendix). The Kaiser-Meyer-Olkin (KMO) measure of sampling adequacy was 0,886 for the culinary-preference factors, which is exceedingly acceptable according toField (2013), and indicates an adequate sample size for factor analysis. The Bartlett’s Test of Sphericity was also significant (p < 0,000). The factors were tested and all were found to be reliable. A five-factor solution for culinary preferences explained 60,74% of the variance. Each item was assigned to the factor on which it showed the strongest loading. Upon inspection of the item content, it was decided to name the five culinary-preference factors “social influence”, “culture and religion”, “exploration”, “the culinary experience” and “environmental sensitivity”. The item content was discussed in the literature review.
Similarly, the KMO measure of sampling adequacy for the culinary-satisfaction factor analysis was 0,802 and the Bartlett’s Test of Sphericity was significant (p < 0,000). A three-factor solution explained 61,83% of the variance. The Cronbach α for the eight factors ranged between 0,716 and 0,919, indicating a reliable measuring instrument (Maree and Pietersen 2007;Fink 2009). The three culinary-satisfaction factors were named “personal preference”, “affordability” and “dining environment”. The dining environment factorcontained items such as variety (factor loading of 0,825), quality (0,772), health and safety (0,561), menus indicating which items are local (0,620), the availability and quality of local cuisine (0,578), the level of service (0,442) and the overall culinary satisfaction (0,553). The affordability factorincluded value for money of food (-0,865) and beverages (-0,887), and the personal preferences factor included being able to follow your diet (0,856) and the preparation of food in terms of dietary requirements (0,796).
3.2.2. Step 2: Evaluate model identification
A model is said to be have been identified if it is theoretically possible for the statistical program to derive a distinctive estimation of each model parameter (Kline 2016). The model was identified and the subsequent steps could be proceeded with.
3.2.3. Step 3: Select the measures and collect, prepare, and screen the data
The measuring and data-collection techniques were discussed under Section 2.1. and Section 2.2. respectively. EFA resulted in five culinary-preference factors and three culinary-satisfaction factors. All 43 items in the questionnaire loaded onto the eight factors. The factors were tested and were all found to be reliable. Spearman’s rank correlations were used to test the correlations between the factors.
It was hypothesised through the literature review that all the culinary-preference variables would have a direct relationship with culinary satisfaction. The hypotheses, based on the factors, to be tested through the SEM are listed inTable 1.
3.2.4. Step 4: Estimate the model
SPSS® was used to analyse the data. The structural model compiled tested the relationship between all five culinary-preference constructs (exogenous) and the three culinary-satisfaction constructs (endogenous), thus testing all 15 hypotheses. For the first structural model (Model A), six statistically meaningful effects (p < 0,10) of the culinary-preference factors on the culinary-satisfaction factors were found. After comparing the results of Model A with the Spearman correlation matrix (Table 2), however, it was found that there was suppression and the model could consequently not be used.
InTable 2 it can be seen that there were medium to large positive correlations (all with a p-value of less than 0,001) between all the culinary-preference factors, showing evidence of construct validity. There were also positive correlations between all the culinary-preference factors and satisfaction with personal preference and the dining environment, with the exception of there being no statistically significant correlation between culture and religion and dining environment. Culture and religion was the only culinary-preference factor that had a negative statistically significant correlation with satisfaction with affordability (rho = -0,162; small correlation).
Due to the suppression it was decided to omit all relationships between constructs that were not supported by Spearman correlations. Therefore, five relationships and their corresponding hypotheses were omitted from the second statistical model. The Spearman correlations between these constructs were all smaller than 0,06, as depicted inTable 3.
There was no direct relationship between social influence, exploration, the culinary experience or environmental sensitivity with affordability. Therefore, rating social influence (rho = -0,03), exploration (rho = -0,03), the culinary experience (rho = 0,06) and environmental sensitivity (rho = 0,03) as important had no influence on satisfaction with the affordability of food and beverages while in South Africa. Rating culture and religion as important was the only factor that displayed no significant relationship with satisfaction with the dining environment (rho = 0,05) at this stage of the analysis. This is interesting, because satisfaction with the dining environment included the health and safety of food and beverages, which one might closely link to the dietary concerns of some religious groups (Cohen and Avieli 2004).
3.4.6. Step 4: Estimate the model
A second structural model (Model B) was compiled via SPSS® to test only the structural effects that were supported by correlations. Thus it tested only the effect of each of the culinary-preference factors on some of the culinary-satisfaction factors (the remaining ten hypotheses).
a) Evaluate model fit
The objective of the model fit is to determine whether the associations between the variables in the hypothesised model sufficiently illustrate the associations observed in the data obtained (Kline 2016). The validity of Model B was assessed by considering the values obtained for normed chi-square (CMIN/DF), comparative fit index (CFI) and root mean square error of approximation (RMSEA). The values obtained were CMIN/DF = 4,494, CFI = 0,755 and RMSEA = 0,075, with a 90% confidence interval (CI). CFI values above 0,90 are generally associated with a good model fit (Hair et al. 2010). In this case, the CFI value of 0,755 does not meet the criterion. This having been said, the RMSEA value of 0,075, with a 90% CI of [0,072; 0,077], is less than the recommended 0,08, demonstrating a good fit (Stevens 2009;Malhorta et al. 2013). Likewise, the CMIN/DF of 4,494 is below the recommended 5, also representing a good model fit (Mueller 1996).
b) Assuming a model is retained, interpret the parameter estimates
Maximum likelihood estimation was the technique used for the data interpretation. The following constructs (from the structural model) had significant relationships with one another. This is evident from the statistical significance (p < 0,1), as can be seen inTable 4. H2 and H5 had medium strength standardised regression weights (β above 0,2) which is within the norm when conducting research with a human sample. The standardised regression weights of H6, H8 and H10 were weak (β between 0,1 and 0,2), but were still statistically significant and therefore included in the discussion.
The positive standardised regression weights indicate that the importance of social influence, culture and religion and exploration as culinary-preference factors had significant positive effects on satisfaction with personal preference being met while in South Africa (β = 0,26, β = 0,22 and β = 0,15 respectively). In contrast, culture and religion had a negative effect (with a standardised regression weight of β = -0,11) on satisfaction with affordability. Lastly, the standardised regression weights indicate that the culinary experience as a factor influencing culinary preference had a statistically significant positive effect on satisfaction with the dining environment (β = 0,14). Therefore, the higher the importance of the culinary experience for international tourists to South Africa, the greater their satisfaction with the dining environment.
In this discussion, only the structural model was reported on, as the measurement model was validated during the factor analysis. All the standardised regression estimates between the variables and factors were statistically significant (p < 0,001). Model B explained 1,3% of the variance for affordability, 5,5% of the variance for dining environment and 20,7% of the variance for personal preference.
c) Consider equivalent or near-equivalent models (skip to Step 6)
Model B is certainly not the only suitable model that could have been compiled from the available data. This model was, however, selected as it corresponds with the correlations.
3.4.7. Step 6: Report the results
Of the 15 hypotheses that were tested with SEM, 10 were found to be unsupported, and in the end five hypotheses were supported by Model B (seeTable 5). These findings and their implications are discussed in the following section.
4. FINDINGS AND IMPLICATIONS
Five findings emerged from the research. The first finding was that the empirical model developed through the SEM analysis details which culinary-preference factors have relationships with satisfaction with culinary personal preferences being met, satisfaction with affordability of cuisine and satisfaction with the dining environment in South Africa (seeFigure 3).
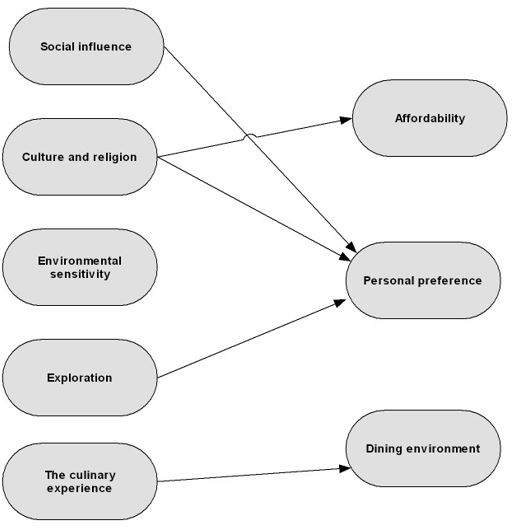
The second finding was that not all the culinary-preference constructs influence all three culinary-satisfaction constructs, and the importance of environmental sensitivity did not have a relationship with any of the three culinary-satisfaction factors. The implication of this finding is that although it may be necessary to focus on environmental sensitivity to attract international tourists, the presence of these elements did not influence the culinary satisfaction experienced at the destination in the current study. This is supported by the research conducted byBruns-Smith et al. (2015) in 100 American resorts. The authors found the link between environmental sustainability and food and beverage satisfaction to be weak.
The third finding was that three culinary-preference factors had significantly positive effects on satisfaction with personal preference being met while in South Africa, namely the importance of culture and religion, exploration and social influence.Smith et al. (2010) found the push factor (to attend a culinary event) of socialisation to influence the satisfaction of respondents. As was mentioned previously, socialising is desirable when travelling (Kim and Eves 2012).
A few implications stem from this finding, and recommendations can be implemented in order to benefit from these positive relationships. For example, more opportunities to explore will increase satisfaction with personal preferences. Hyper-local restauranteurs in America perceived the farms that they operate as providing educational experiences for themselves as well as for their customers (De Chabert-Rios and Deale 2016).De Chabert-Rios and Deale (2016) recommend that these restaurants should actively promote this educational element of visiting their establishments.
Specific food routes, culinary events and other activities such as cooking classes designed specifically for health-conscious tourists or tourists following religious or culturally acceptable diets may consequently improve satisfaction with personal preferences. South Africa can thus be marketed and positioned as a destination that caters to the needs of tourists with cultural and religious dietary requirements. Enhanced marketing strategies by national and regional tourism bodies could also improve satisfaction with personal preferences due to the positive relationship between social influence and satisfaction with personal preferences.
Lastly, restaurants can focus on these aspects in order to further improve tourists’ satisfaction with personal preferences being met by closely guarding their TripAdvisor ratings, and improving marketing and information regarding their dishes and ingredients. As is stated in the literature, communication is a frequent cause of tourists avoiding local culinary establishments (Cohen and Avieli 2004;Abraham and Kannan 2015).
The fourth finding was the link between culinary experience and satisfaction with the dining environment in South Africa. It is stated in the literature that the availability of local and traditional food could increase satisfaction (Kim et al. 2009;Kim and Eves 2012;Updhyay and Sharma 2014). The importance of traditional cuisine and experiencing a new culture formed part of the culinary experience factor, and satisfaction with menus indicating which items are local and the availability and quality of local cuisine formed part of the dining environment factor.
Since the higher the importance of the culinary experience for international tourists to South Africa is, the greater their satisfaction with the dining environment would be, restaurants should focus on aspects such as offering traditional cuisine and offering opportunities to experience a new culture, among other things in order to ensure tourists are satisfied with the dining environment. Aspects such as restaurants that are child-friendly and close to attractions are also important to ensure satisfaction with the dining environment, as is supported by the literature (Restaurant Engine 2015;Argyle 2016). Therefore, these aspects should be taken into account in the planning phase of new restaurants targeting international tourists. This finding offers restaurants insight into their clientele and illustrates the importance of the experience of dining out.
The fifth finding was that there are direct relationships between the importance of culture and religion and satisfaction with personal preference and affordability. The current study is therefore in agreement withQuan and Wang (2004), who state that culture and religious differences in tourists’ eating habits have an effect on the satisfaction experienced by tourists. Since the importance of culture and religion had a negative effect on satisfaction with affordability, establishments should not inflate the prices of culinary items that are suitable for the consumption of religious tourists, such as vegetarian dishes. The ingredients of these dishes are often less expensive than those for ordinary dishes. Even considering the fact that religious and culturally acceptable meals may require more skill and time to prepare (López-Alt 2016), it is important for the customer to still perceive the meal to be value for money. If this is achieved, it may ultimately result in a more satisfied and larger tourism market and an enhancement of the South African tourism offering. Tourists who regard culture and religion as important may currently avoid South Africa because they regard acceptable food to be inaccessible due to the price.
CONCLUSION
This paper contributed to the literature by determining the level of culinary satisfaction of international tourists to South Africa. In addition, the paper established the relationship between the importance of culinary-preference themes and the culinary satisfaction of international tourists.
In conclusion, even though all the culinary-preference constructs influence culinary preference in some or other situation, the same cannot be said for the effect of these constructs on the culinary satisfaction of international tourists to South Africa. The culinary-preference constructs tested do not all influence the different culinary-satisfaction constructs for international tourists to South Africa. Environmental sensitivity does not influence culinary satisfaction at all, while three relationships exist between the culinary-preference constructs and satisfaction with culinary personal preferences being met while in the country. Culture and religion is the only influence on satisfaction with affordability of cuisine, and the culinary experience is the only influence on the satisfaction with the dining environment. Therefore, to further improve the high culinary satisfaction reported by international tourists, the focus should fall on the hypotheses that are supported.
National and regional tourism organisations can run awareness campaigns to make culinary business owners aware of the factors that influence culinary satisfaction, and of which variables are the most important to international tourists. As a final analogy, if the South African government and industry investigate and cater for the culinary needs of international tourists, resulting in culinary satisfaction, they may exploit the country’s great potential for growth, become a more prepared culinary travel destination, reap the numerous benefits associated with culinary-preference knowledge and satisfaction, enhance tourism product offerings and improve service excellence – all contributing to the successful attainment of the NTSS (National Department of Tourism 2017).