INTRODUCTION
Revenue management (RM) is an established business discipline in many service industries today (Noone & Maier, 2015). It has been well-researched in the areas such as demand forecasting (e.g., Pereira & Cerqueira, 2022; Sierag et al., 2017), pricing (e.g., Abrate & Viglia, 2016; Ivanov & Piddubna, 2016), and capacity control (e.g., Aydin & Birbil, 2018; Steinhardt & Gönsch, 2012). However, research on hotel performance measurement appears to be somewhat neglected despite performance being a key variable in managing hotels (Ivanov, 2014). With the fast-changing environment (i.e., increased power of online travel agencies, OTAs) and developments of this business discipline, evaluating hotel operating efficiency and gauging trends in bottom-line profit have become increasingly important (Schwartz et al., 2017). It is especially so for benchmarking in the hotel industry. Consequently, assessment tools that can accurately measure the performance of RM need to be in place.
Among some early researchers on RM, Kimes (1989) notably put forward revenue per available room (RevPAR) as the ‘right’ metric for the hotel industry, which has since been the de facto standard performance measure. RevPAR can be calculated by dividing room revenue by the number of rooms available during a period of time or multiplying paid occupancy rate by the average daily rate (Schwartz et al., 2017). Its emphasis on the rooms division of a hotel as the primary revenue source makes the measure relevant to all types of hotels. The leading lodging consulting and data company, such as STR Inc., also provides RevPAR data as the primary property-level performance indicator (Lee et al., 2019). However, Schwartz et al. (2017) raised their concern about the over reliance of the lodging industry on RevPAR and RevPAR index ratios.
These traditional RM metrics have been in existence for almost 30 years. As the world shrinks with globalization and RM has evolved, it is imperative to propose a new set of metrics that can reflect more accurately the new developments in RM (Mourier, 2012). One example of such new development is the convergence of RM and marketing (Noone et al., 2003; von Martens & Hilbert, 2011). Another example is the shift from property-centric to customer-centric RM (Vinod, 2008). The crux of the discourse among industry practitioners is the constant battles with the major distribution partners and the increasing cost of customer acquisition, as well as maximizing revenue from each possible customer. To effectively measure RM performance, appropriate RM culture must be first established (Jones & Hamilton, 1992). Culture can be defined as the values and beliefs of individuals within a unit; while a unit could be a nation, organization, profession, functional area, or team (Dasgupta & Gupta, 2011). Thus, RM culture may refer to the beliefs and values which guide organizational practices and behavior in the RM implementation. Over the course of RM development, hotel RM culture or focus has been observed to vary from concentrating on rooms only to including ancillary service (e.g., food and beverage, spa, function space) and to integrating marketing (Denizci Guillet, 2020; Hotstats, 2017).
In parallel to this change in RM culture, the current RM metrics need to be revised so that the impact of various booking platforms (e.g., direct or OTAs) and the customer lifetime value can be captured. Today, some hospitality businesses have progressed to extended measures such as gross operating profit per available room (GOPPAR) and total revenue per available room (TRevPAR) (Lee et al., 2019). In contrast, net revenue per available room (NRevPAR) and revenue per available customer (RevPAC) although have been under discussion are yet to conceptualize (Brown & Dev, 1999; Denizci Guillet & Shi, 2019; Eisen, 2021; Talón-Ballestero & González-Serrano, 2013; Talón-Ballestero et al., 2014).
The purpose of this study is to unearth the weaknesses of the traditional RM metrics and subsequently shed light on the potential of two new RM metrics, namely NRevPAR and RevPAC. The specific objectives are three-fold. We first investigate the status and challenges of the existing metrics, followed by examining the hotel operators’ awareness of some new RM metrics and adoption intention towards the two new metrics. Finally, we identify the perceived advantages of the new RM metrics and their relationship with hotel RM culture. In particular, this study attempts to address the following questions:
being employed?
them? How willing are they to share their data for benchmarking?
Although preliminary, this research makes two contributions to the literature. Firstly, it is to the authors’ best knowledge the only theoretical-based qualitative study examining the weaknesses of the current metrics from the viewpoints of industry practitioners. The second contribution is that this study focuses on NRevPAR and RevPAC, the two new measures of utmost importance for future successful RM performance in the hotel industry.
LITERATURE REVIEW
RM has been advocated as the basic instrument for matching supply and demand by segmenting customers based on their purchase intentions and allocating capacity to the different segments to maximize a particular firm’s revenues (El Haddad et al., 2008). Initially developed by the airline industry after the deregulation process in the 1970s, RM has expanded to its current state as a common business practice in a wide range of industries (Ivanov, 2014). Inspired by the success of yield management in the airline industry, the hotel industry started to apply RM in the late 1980s given that both industries shared many characteristics, such as perishability, fixed capacity, and the need for segmentation based on customers’ levels of price sensitivity. Hotel RM is typically performed at the operational and tactical levels. Its definition remains pivoted around the ‘art and science’ of allocating capacity and prices to customers to optimize revenues (Josephi et al., 2016).
Overview RM Metrics
The three traditional hotel RM performance measurements are occupancy (OCC), average daily rate (ADR), and RevPAR. OCC is defined as the share of all hotel rooms being occupied for a given time, while ADR represents the average hotel room rate per occupied room in a given period (Mauri, 2012). Although OCC does not indicate any financial performance by itself, it remains an important measurement. On the contrary, although ADR is intuitive, straightforward, and easy to calculate and understand (Ivanov, 2014), it was criticized for excluding the ancillary sources of revenue generated from guests’ stay (Mauri, 2012). Furthermore, it could also be manipulated by simply selling only a few rooms at a high price.
Given the inherent weaknesses of OCC and ADR, researchers have proposed RevPAR as a better hotel performance measurement in addition to ADR and OCC (Kimes, 1989; Kimes, 1999; Mauri, 2012). For instance, Kimes (1999) argued that RevPAR is a good indicator of hotel profitability because of the low variable costs and high fixed costs related to hotels. Cross et al. (2009) stated that the occupancy rate and ADR are determinants of hotel performance, but RevPAR is a superior measure since it considers both occupancy rate and ADR. Despite its superiority and extensive use, RevPAR has been critiqued for being overly focused on rooms revenue (Ivanov, 2014; Younes & Kett, 2003a) but silent on cost and the actual and potential revenue that could be generated (Dahl, 2022; Younes & Kett, 2003b). Furthermore, both industry practitioners and academics have questioned its adequacy and reliability as a key metric for benchmarking hotel performance (Schwartz et al., 2017). Hence, average rate index (ARI), market penetration index (MPI), and revenue generation index (RGI), which can be derived from OCC, ADR, and RevPAR, are the benchmarking metrics based on competitive set data (Demirtaş, 2019).
Besides rooms, the application of RM in other hotel areas was also identified. Kimes (2011) revealed that the top three areas were function spaces, restaurants, and spas. Thus, contribution per available space-time (ConPAST) and revenue per available treatment hour (RevPATH) have been respectively employed in function space (Kimes & McGuire, 2001) and spa (Kimes & Singh, 2009). Similarly, revenue per available seat hour (RevPASH) is often used in the restaurant business (Heo, 2016; Kimes, 1999; Kimes et al., 1999). Although these metrics reflect the RM extension into other revenue centers within the hotel, they
remain lacking in focusing only on the performance of individual departments rather than as a whole (Mishra, 2019). Wang et al. (2015) also commented that these measurements do not fully address the interrelatedness of the non-room revenue centers with the room’ and the other center functions. Hence, such a “local” approach may result in a sub-optimal outcome.
Considering the developments in the hotel industry, researchers and academics argued in favor of GOPPAR (e.g., Lund, 2022; Younes & Kett, 2003b) and TRevPAR (Fenyves, 2020; Santos et al., 2020; Talón-Ballestero et al., 2014). Hoogenboom (2012) developed a GOPPAR model that incorporates many departmental key performance indicators (KPIs) and traditional RM metrics. Mauri (2012) asserted that GOPPAR is a better measure of overall hotel performance as it shows management spending and cost control. In line with this, Kimes (2011) noted that GOPPAR was the most common response of the participants when asked for the performance measurement of the future. On the other hand, the development of total RM (TRM) has resulted in TRevPAR gaining increasing attention (e.g., Kimes, 2011). This metric is superior by considering the revenues generated from other hotel ancillary services and integrating all the above metrics (Ivanov, 2014). These metrics are not without shortcomings. Schwartz et al. (2017) commented that the laborious computation of GOPPAR and the hesitation of hotel owners and managers to disclose profitability numbers are two primary impediments to its wide adoption. Similarly, Niels Mekenkamp, Director of Hospitality Infor, lamented that TRevPAR lacks a standard definition and disregards the costs of generating revenues (Remy et al., 2018).
Other metrics include NRevPAR and RevPAC (e.g., Brown & Dev, 1999; Denizci Guillet & Shi, 2019; Eisen, 2021; Talón- Ballestero & González-Serrano, 2013; Talón-Ballestero et al., 2014). Although NRevPAR is similar to RevPAR in that it is concerned with revenue generated on a per available room, it looks at net revenue rather than simple room revenue. Therefore, the surging distribution costs, such as travel agent commissions and transaction fees, are accounted for (Revfine Optimising Revenue, n.d.). By carefully analyzing these distribution costs, hotel operators could determine the appropriate online and offline distribution mix to gain an edge over their competitors (Remy et al., 2018). RevPAC, which is in line with TRevPAR, on the other hand, is particularly intriguing as it emphasizes the individual customer rather than rooms (Mauri, 2012). Thus, it is especially useful for hotels and resorts with multiple revenue generating sources.
Unfortunately, research on the two new metrics is scarce despite intense discussion among industry practitioners (Remy et al., 2018). Hernandez (2016) revealed that hotel companies with the highest profit expectations and the most data-driven cultures were found to shift their focus from product to customer. Correspondingly, hotel performance was also moved from ‘Per Available Rooms’ averages to ‘Per Available Customers’. Clearly, there is a shift from a short-term transaction-based focus to a more holistic picture (Remy, 2014), such as TRM (Noone et al., 2011; Cross et al., 2009) and a customer-centric RM (Vinod, 2008).
Total Revenue Management
Total hotel RM was postulated to be the next stage in the evolution of RM (Zheng & Forgacs, 2017). The traditional RM has focused on maximizing room revenue at the individual property level, ignoring other additional hotel revenue sources. By integrating several revenue streams including food and beverage, function space, catering, spa, retail, golf, and others with the room, TRM enables hotels to achieve their goal of maximizing revenue in highly competitive markets (Zheng & Forgacs, 2017). As some hotel businesses are progressing towards TRM (e.g., Martin, 2017), a new metric that allows them to measure and reward internal performance, as well as to compare themselves against their competitors is needed (Kimes, 2011). Notwithstanding, research in the area remains scant (Ivanov & Zhechev, 2012).
In addition to TRevPAR, GOPPAR is another metric that simultaneously accounts for revenues and costs. Ivanov (2014) revealed that it is imperative for hotels to achieve an optimal level of hotel net revenues and gross operating profit. Hotel net revenues include the sales revenues after taxes and commissions; gross operating profit equals the net revenues minus the costs for serving the customers (e.g., the costs of goods sold, marketing, administrative, and human resource expenses) (Dopson & Hayes, 2009). Consequently, maximizing net revenues does not equate to maximizing the gross operating profit. Because the metric deals with profit and can be calculated for each source of revenue within a hotel, GOPPAR is argued to be one of the important revenue metrics for the future (Kimes, 2011; Mauri, 2012).
Other than GOPPAR which measures the performance of the entire property, NRevPAR, which focuses on distribution costs, is arguably a vital metric due to its profound impact on profitability (e.g., Eisen, 2021; Gubanski, 2016). Noone (2016) stated that the emergence of online booking channels and the price transparency afforded by the Internet in the recession of the early 2000s, coupled with challenges to the basic assumptions underlying traditional RM systems, have fueled a significant change in how the hotel RM problem is approached. Recognizing the importance of the totality of RM, Noone et al. (2017) proposed to put more emphasis on profit maximization, in line with Cross et al. (2009). NRevPAR is a measure where distribution costs and other related costs to acquire customers (i.e., Rooms Cost of Sales + Sales and Marketing Expenses) are deducted from the revenue. Thus, this metric can help identify the absolute revenue derived from the rooms department which other metrics fail to do so (Hotstats, 2017). Focusing on GOPPAR would not allow for a detailed breakdown of these costs.
In times of stiff competition, shrinking margins, and constant friction with distribution intermediaries (Law et al., 2015), the cost of customer acquisition is at the forefront of discussion among industry leaders and specifically, RM practitioners today (e.g., Anderson & Han, 2017). They demanded a more holistic view of the performance by incorporating the distribution and acquisition cost factors. At this stage, the industry is at discussing how to apply this new measure. Shall the metric include only distribution costs or any other related costs to acquire customers such as digital marketing and loyalty costs? The challenge here is to include all the relevant costs in order to understand which channel is the most profitable (Gubanski, 2016). To the author’s best knowledge, research centering on the development and conceptualization of this new metric is only at its infancy stage.
Customer-centric Revenue Management
Researchers argued that understanding total customer contribution over time and optimizing price and inventory availability for customers based on estimates of their longer-term profit potential are future milestones for RM (Cross et al., 2011; Denizci Guillet & Shi, 2019; Noone et al., 2017; Talón-Ballestero & González-Serrano, 2013). The need to balance short-term revenue maximization with long-term customer development is driving change in how the RM function collaborates with other functional units such as operations and marketing (Cross et al., 2009). As a result, researchers have called for the integration of marketing, sales, and channel management to facilitate the development of differentiation strategies that can assure longer- term competitive advantage (Cross et al., 2009; Noone et al. , 2011). With its focus on pricing and inventory management tools, RM is connected with marketing, specifically, customer relationship management (CRM) (Iyengar & Suri, 2012; Noone et al., 2003; Wang & Bowie, 2009; Wang, 2012a; Wang, 2012b; Wang, 2013). Both aim at maximizing revenues albeit through different means. In particular, CRM strives to achieve higher profitability by establishing and sustaining long-lasting and mutually beneficial relationships with its customers. In this sense, CRM has a long-term time horizon while RM is more short- term oriented (Ivanov, 2014). Vinod (2008) highlighted that the advances in pricing and revenue management, as well as the development of customer retention initiatives in CRM to effectively manage customer touchpoints, are the key drivers for building lifetime relationships with the valued customer base.
In an effort to retain profitable customers, airlines have started to invest in advanced analytics to gain insights into customer traits and preferences. Hotel companies are also exploring more deeply the management of customer value. Some companies are already on the road to operationalizing individualized rates and differential treatment of customers based on their lifetime value. Nevertheless, movement beyond traditional RM activities is not without challenges. First, technology has yet to advance such that all revenue streams can be optimized simultaneously. Some companies are forced to independently develop internal tools and apply off-the-shelf software to support their RM endeavors (Noone et al., 2017). Second, the key components of customer-centric RM are still in their early stages. The strong inter-dependency among RM, CRM, and product distribution requires a holistic view into understanding the business impacts and managing the various customer touch points. On the whole, the aim is to combine short-term based marketing activities and long-term RM strategies to maximize revenues whilst maintaining profitable customer relationships (Huefner & Largay-Ill, 2008). Customers in their totality are the real assets. The traditional metrics (i.e., RevPAR) with rooms as the unit of inventory are no longer sufficient.
With this gap identified in research on hotel RM performance measures, the current study echoes Kimes (2011) in that a change in performance metrics from RevPAR to something that incorporates all revenue is necessary. Hence, the focus on NRevPAR and RevPAC is deemed timely in reference to the potential application of TRM and customer-centric RM.
Technology-Organization-Environment Framework
We drew upon the technology-organization-environment (TOE) framework (DePietro et al., 1990) to categorize the weaknesses of the current RM metrics. The framework describes the entire process of innovation, spanning from the development of innovations to the adoption and implementation by the users within the context of an organization. Although innovation is not restricted to only technology, the framework has been mostly applied in the context of technology adoption and implementation (Hradecky et al., 2022; Leung et al., 2015; Oliveira & Martins, 2011; Racherla & Hu, 2008). Furthermore, scholars called to extend its contexts to improve its academic utility (Baker, 2012; Awa et al., 2017). We argue that the TOE framework is relevant to this study for several reasons. First, researchers have pointed out that TOE and Rogers’ (1995) innovation of diffusion theory (IDT) are two prominent models when examining innovation adoption at the organizational level. Other theories, such as Theory of Reason Action (Ajzen & Fishbein, 1980), Theory of Planned Behavior (Ajzen, 1991), Technology Acceptance Model (Davis, 1989), Technology Readiness Index (Parasuraman, 2000), and United Theory of Acceptance and Use of Technology (Venkatesh et al., 2003), address individual-level adoption (Chong et al., 2009; Oliveira and Martins, 2011; Rui, 2007). In addition, it overcomes the limitation of IDT by including the environmental factor. Second, TOE is not limited to examining the initial adoption but also the subsequent implementation and usage stages (Baker, 2012; Hradecky et al., 2022; Leung et al., 2015). Third, it has received robust theoretical and empirical validation across various technological, industrial, and cultural contexts (Gibbs & Kraemer, 2004; Oliveira & Martins, 2011; Youssef et al., 2022). Finally, the TOE framework is a higher- level conceptual framework, rather than context-specific. Hence, it allows flexibility in defining users’ opinions about specific innovations (Wang et al., 2010).
The TOE framework explains three important contexts, namely technological, organizational, and environmental, that impede or promote innovation adoption. Technological context refers to the current technologies that are in use at the organization (internal) and those available in the marketplace but may not be in use (external) (Baker, 2012). Past research has agreed on relative advantage, complexity, and compatibility as the three important variables within this context (Huang et al., 2022; Pizam et al., 2022; Wang et al., 2016). In the current study, although the technological context is replaced with the metric context, the relative advantage, complexity, and compatibility remain relevant. These three variables are consistent with the five dimensions of IDT (DePietro et al., 1990). Organizational context is related to the internal organization’s characteristics and resources. The variables include firm size and scope, organization structure and culture, management support and motivation, and organization slack (Baker, 2012; Huang et al., 2022; Hradecky et al., 2022; Pizam et al., 2022). Lastly, environmental context describes the external variables surrounding an organization’s operations, which encompasses industry characteristics and market structure, government regulation, competitive level, and supplier and customer expectations (Baker, 2012; Hradecky et al., 2022; Racherla & Hu, 2008).
The data collection was executed in two stages. A roundtable focus group discussion was first conducted in Singapore in April 2017. It aimed to identify the critical hotel performance measures to be included in the subsequent survey questionnaire. Fifteen participants representing various major hotel chains were deemed appropriate as they (a) held a senior management position in their companies and (b) were highly involved in devising corporate RM philosophy and strategies. The content of the discussion was analyzed by the researchers.
Based on the outcome of the focus group discussion, four agreed-upon existing hotel performance measures (i.e., RevPAR, RGI, GOPPAR, and TRevPAR) were included in the survey questionnaire (Ivanov, 2014; Kimes, 2011; Noone et al., 2017; Younes & Kett, 2003a; Zheng & Forgacs, 2017). As F&B, function space, and spa are the three major ancillary services in hotels, their respective revenue metrics (i.e., RevPASH, ConPAST, and RevPATH) were also incorporated (Heo, 2016; Ivanov, 2014; Kimes, 1999; Kimes et al., 1999). The two intended new measures (i.e., NRevPAR and RevPAC) were also added (Brown & Dev, 1999; Kimes et al., 1999; Talón-Ballestero & González-Serrano, 2013; Talón-Ballestero et al., 2014).
The survey questionnaire consisted of two major sections. The first section was related to the background information on the hotels (i.e., type, size, RM culture) and the participants’ functional role in the organization. The second section required participants to indicate the existing performance measures employed in their hotels and the associated limitations. This was followed by questions on their awareness of the three measures for ancillary services and two new metrics. Participants were then asked about their intentions to adopt NRevPAR and RevPAC and their willingness to share data for benchmarking. Finally, participants were requested to rank the advantages of new RM metrics adapted from past research (Assaf et al., 2010; Buckhiester, 2011; Cline, 1996). An online survey using Qualtrics was constructed to collect data from June 2017 to March 2018. Since the study was targeting hotel revenue managers, the questionnaires were distributed to members of Hotel Sales and Marketing Association International (HSMAI) Asia, America, and Europe, as well as through researchers’ personal contacts.
A descriptive analysis was performed to present (a) the participant profile and property background, (b) participants’ awareness and adoption intention of new RM metrics, and (c) participants’ willingness to share data for benchmarking. The repeated measures generalized linear model (GLM) was performed to test the effects of RM culture and perceived advantages of new RM metrics. Friedman test and Wilcoxon Signed Ranks test were employed respectively to examine the significance of the overall distribution and specific importance ranking of the advantages of the new RM metrics. SPSS ver. 28 was used for the quantitative analyses.
On the other hand, participants’ remarks on the weaknesses of the current RM measures were text-analyzed following the steps outlined by Haney et al. (1998) and a priori coding approach was employed. One of the authors and an assistant independently reviewed and categorized the participants’ remarks into the three factors (i.e., technology or metric in this context, organization, and environment) from the TOE framework. The two coders compared their categories. Any discrepancies were discussed to reach the final consensus.
RESULTS
3.1 Participant Profile and Property Background
Forty responses were removed because (a) the property was neither a chain nor an independent hotel, such as consultants and vendors (n=20), (b) the participants did not hold a senior position or an RM-relevant position (n=10), and (c) the values were missing in property size (n=1), existing metric employed (n=1), awareness of new metrics (n=3), limitation of current metrics (n=3), and RM culture (n=2). The final usable data was 934 (96% of 974 responses).
Table 1 below shows that the majority of participants were in RM (80%), with nine holding two or more functional roles (i.e., RM, marketing and sales, operations, finance). Slightly more than one-tenth (10.2%) were in Marketing and Sales, with eight in e-commerce or online distribution. The remaining participants were in Finance (n=9) or Operations (n=56), such as food and beverage and front office. Eighteen participants were hotel owners, Directors, or General Managers.
Table 1: Participants’ Functional Roles (n=934)
Pertaining to the property background (Table 2), the majority were chain hotels (83.2%) and have less than 200 rooms (44.4%) or between 201 and 400 rooms (37.6%). Properties with more than 400 rooms were rare. The RM culture was split at two extremes. More than three-quarters (76.1%) were practicing either the simple room-focused (n=317) or total RM optimization with integrated marketing (n=394).
Table 2: Hotel Type, Size, and RM Culture (n=934)
The revenue performance assessment tools in the hotel industry could be grouped into four categories. These are (a) traditional internal (i.e., OCC, ADR, RevPAR) and external (i.e., MPI, ARI, RGI) indicators, (b) emerging metrics encompassing TRevPAR, GOPPAR, and ancillary revenue metrics, (c) financial-focus measures, including total revenue, earnings before interest, taxes, depreciation and amortization (EBITDA) or gross operating profit (GOP), profit (PROF), and return on investment (ROI), and
(d) non-financial measures, such as customer satisfaction and reputation score. When participants were asked to indicate the hotel performance measures employed within their companies, the number of metrics used spanned up to seven. All but two suggested at least one performance metric. Approximately one-half (44.5%) and one-third (36.3%) employed only one and two metrics, respectively.
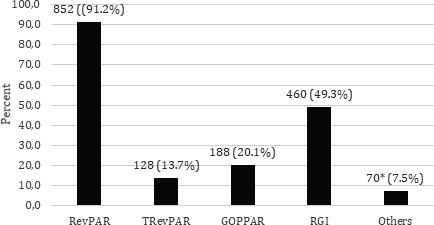
Among the four provided metrics, RevPAR (91.1%) and RGI (49.3%) were the most popular, followed by GOPPAR (20.1%) and TRevPAR (13.7%). This result is not surprising since the former two have been the industry’s de facto standard measures. Fifty-five hotels employed all four of them. In addition, 71 participants reported other KPIs being used. Among these other KPIs, the financial-related measures (n=38), such as EBITDA and GOP, were most indicated. It is exciting to find that 18 hotels have commissioned some contemporary RM measures, including NRevPAR, RevPAC, and RevPASH, revenue per available treatment hour (RevPATH), revenue per square meter (RevPSQM), profit per available room (ProfPAR), and total revenue per occupied room (TRevPOR). Figure 1 below presents the hotel RM metrics currently employed.
Figure 1: Currently Employed Hotel RM Metrics
Despite the popularity of RevPAR and RGI and the emergence of TRevPAR and GOPPAR, approximately one-third (33.1%) of participants agreed that the metrics are not without limitations. Their views were text analyzed and four aspects of limitation, namely (a) lack of comprehensiveness (metric factor), (b) noncomparable metrics (environment factor), (c) data quality and robustness (metric factor), and (d) organizational constraints (organization factor) were uncovered. An inter-judge reliability of 92.8% was achieved.
Lack of comprehensiveness (59.0%) was identified as the primary drawback. Participants highlighted that the traditional RevPAR is lacking as it does not consider the cost of customer acquisition, especially from various channels, and hence focuses only on the top line. In view of the pervasiveness of online travel agencies (OTAs) and the high commission paid by the hotel operators, it is not surprising that there has been an unremitting request for new hotel RM metrics (i.e., NRevPAR) from both industry and academia (Purcărea, 2016).
Apart from the absence of bottom-line consideration, RevPAR was also criticized for “ not fully capture the potential revenue that can be reached”. The majority of participants indicated that their hotels have turned away from focusing on rooms only. Therefore, such criticism is not an anomaly but in agreement with Kimes (2011) who advocated TRevPAR as the future metric. In addition, it may be due to this traditional yield indicator comparing only the current revenue with potential revenue and hence does not allow for maximization.
In addition to the cost structure and other revenue potentials, the text analysis uncovered the possibility to expand RM measures to distinguish the contribution of different segments or even at an individual level. A participant commented that “ none of them measured per person in all-inclusive models”. Furthermore, the existing metrics do not permit hoteliers to “ see if using the right segmentation and the best strategy to generate more profit”. Taken together, the development of RevPAC, especially for vacation or resort hotels and their comparison with urban counterparts, is supported and is deemed a fruitful future research avenue.
Second, the qualitative analysis further revealed that the existing metric cannot compare or perform benchmarking (18.6%). The wide adoption of RGI and low implementation of GOPPAR and TRevPAR indicated the ability for a metric to benchmark in the market is critical. In fact, the qualitative analysis of the participants’ comments highlighted two important benchmarking constraints of the existing revenue measures. First, although hoteliers would like to embrace more holistic measures, the current STR report is restricted to a comparison of RevPAR, OCC, and ADR performance. Second, the comp set selection is limited. As some of the participants noted “ RevPAR is only accurate if you have an accurate compset. Depending on where a hotel is located, they might not have “close” competitors especially size-wise”, “ My portfolio of hotels consists of extended stay products, so current metrics do not give an extended stay projection”, and “ The Building Models for Hotels is changing significantly with movement into Strata & Timeshare. Competitors such as Airbnb & Vacation Clubs mean that we are not always comparing to our true competitors & we need to find a way to do this better so we can truly see how we are performing in the market and the true risk attached to this new style of competitors.”
Taken together, the remarks made by this participant summed the two prominent weaknesses of the four performance measures well, “ We should include distribution costs on the RevPAR and also consider total contribution instead of only rooms. Regarding RGI, it would be interesting to have a comparison between the GOP of different hotels”.
The third inadequacy is associated with data quality and robustness (14.0%). Participants questioned the accuracy (e.g., “ captured data from property not always accurate”) and authenticity (e.g., “ our compset didn’t provide actual true figures in
STR”) of the data collected. The skepticism may be attributed to the recognition of such information as a trade secret (Kimes & Wagner, 2001) and hence accurate information may be concealed. Other contributing factors, such as the different accounting and reporting practices (e.g., “ differences in reporting between companies”) and timeliness of information (e.g., “ The cost is given by Finance at the end of each month”), were also noted. Moreover, the exchange rate variation and fluctuation in inventory due to new hotel openings, refurbishment and renovation, and loss of business, have prompted participants to demand more robust measures.
Hitherto, the above limitations have pointed toward the development of future metrics which should be comprehensive and allow for comparison with robust and accurate data. The final limitation is more organizational-related (8.5%). Specifically, the lack of “ resources in term of technology, talent, and marketing budget” and “ proper system to track and analyze the complexity of data, the knowledge of other department” has restricted organizations from implementing more holistic measures. In addition to the facilities and human resource challenges, participants also asserted that owners’ “ buy in” is crucial. Unfortunately, convincing and educating the top management is always a dreadful toil, more so when financial investment is needed for RM system (Domingo-Carrillo et al., 2020).
To summarize, the well-established performance measures (i.e., RevPAR and RGI) remain the popular metrics adopted by hoteliers, while TRevPAR and GOPPAR have gained some industry attention. Other future metrics, including NRevPAR and RevPAC, were also suggested. Nevertheless, it is important to note that such future measures must be robust, accurate, and allow for benchmarking, overcoming the limitations of the current hotel RM metrics.
Table 3: New RM Metrics Awareness, Adoption Intention, and Willingness to Share Data
Finally, the study also aims to uncover how hotel operators perceive the advantages of the new RM metrics. The between- and within-subjects GLM test was performed to investigate if the perceived benefits vary among different RM cultures. As Mauchly’s test of sphericity was not met (χ 2(9)=251.866, p<.001), Girden’s (1992) suggestion of the Huynh-Feldt corrected model degrees of freedom was adopted (ε=.910). Results showed that the interaction effect was not significant (F(10.926)=1.774, p=.053) but the main effect of advantage was (F(3.642)=623.458, p<.001). The non-parametric Friedman test confirmed a significant distribution among the five advantages (χ 2(4)=1858.802, p<.001).
Table 4: Importance of the Advantages of New RM Metrics
The subsequent Wilcoxon Signed Ranks test showed that driving total RM was recognized as the primary advantage, while efficiency and return on marketing effort was the least important (Table 4). Driving channel optimization was perceived as important as planning and budgeting (Z=.433, p=.665). Figure 2 below depicts the ranks of advantages by different RM cultures.
DISCUSSIONS AND CONCLUSION
The current study was motivated by the urge from hotel operators for new metrics that could reflect more accurately the industry developments (e.g., Younes & Kett, 2003b). In particular, the increasingly important role played by online distribution channels, the realization of hotel revenues beyond rooms, the shift from a property-centric to a customer-centric RM model, and the COVID-19 pandemic are factors that drive the HSMAI Revenue Optimization Advisory Board KPI workgroup discussing the evolution of RM performance indicators in 2021 (Lund, 2022).
The current study brings to light four important findings. First, although two-thirds of the respondents have progressed to “beyond room only” RM culture, two-thirds of the total respondents also did not perceive any limitations of the existing metrics (e.g., RevPAR, RGI). This finding contradicts the general assertion in past research that ADR, RevPAR, and RGI are lacking (Kimes, 2011; Lee et al., 2019, Schwartz et al., 2017). One possible explanation for such contention may be that the respondents are resistant to change. Research in organization management has documented that employees often display negative attitudes and behavior when new technology or change is introduced (Chaudhry, 2018). Another explanation may be that respondents deemed RevPAR and RGI as sufficient functionally (e.g., Lund, 2018) given that new metrics are not established.
Second, it is encouraging to observe that approximately half of the respondents are willing to adopt the new metrics (i.e., NRevPAR and RevPAC) even though they may not perceive the existing measures as inadequate. This positive response is likely attributed to the increasing requests from the top management to expand the hotel revenue beyond rooms, and the primary importance to drive total RM initiative and channel optimization, as well as assisting in planning and budgeting. Besides, the inclination to implement new measures might also be due to the growing power of OTAs. As the commission paid to OTAs can be as high as 30% (Stangl et al., 2016), hotels have been witnessing a decrease in their profit. Hence, there is a pressing need to establish new measures that would incorporate real customer acquisition costs.
Third, the results of this study show that almost all hotels applied at least one RM metric, with RevPAR and RGI being the most widely applied. GOPPAR and TRevPAR also received considerable recognition, parallel to the industry development. However, the above metrics were found lacking in terms of comprehensiveness, benchmarking ability, data quality and robustness, and organizational support. These limitations are in line with the organizational technology adoption theory (DePietro et al., 1990), in which technology, organization, and environment are the three pillars affecting the success of innovation implementation in an organization.
Pertaining to new RM metrics, NRevPAR and RevPAC appear to be promising. The majority of participants are aware of them and have a favorable attitude towards adopting the metrics and sharing data for benchmarking.
Contributions
This research has made three important contributions. It is the first to shed light on the potential of introducing some new RM metrics, in particular NRevPAR and RevPAC. Hotel operators today are concerned with the high commission fees charged by OTAs, yet their businesses are greatly dependent on them. The high level of awareness and willingness to adopt the new metrics assure the academic researchers that studies to conceptualize the metrics, for example, which marketing cost factors to be deducted in NRevPAR and how customers are defined in RevPAC (McCune, 2019; Remy et al., 2018), would be beneficial and well received.
Second, the present study unveiled the limitations of the existing RM measures which should be avoided when conceptualizing new metrics. In particular, the new RM metrics must be comprehensive to include distribution costs, revenues generated from ancillary services, market segments, and individual customer spending. RM vendors, such as STR, play a vital role in safeguarding the data quality and expanding the participating hotels. This is especially crucial for benchmarking to be meaningful.
Finally, this study also highlighted that organizational culture is critical to ensure the success of introducing new RM metrics. Hotel owners and senior management must be convinced of the benefits, such as in planning and budgeting and driving total RM and channel optimization. With their buy-in, resources could be allocated to recruit appropriate talent, provide training and education to staff, and acquire technology or system to support the metric calculation.
Limitations and Future Studies
Although the current study has made several important contributions, there remains a few notable limitations. First, although the data was collected from HSMAI Asia, America, and Europe, we acknowledged that it has not clearly reported the geographical distribution. Furthermore, this study is exploratory in nature. Future research may examine the research questions in different countries. Second, this research was conducted prior to the COVID-19 pandemic. A comparative study could be carried out in the future to determine the changes in attitudes and perceptions among hoteliers. Third, the current study unearthed the perceived limitations of the present RM metrics using DePietro et al.’s (1990) TOE framework. Much of the past research (Fong et al., 2017; Huh et al., 2009; Le et al., 2006; Ozturk et al., 2016) has focused on the application of the technological acceptance model (TAM), innovation diffusion theory (IDT), and united theory of acceptance and use technology (UTAUT) in understanding the users’ attitudes toward adopting a technology. Future research could examine their appropriateness in the context of new RM metrics adoption.
Finally, this study revealed the weaknesses of the current RM metrics and the potential of new metrics. Research investigating the factors motivating and deterring the adoption of new RM metrics appears to be a promising future avenue. In particular, the current research highlighted the pressing need to establish new industry-wide RM metrics. In the attempt to conceptualize NRevPAR, a myriad of hotel brands with different profiles (e.g., resort and business hotels, chain and independent, full and limited services, and small to large property sizes) should be included. Identifying which distribution and marketing costs to deduct in order to find common ground to establish thereafter an industry-wide new RM metric would be beneficial.
On the other hand, unlike RevPAR which focuses on hotel rooms, RevPAC emphasizes the customers (Hernandez, 2016). The revenue generated from a room occupied by two guests is not comparable to that occupied by a single guest. Although intuitive, there remain some challenges in defining the customer. In particular, the pressing questions are how a customer stays in a hotel for business purposes but continues as a leisure traveler subsequently be categorized and if it would be considered as one or two customers.
ACKNOWLEDGMENT
We would like to thank the reviewers and journal co-editor for their valuable suggestions.
REFERENCES
org/10.1016/j.tourman.2016.02.006
29(3), 468-475. https://doi.org/10.1016/j.ijhm.2009.10.020
Integrated Series in Information Systems (pp. 231-245), Springer.
Information Systems, 50(2), 13-22.
www.roundhillhospitality.com/pdf/01_hosp2000_nextmil.pdf
Cross, R. G., Higbie, J. A., & Cross,D. Q. (2009). Revenue management’s renaissance: A rebirth of the art and science of profitable revenue generation.
Cornell Hospitality Quarterly, 50(1), 56-81. https://doi.org/10.1177/1938965508328716
Dasgupta, S., & Gupta, B. (2011). Impact of organizational culture on technology use in a developing country. In Proceedings of the 17th Americas Conference
on Information Systems (pp. 1-10), Detroit, Michigan.http://aisel.aisnet.org/amcis2011_submissions/436
(Eds), The Processes of Technological Innovation (pp. 151-175), Lexington Books.
Journal of Information Systems and Software Engineering for Big Companies, 7(2), 33-48.
Chinese consumers. Tourism Management, 61, 331-342. https://doi.org/10.1016/j.tourman.2017.03.002
Gubanski, A. (2016). The New KPI’s within Hotel Revenue Management. Retrieved May 3, 2019, fromhttp://www.linkedin.com/pulse/new-kpis-within-hotel-
revenue-management-annemarie-gubanski
Haney, W., Russell, M., Gulek, C., & Fierros, E. (1998). Drawing on education: using student drawings to promote middle school improvement. Schools in
the Middle, 7(3), 38-43.
on Hotel, Restaurant, and Institutional Education. https://arodes.hesso.ch/record/1788/files/Heo_RevPASHbestperformance_2016.pdf Hernandez, R. (2016). Per Available Customer: The Future of Hotel Revenue Management. Retrieved August 20, 2019, from https://revenue-hub.com/per-
available-customer-revenue/
Kamperland, The Netherlands. Retrieved April 18, 2012, fromhttps://www.hsyndicate.org/file/152004871.pdf
Hotstats (2017). 2000-2015 Benchmarking beyond RevPAR. Retrieved July 24, 2019, fromhttp://www.hotstats.com/hotel-industry-resources/2000-2015-
benchmarking-beyond-revpar
Hradecky, D., Kennell, J., Cai, W., & Davidson, R. (2022). Organizational readiness to adopt artificial intelligence in the exhibition sector in Western
Europe. International Journal of Information Management, 65. https://doi.org/10.1016/j.ijinfomgt.2022.102497
org/10.1016/j.bushor.2008.01.013
upscale hotels. International Journal of Hospitality Management, 28(1), 121-134. https://doi.org/10.1016/j.ijhm.2008.06.004
Zangador Ltd.
15(3/4), 252-257. https://doi.org/10.1057/rpm.2016.4
42(5), 8-15.
org/10.1016/j.annals.2019.04.006
strategists-navigate-shifting-guest-acquisition-terrain
Mishra, R. R. (2019). Understanding revenue management and its implications for hotel industry: An integrative literature review. International Journal of
Academic Research & Development, 5(2), 51-63.
Noone, B. M. (2016). Pricing for hotel revenue management: Evolution in an era of price transparency. Journal of Revenue and Pricing Management, 15(3/4), 264-269. https://doi.org/10.1057/rpm.2016.8
Journal of Revenue and Pricing Management, 2(1), 7-21. https://doi.org/10.1057/palgrave.rpm.5170045
Evaluation, 14(1), 110-121.
Research, 2(4), 307-320. https://doi.org/10.1177/109467050024001
Hospitality & Leisure Marketing, 17(1-2), 30-58. https://doi.org/10.1080/10507050801978372
sites/11/2019/02/2019-hsmai-and-sit-revenue-management-metrics-study-final.pdf
Rogers, E. M. (1995). Diffusion of Innovations (4 th edition), New York: Free Press.
Santos, L. L., Malheiros, C., Gomes, C., & Guerra, T. (2020). TRevPAR as hotels performance evaluation indicator and influencing factors in Portugal. EATSJ Euro-Asia Tourism Studies Journal, 1(Dec), 93-105.http://hdl.handle.net/10400.8/7519
insights. International Journal of Hospitality Management, 52, 87-96. https://doi.org/10.1016/j.ijhm.20 15.09.015
hotel industry. Journal of Revenue and Pricing Management, 13, 309-321. https://doi.org/10.1057/rpm.2013.47
Travel & Tourism Marketing, 32(7), 797-811. https://doi.org/10.1080/10548408.2015.1063798
and Social Change, 77(5), 803-815. https://doi.org/10.1016/j.techfore.2010.03.006
Wang, Y.-S., Li, H.-T., Li, C- R., & Zhang, D.-Z. (2016). Factors affecting hotels’ adoption of mobile reservation systems: A technology-organization-
environment framework. Tourism Management, 53, 163-172. https://doi.org/10.1016/j.tourman.2015.09.021
Younes, E., & Kett, R. (2003b). Refining the anomalies out of RevPAR. Hospitality Review, 5(2), 16-20.
Consumer Services, 64, 102827. https://doi.org/10.1016/j.jretconser.2021.102827
https://doi.org/10.1057/s41272-016-0057-x
Please cite this article as:
RevPAC. Tourism And Hospitality Management 29(2), 221-233, https://doi.org/10.20867/thm.29.2.6