
1. Introduction
Azadirachta indica, generally known as neem, is a native of Southern Asia and a well-known tree belonging to the family of Meliaceae. Various parts of this tree are much valued in Ayurvedic medicine due to their phenolic composition and associated pharmacological properties (Shewale and Rathod, 2018). Apart from leaves and bark, edible flowers of A. indica have recently gained attention for their culinary uses as well as their therapeutical potential. A. indica flowers are sweet scented with ovate selel and white oblanciolate petals. It produces yellow drupes around 12-20 mm long, that are ellipsoid and glabrous long (Parotta, 2001). Traditionally, these flowers have been used to treat nasal polyposis, anthraquinone fraction of dried flowers of A. indica have been consumed orally to treat leprosy, hot water extracts were used as an anti-hysteric remedy and to treat diabetes, the infusion of flowers was used to control dyspepsia and general debility (Hashmat et al., 2012). Based on previous reports, the above mentioned medicinal properties can be attributed to the phenolic composition of A.indica flowers. A. indica is a rich source of various compounds, such as azadirachtin, gallic acid, chlorogenic acid (Singh et al., 2005), and chromatographic analysis of aqueous extracts of young flowers identified them as a prominent source of rutin and quercetin (Chaisawangwong and Gritsanapan, 2013). These findings have awakened the interest of researchers for further exploring of these flowers as novel sources of phenolics leading to the investigations on phenolic profiling and incorporation in functional food and nutraceutical development.
Application of A. indica flowers as a functional ingredient requires appropriate extraction of phenolic compounds at a maximum quantity. So far different extraction techniques such as solid-liquid extraction, microwave extraction, ultrasound assisted extraction and supercritical extraction have been used to extract phenolic compounds from different plant matrix (Yahya et al., 2018). However, the yield of phenolics could be influenced by different extraction process parameters depending on the technique employed. Thus, no universal extraction protocol could be developed for any plant matrix and it is important to optimize the process parameters to obtain maximum quantity of phenolics. The current work has made use of solid-liquid extraction technique which is a convenient and reliable approach for phenolic extraction (Ongkowijoyo et al., 2018). The efficiency and yield of phenolics extracted by solid-liquid extraction from A. indica flowers could be influenced by parameters such as extraction temperature, time, solvent concentration and solid to liquid ratio. The optimization of these parameters could facilitate to maximize the yield in a simple and cost effective manner from A.indica flowers.
Response surface methodology (RSM) is an effective statistical and mathematical tool that is widely used by the researchers to study the effect of independent variables on the investigated responses and to optimize the responses as required (Martínez-Patiño et al., 2019). RSM is used to design statistical experiments, model the extraction parameters and to validate the statistical significance of the independent variables (Alara et al., 2017). The major advantage of RSM over the one-factor-a-time approach is that it allows the evaluation of the independent variables and their interactions on the dependent variables with less number of trials and also facilitates simultaneous optimization of extraction parameters (Giacometti et al., 2018). Thus, the current work aims to optimize four process parameters simultaneously to maximize the yield of total polyphenols, anthocyanins along with maximum antioxidant activity from A.indica flowers using an ethanol based solvent system.
2. Materials and methods
Sample preparation and extraction
A. indica flowers were collected from Jaffna area of Sri Lanka and the voucher specimen was deposited in the herbarium of Wayamba University of Sri Lanka. All the flowers were freeze dried at -35 °C using a freeze drier (Alpha 1–2 LDplus, Germany) after appropriate cleaning. The freeze dried flower samples were powdered using a laboratory grinder and stored at -18 °C until further analysis.
Phenolic extraction was performed by homogenizing 1g of the sample with different concentrations (40% to 100%) of ethanol at different volumes (20-40 mL) using a vortex mixer. Range of ethanol concentrations were prepared by diluting absolute ethanol using distilled water. The samples were then exposed to different temperatures (30 to 60 °C) for varying time period (30 to 60 minutes). The combinations of the process parameters are tabulated in Table 1. The obtained crude extracts were filtered through Whatman filter paper, Grade 1 and stored at -4 °C until further analysis. The combinations of the process parameters were selected as defined by the RSM design generated by Minitab statistical software version 17 (LLC).
Table 1. Central composite design for process variables and corresponding response variables
Experimental design, modelling and optimization
The RSM was used to optimize the extraction parameters, with the purpose of finding favorable conditions to maximize the extraction yield of phenolic compounds and anthocyanins along with maximum antioxidant activity from A.indica flowers. For this purpose, a central composite design (CCD) was built for the optimization of the best extraction conditions; the variables under analysis were XA; solid to liquid ratio, XB ; Ethanol concentration, XC ; Temperature, XD; Time) in a total of 31 experiments (Table 1) performed in a randomized order. The range of extraction conditions was selected based on previous literature (Gunathilake et al., 2019). A two level four factor CCD, with 16 corner points, 8 axial points and 7 center points was performed. Regression coefficients and the statistical significance of the model terms was determined using response surface analysis and Analysis of variance (ANOVA), using SPSS statistical software. The second order polynomial equation was used to express the investigated responses as a function of the independent variables as shown in the Eq. 1.
(1)
Y indicates the response variable, Xi and Xj represents the independent variables, β0, βi, βii and βij represents the coefficients of the constant, linear effects, quadratic effects and interactive effects of independent variables, respectively. The optimal values of responses were obtained by solving the regression equations and by analysing the responses surface and contour plots using the predictive equations of RSM. A set of experiments using the optimized values was conducted and the obtained data was compared with the predicted values to test the accuracy of the models.
Determination of total phenolic content (TPC)
Folin-Ciocalteu method (Singleton et al., 1999) was used to determine the TPC of the extracts. Briefly, 100 µL of 0.5N Folin–Ciocalteu reagent was added to 500 µL of ethanolic extracts and the mixture was incubated in dark for 15 minutes at room temperature. Then 2500 µL of 7.5% (W/V) sodium carbonate was added and the mixture was further incubated for 2 hours. The absorbance of the resulting mixture was measured at 760 nm using a UV/VIS spectrometer (840-210800 Thermo Fisher Scientific, USA). Assays were conducted in triplicates and the TPC was expressed as mg gallic acid equivalents (GAE) per g dry weight (DW) of flowers. A concentration range of gallic acid standards was prepared by appropriately diluting stock solution of gallic acid to obtain the relevant calibration curve.
Determination of total anthocyanin content (TAC)
TAC of the flower extracts was determined as described in Janarny et al., (2021), using the pH differential method. Briefly, 500 µL of extracts was mixed with 3500 µL of potassium chloride buffer (0.025 M, pH 1) or 3500 µL of sodium acetate buffer (0.025 M, pH 4.5), separately, and incubated for 15 min. The absorbance of the incubated mixture was measured at 510 nm and 700 nm. The difference in the absorbance was calculated as follows:
(2)
The concentration of anthocyanin from A.indica flowers, was calculated using the formula, absorbance × MW × dilution factor ×1000)/(ε × 1, where the molar absorptivity (ε) and molecular weights (MW) of cyanidin-3-glucoside was ε = 26900; MW = 449.2 g/mol, respectively. Assays were conducted in triplicates and the TAC was expressed as milligrams of cyanidin 3-glucoside equivalents (cy-3-glu) per gram of DW of flowers.
Determination of 2,2-diphenyl-2-picrylhydrazyl (DPPH) radical scavenging assay
The DPPH radical scavenging activity of the extracts was determined as described by Ӧztürk et al. (2011). Accordingly, 400 µL of flower extracts was mixed with 3600 µL of ethanolic DPPH solution (100 µM). The homogenized mixture was incubated in the dark at 37 °C for 30 minutes. After incubation, the absorbance of the mixture was measured at 517 nm using a UV–Visible spectrophotometer. Percentage of DPPH radical scavenging was calculated using the equation:
(3)
Asample and Acontrol denote the absorbance of the samples and contro,l respectively. The absorbance of the control was measured by replacing the extract with the solvent.
3. Results
Model fitting
To evaluate the individual, as well as interactive effects of ethanol percentage, extraction time, temperature and solid to liquid ratio on the TPC, TAC and DPPH radical scavenging activity of A. indica flowers CCD was used. The defined combinations of uncoded process parameters and the respective experimental values of response variables are shown in Table 1. The second order polynomial equation was used to model the independent variables. As indicated by the ANOVA results tabulated in Table 2, the reduced models generated after the elimination of all insignificant variables could be applied to predict the studied responses. Also the three-dimensional (3D) response surface plots obtained can be used to visualize the interaction effects between process parameters towards the model responses.
Table 2. Regression coefficients and ANOVA results describing the effect of process variables on the total phenolic content, total anthocyanin content and DPPH radical scavenging activity of Azadirachta indica flowers and model adequacy
Effect of extraction variables on TPC
Based on the experimental data and statistical analysis, the reduced second order polynomial model obtained by relating the phenolic content to the extraction variables, could be expressed as follows:
(4)
Taking the results of ANOVA into account, the obtained model p value was 0.001 and lack of fit was insignificant with the p value of 0.13, indicating that the proposed model is well fitted. Also the model displayed a good model prediction with R2= 0.7538 and Adj.R2= 0.6584. The linear effect of ethanol concentration showed a significant positive effect (p<0.05) on the yield of phenolics. As noted in the quadratic model, it could be seen that ethanol concentration and extraction time had a significant negative effects on TPC and the values are expressed in Table 2. The interactive effects of solid to liquid ratio and ethanol concentration illustrated a significant (p<0.05) negative impact on TPC, whereas the interactive effects of solid to liquid ratio and temperature displayed a significant (p>0.05) positive effect on TPC. The response surface plots, obtained for the interactive effects of independent variables, are shown in Figure 1.
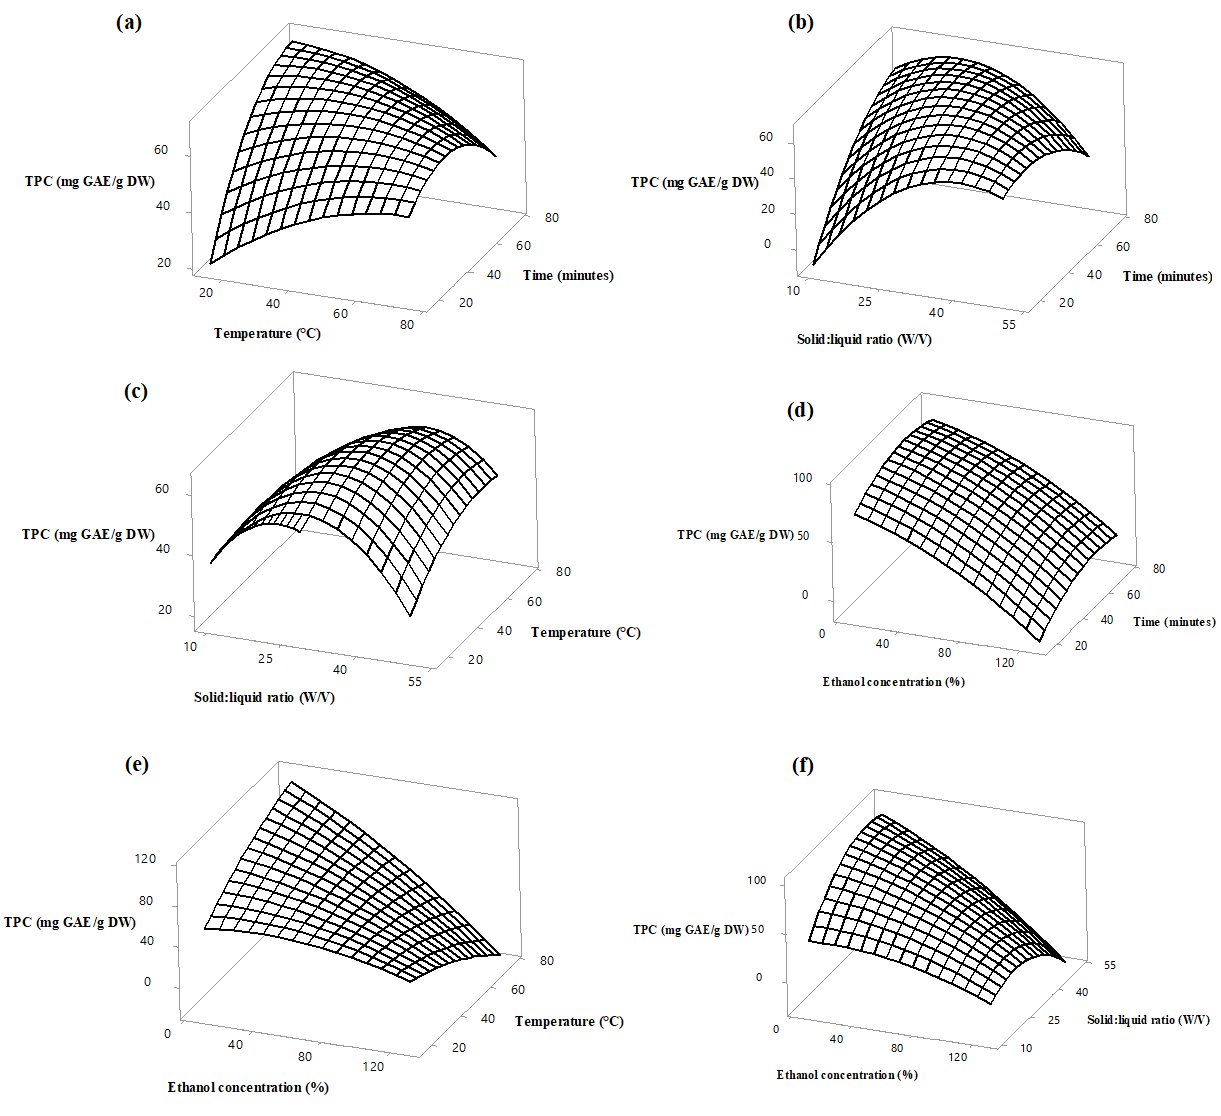
Figure 1. Response surface plots of phenolic extraction (mg GAE /g DW) extraction from Azadirachta indica flowers as a function of solid to liquid ratio, ethanol concentration, extraction temperature and time. Values were kept constant as follows, Temperature 45 °C, ethanol concentration 70%, Extraction time 45 minutes and solid to liquid ratio 1:30.
The TPC of the flower extracts varied from 4.80 to 91.88 mg GAE/g DW. The wide variation indicates the impact of interactive effects of different extraction variables on TPC. The highest and the lowest phenolic content was noted in experimental runs 19 and 31, respectively. As observed in Figure 1 (a), TPC has increased while increasing the temperature up to 60 °C and decreased gradually with further increase in temperature. De Paula et al. (2016) has identified that azadirachtin, which is a major phenolic compound present in A.indica, is well extracted from their dried fruits at approximately 60 °C and lower ethanol concentration. Generally, higher temperature accelerates the swelling and softening of the cellular structures and this enhances permeation of phenolic compounds into ethanol (Spigno et al., 2007). Apart from this, activation of molecular motion of phenolics and alteration of solvent properties such as viscosity, density and surface tension enhances the diffusion of phenolic compounds into the extraction solvent (Boonkird et al., 2008). Since phenolics are thermosensitive compounds, excessively high temperatures can cause fragmentation and degradation of phenolics leading to lower TPC (Kamarudin et al., 2020). This fact could probably support the observation in the current study where TPC has decreased at temperature more than 60 °C.
Considering the impact of extraction time on TPC, based on Figure 1 (a) and (b), it can be noted that the yield has increased from 4.80 mg to 55 mg GAE/g DW up to 50 minutes and extended extraction time has gradually lowered the yield. This observation could be well explained by the Fick’s second law of diffusion, which states that diffusion will be accelerated until the equilibrium between the flower matrix and the solvent is reached. Increasing the extraction time after the equilibrium will not cause a significant increase in the yield (Silva et al., 2007). However, prolonged extraction time could reduce the TPC due to photodegradation, structural deformation due to chemical and enzymatic reaction and oxidation of phenolics (Deng et al., 2016). Hismath et al. (2011) has reported 59.25 minutes as the optimum time for the acetone extraction of phenolics from A.indica leaves. Investigations by Fu et al. (2014) have identified 50 minutes as the optimum time for the extraction of oleanolic and ursolic acid from pomegranate flowers which is consistent with findings of the current work.
As illustrated by Figure 1 (b) and (c), the content of phenolics was maximized at a solid to liquid ratio of 1:30 and when increasing the proportion of the solvent, the content of phenolics extracted has decreased. This could be justified by the fact that when increasing the volume of the solvent, a greater concentration gradient is established facilitating migration of phenolic compounds from the matrix to the solvent. When considering the impact of ethanol concentration on TPC of A.indica flowers, higher content of phenolics was obtained within the range of 20% to 40% of ethanol. Reports of Alara et al., (2018) were consistent with data from our work, where recovery yield of phenolics from Vernonia cinerea leaves was maximum at 40% ethanol and, significantly, reduced at higher ethanol concentration. Extraction efficiency of phenolics from apple pomace and olive leaves were maximized at 50% ethanol followed by a drop with further increase in ethanol concentration (Wang et al., 2018; Irakli et al., 2018). The selection of appropriate solvent for extraction of phenolics is crucial, as it has a substantial impact on the yield of extraction. The solvent polarity influences the solubility of phenolics depending on the biochemical structure of phenolics in the matrix (Vetal et al., 2012). As evidenced by literature, ethanol has been screened as one of the most suitable solvents for the extraction of phenolics in natural product studies, due to its polar nature, low toxicity and permitted as a food additive (FDA, 2019). Thus, the present work has made use of ethanol as the extraction solvent. The concentration of ethanol added to the extraction process also influences the quantitative recovery of phenolics from the matrix. Based on previous reports, the proportion of water added to ethanol is crucial as it could alter the solvent properties such as viscosity, density and dielectric constant of ethanol, which ,in turn, affects the solubility and diffusion of compounds from the matrix (Cacace and Mazza, 2003). Generally, too low or too high ethanol concentration is not conducive for the simultaneous extraction of phenolic compounds. Moderate concentration of aqueous ethanol facilitates higher extraction yield by the mechanism, where water acts as a swelling agent and ethanol breaks down the linkages between the solutes and the flower matrix (Gunathilake et al., 2019). At higher ethanol concentration protein denaturation, as well as dehydration of flower matrix, hinders the solubility and diffusion of phenolics leading to lower extraction yield (Bamba et al., 2018).
Effect of extraction variables on TAC
The model proposed for TAC, shown below, had a p value of 0.039 with an insignificant lack of fit (p=0.61). The model performance was evaluated using the determination coefficients which were as follows: R2=0.7652 and Adj.R2=0.7022. The coefficient values suggest that the model is well-fitted and reliable to predict the responses further. Considering the linear effects, ethanol concentration and solid to liquid ratio had a significant (p<0.05) positive effect on TAC, whereas the linear effects of other variables were insignificant. Based on the quadratic model, a significant (p<0.05) negative effect of solid to liquid ratio was observed for the yield of anthocyanins.
(5)
Considering the interactive effects, the interaction of solid to liquid ratio and ethanol concentration expressed a significant negative effect towards the yield of anthocyanins. Figure 2 indicates the response surface plots obtained for the interactive effects of different variables.
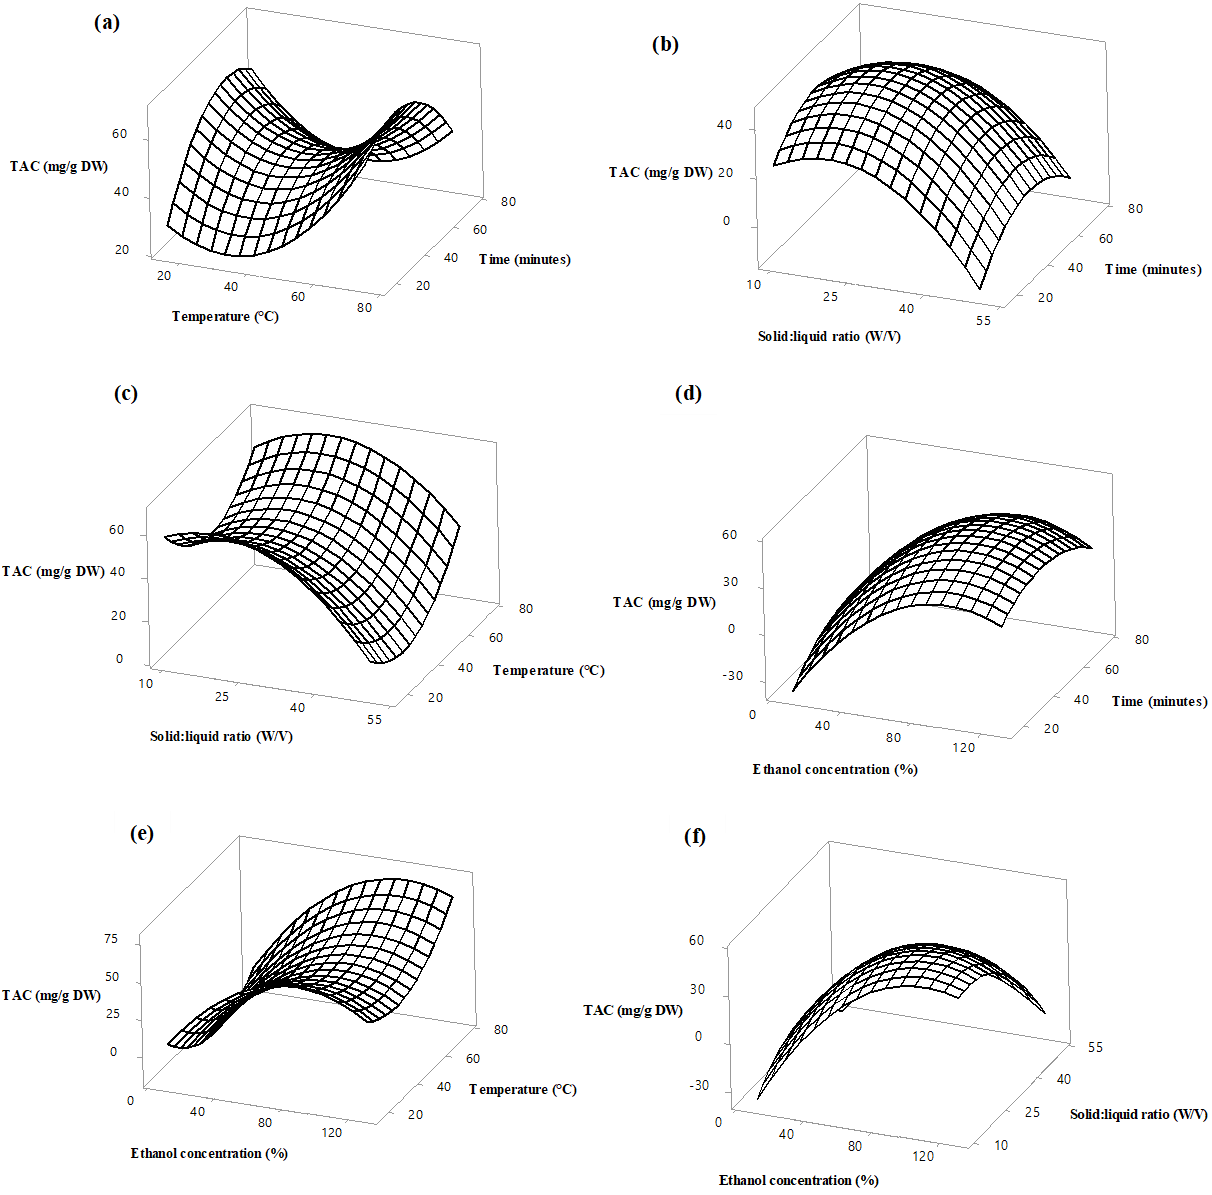
Figure 2. Response surface plots of anthocyanin (µg cyanidin-3-glucoside /g DW) extraction from Azadirachta indica flower as a function of solid to liquid ratio, ethanol concentration, extraction temperature and time. Values were kept constant as follows, Temperature 45 °C, ethanol concentration 70%, Extraction time 45 minutes and solid to liquid ratio 1:30.
Data from the current study shows that the TAC of the flower samples varied from 0.1 to 90.84 µg cy-3-glu/g DW. As noted in Figure 2 (a), the yield of anthocyanins has increased at temperatures more than 40 °C and at extraction times less than 40 minutes. A close result was documented by Rababah et al. (2010) where the highest yield of anthocyanins extracted from thyme using distilled water as a solvent was achieved at 60 °C. However, at very high temperatures, anthocyanins are thermally degraded, for example, 3-O-sambubiose and cyanidin 3-O-sambubiose are degraded to gallic acid and protective acids, leading to a lower yield (Yuniati et al., 2021). As illustrated in Figure 2 (b), the TAC has increased from 0.1 to 26.72 µg cy-3-glu/g DW when varying the ethanol concentration from 20% to 80%. A steady reduction in the TAC was observed when increasing the ethanol concentration further. The optimum ethanol percentage for anthocyanin extraction depends on the composition of anthocyanins present in the flower matrix. The presence of higher content of hydrophilic anthocyanins requires lower percentage of ethanol for extraction. A similar trend was observed with the variation in the solid to liquid ratio from 1: 10 to 1:25. This could be partially explained by the fact that, while increasing the volume of the solvent, high distribution coefficient and high density gradient is established thereby increasing the TAC until a threshold value. Upon further increase, due to lower solute weight and lower density of extracted anthocyanins, TAC showed a steady reduction (Khazaei et al., 2016). The findings on anthocyanin extraction from the present work were in line with the previous reports. For example, the optimum solid:liquid ratio for anthocyanin extraction from purple sweet potato and blue butterfly pea flowers was found to be 1:32, 1:23, respectively (Fan et al., 2008; Pham et al., 2019).
Effect of extraction variables on DPPH radical scavenging activity
The beneficial effect of extracting phenolics and anthocyanins is attributed to their antioxidant activity. Phenolics present in flower matrix could exhibit antioxidant activity by scavenging radicals or by acting as reducing agent or by inhibiting enzyme activities. In the present study, in-vitro antioxidant activity was determined by DPPH radical scavenging activity and linear effects of solid to liquid ratio and ethanol concentration were found to be significantly (p<0.05) affecting the antioxidant activity. Among the quadratic effects of all the factors, ethanol concentration and extraction time significantly affected the antioxidant activity. The model obtained by fitting the second order polynomial equation is shown below (Eq.6). As per the results obtained from ANOVA, the model p value was 0.001 and p value for lack of fit was 0.14 indicating the acceptability and predictive capacity of the model.
(6)
DPPH radical scavenging activity of the extracts varied from 0.99 to 42.25% with the highest and lowest activity noted in experimental runs 11 and 21, respectively. As shown in Figure 3 (a), the radical scavenging activity has increased upto 45 °C and declined gradually, while increasing the temperature further. As illustrated in Figure 3 (c) and (d), the maximum radical scavenging activity was observed at the lowest ethanol concentration and the lowest solid:liquid ratio. As mentioned below, similar results were reported by researchers previously, while optimizing DPPH radical scavenging activity for various plant matrix. Investigations by Hernández‐Carranza et al., (2016) have revealed that DPPH radical scavenging activity of banana peel extracts were maximum at 45 °C, activity of Malva parviflora leaves were maximum at a lower solidto liquid ratio (Abd El-Salam et al., 2019).
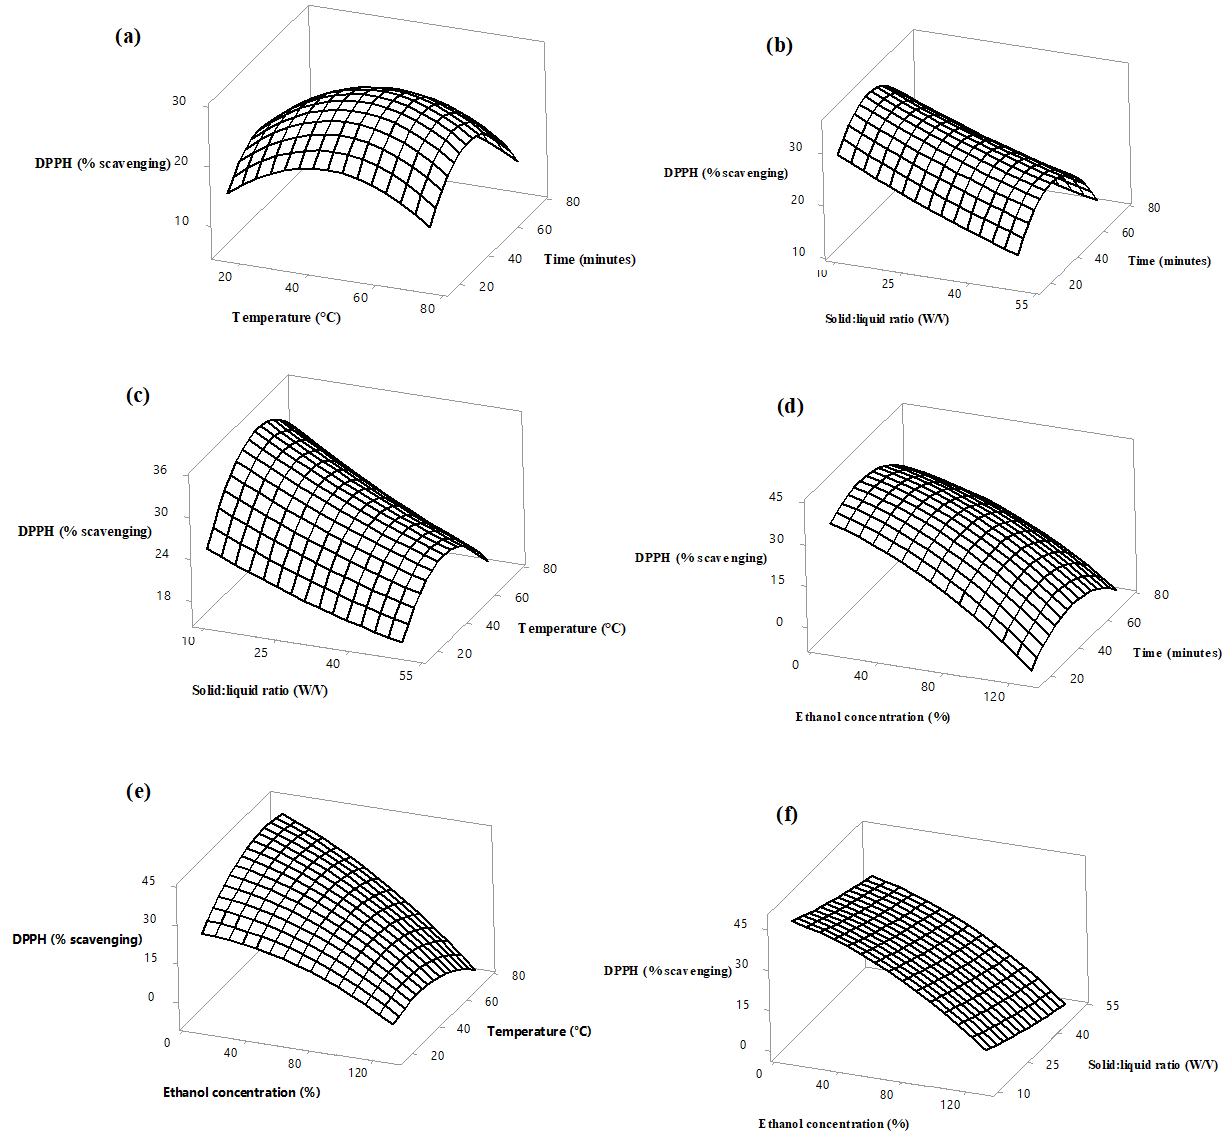
Figure 3. Response surface plots of DPPH radical scavenging activity (% scavenging) of Azadirachta indica flowers as a function of solid to liquid ratio, ethanol concentration, extraction temperature and time. Values were kept constant as follows, Temperature 45 °C, ethanol concentration 70%, Extraction time 45 minutes and solid to liquid ratio 1:30.
Optimization of process variables and model validation
The optimal extraction condition was obtained by using the desirability function approach on the Minitab statistical software after determining the multifactor analysis of variance and the second order model prediction. The optimal conditions were obtained using the desirability function in the scale of 0-1. The desirability value of 1 represents the ideal case and 0 indicates that one or more responses fall outside the desirable range. The generated optimum conditions for maximum TPC and TAC with maximum radical scavenging activity was 42.72% ethanol, 1:30.2 solid to liquid ratio at extraction temperature of 55 °C and time 39.25 minutes. The fitted polynomial equation was then expressed in the form of three-dimensional surface plots in order to illustrate the relationship between responses and the experimental variables used. An experimental run was conducted with the recommended optimum conditions and the obtained responses were compared with the predicted values to study the appropriateness of the response models. The obtained values are presented in Table 3. There was no statistically significant (p>0.05) difference between the predicted and experimental values at 95% confidence interval. The outcomes indicate the reliability of the parameters for the extraction of phenolics and anthocyanins with maximum antioxidant activity from A. indicata flowers.
Table 3. Predicted and experimental values of responses under optimum conditions for simultaneous optimization of responses
4. Conclusion
Optimized conditions to enhance the recovery of phenolics and anthocyanins from A. indica flowers along with optimum radical scavenging activity were successfully examined using RSM. Satisfactory ANOVA and descriptive statistics parameters indicate that the generated RSM based second-order polynomial models were adequate to optimize the ethanol-based extraction of antioxidant compounds. The optimum conditions obtained were: solid:liquid ratio 1:32.2, ethanol concentration 42.72%, extraction temperature 55 °C and time 39.25 minutes. The findings of the current study may be utilized to further isolate and fractionate phenolic compounds from A. indica flowers that are suitable for the application in food industry and pharmaceutical analysis.
Author Contributions: G. Janarny performed all the experiments, analyzed the data, and wrote the first draft. KDPP Gunathilake and KKDS Ranaweera contributed to the supervision, fund acquisition, designing of the experiments, and proofreading of the manuscript.
Funding: This research was funded by National Research Council of Sri Lanka (Grant no: NRC 19-033).
Conflicts of Interest: The authors declare no conflict of interest.