INTRODUCTION
Customer-based brand equity in the tourism destination context has recently gained special attention in the hospitality and tourism industry (Cervova & Vavrova, 2021; Im et al., 2012; Gartner & Ruzzier, 2011; Lim et al., 2014; Saeed & Shafique, 2019). Notably, the concept of brand equity was studied not only to the service industry but also to the tourism service and hospitality industry, as demonstrated by research conducted by Ekinci et al., (2022); Kim & Lee, (2018).
Chi et al., (2020); Lim et al., (2014); Zhang et al., (2020a) evaluated and validated the customer-based perspective on brand equity elements for a tourism destination. This conceptual framework consisting of four main constructs namely, recognition, image, tourists’ perceptions of service quality, as well loyalty to brand. Aaker (1991) pointed out that customer-based perspective on brand equity components consisting of brand recognition, perception of quality, brand association, and loyalty to brand. Similarly, Kladou et al., (2015) also indicated that brand awareness/recognition, perception of quality, brand associations, and brand assets constructs provide a value to the business by increasing tourist brand loyalty. Keller (1993) divided the brand equity elements into two categories consisting of brand awareness which is referred to as memory recognition and recall performance; the image of brand is referred to as a system of associations. In general, Chen & Tseng (2010); Cambra-Fierro et al., (2021) identified that the customer-based brand equity elements consisting of four constructs namely, brand recognition, perception of service quality, image of band, as well brand loyalty. Meanwhile, Chen & Myagmarsuren (2010); Kusumaningrum (2021) claimed that tourism destination brand equity is the perception of equity including destination brand recognition, brand image of the destination, perception of quality, and loyalty to tourism destination brand as one the consequences of perception of brand equity. A review of the past research indicated that brand equity of touirsm destination is multi-dimensional and complex with various elements which work together and contributes toward the overall equity of tourism destination brand (Fang, 2021; Kaushal et al., 2018). Furthermore, Chi et al., (2020) Ergün et al., (2022) indicated that few studies investigate the components of tourism destination brand equity. Therefore, the brand equity of a tourism destination should be combined by a series of significant elements (Shi et al., 2022).
In addition, Ghafari et al., (2017) developed a brand equity model for tourism destination consisting of brand awareness, perception of uniqueness of brand, perception of quality, perceived value of destination brand, image of destination brand, reputation, brand satisfaction, as well loyalty to destination brand, in which loyalty to brand is the core construct of brand equity as well as the customer-based brand equity which could positive increase intention to travel to a specific destination (Zhang et al., 2020a). Previous studies have shown that an increasingly large number of tourism behaviour studies have evaluated and validated the intention to travel through the theory of planned behavior, and the various theoretical frameworks (Han et al., 2020). Chi, et al., (2020) claimed that brand equity of tourism destination prominent impacts on travel intention from the
perspective of international tourists traveling to Viet Nam. However, very few tourism studies have evaluated the integration between the constructs of tourism destination brand equity, travel intention, and other latent variables constructs in the same study (Shi et al., 2022; Zhang et al., 2020a). Therefore, the current research incorporates all of the above-mentioned constructs in a new brand equity of tourism destination model to evaluate and validate the causal relationships among new destination brand equity elements and the intention to travel to Dong Thap province, as a case study.
Dong Thap is one of provinces in the Mekong Delta Region, with many beautiful, poetic, and lyrical natural sceneries that still retain original features, long-standing historical traditions, many distinctive cultural, and hospitality spirit of the local people appeal to tourists (Dong Thap Department of Culture, Sports and Tourism, 2021). Thus, the province has a lot of significant potential for appealing tourist. The statistics show that number of domestic tourist arrivals in Dong Thap has been increasing each year. Especially in 2019, the province welcomed and served 3.95 million tourist arrivals, including 3.86 million domestic tourist arrivals, with a turnover of 1,051 billion VND (Department of Culture, Sport and Tourism Dong Thap, 2021). Due to the COVID-19 pandemic, the number of domestic visitors to this province has decreased rapidly in recent months. Although, Dong Thap welcomed about 100,000 domestic visitor arrivals in the first six months of 2021 (Vietnam National Administration of Tourism, 2021). Domestic tourism is crucial to developing local tourism and promoting economic recovery and growth after the pandemic. Despite this, there have been few studies focusing on travel intentions of domestic tourists (Shekari & Azizi, 2021). Therefore, it is necessary to evaluate and validate the interrelationship between the brand equity of tourism destination based on the pointview of domestic tourist and the causal relationship between destination brand equity and the willingness to travel, which is a vital tool for evaluating the likelihood to visit or return to a destination (Pike & Bianchi, 2013) and as an advantage for local authorities in efficaciously building a brand equity of tourism destination become more attractive and competitive (Ergün et al., 2022). The results of this study have a positive contribution to provide the basis for this province’s focus on building tourism marketing strategies to boost domestic tourism in the future.
After reviewing the previous research and empirical studies, the current study attempted to expand the existing research gaps of destination brand equity components from the domestic tourists’s perspective to gain an insight into understanding of overall brand equity of destination. The current study has a number of contributions to the literature by providing major findings related to the interrelationship between tourism destination of brand equity and the intention to travel of domestic tourists. The outcomes of the current study conclued that the brand equity of a tourist destination played a prominent role in increasing the likelihood to travel to Dong Thap province which are of prominent in developing effective marketing strategies to boost domestic tourism. In other words, the major purpose of current study emphasized the need for multiple studies to validate the causal relationships among the constructs of destination brand equity and validate the causal relationship between the constructs of destination brand equity and the likelihood to travel from a domestic tourist’s perspective to increase travel intention in Dong Thap province. Hence, the aim of the current study attempts to prominent understand a nine-dimensional destination brand equity from domestic tourists’ perspective, especially to fulfil the existed gaps in the literature on dimensions of destination brand equity.
In summary, the current study aims to generate a new in-sight conceptual framework of tourism destination brand equity which is focused on three main aspects: (1) the causal relationships among new destination brand equity model, (2) brand loyalty as a core component of destination brand equity, and (3) the interrelationship between new destination brand equity, and the likelihood to travel. The study is organized as follows: the ‘literature review’ section describes the new conceptual and theoretical framework of destination brand equity and the likelihood to travel, justifying these hypotheses and theoretical model; the ‘empirical study’ section outlines the research method of the current study, the context of the empirical study; the ‘analysis result’ section highlights and discusses the key findings, finally suggesting practical implications, research limitations, and recommendations for further research.
The intention referred as a tourist’s beliefs, feelings, thoughts and emotional behavior in a specific situation (Hashim et al., 2018). The term “Travel intention or the likelihood to travel” refers to a kind of tourist behavior intention (Jang et al., 2009), the behaviour intention of tourist to a destination refers to the likelihood to visit the certain destination (Chen et al., 2014; Irfan et al., 2022) or decision to visit a specific destination (Talwar et al., 2022). Travel intention emphasized the intention to travel or the likelihood to travel to a specific destination (Jang et al., 2009; Khan et al., 2018; Makhdoomi & Baba, 2019; Rastegar et al., 2021). Travel intention is also defined as tourist’s desire or the likelihood to travel (Luo & Lam, 2020). Chi et al., (2020) claimed that the likelihood to travel will be prominent influenced by the brand equity of destination components. Previous studies noted that high brand equity leads to a higher intention to travel (Zhang et al., 2020a). Horng et al., (2012); Ergün et al., (2022) evaluated and validated the impact of brand equity theory on travel intention, and claimed that the elements of tourism destination brand equity have a positive contribution to the travel intention.
Brand equity
Aaker (1991) defined the equity of brand as a system of key intangible business assets and company liabilities associated to a brand name, and iconic brand symbol, in which the value level of brand is provided by a particular product, commodity, or service. Keller (2013) indicated that brand equity as the strong of a brand lies in what customers have heard, felt, belief, seen, thought and learned more about the business brand as customers past experiences in purchasing. Capon et al., (2001) introduced two concepts of brand equity consisting of firm-based perspective on brand equity, and brand equity from customer point of view. However, Saeed & Shafique, (2019) argued that brand equity falls into three important categories consisting of financial/ business, brand equity from sales perspective, and brand equity from customer perspective. The term “Firm-based perspective on brand equity” referred to the cash flows, financial, monetary value created by the firm brand. Whereas brand equity from customer perspective relates to the perceptive value of customers about a specific product, commodity, or service, which is compared with the perception of value of unbranded product, commodity, or service of competitors (Capon et al., 2001). Sales- based perception on brand equity (SBBE) concept is referred to the brand volume or market share aspects (Datta et al., 2017). One of the best widespread accepted definitions of brand equity from customer perspective was considered to propose a specific measurement scale for tourism destinations (Ghafari et al., 2017).
Destination Brand Equity
The consumer-based destination brand equity is the combination of the prominent elements that can be referred to as the overall value of a goods or services that tourists/ customers experienced during the holiday trip to the specific destination which distinguishes the destination feature from the other destinations (Ferns & Walls, 2012; Ibrahim & Elborsaly, 2022). Fang (2021) claimed that overall brand equity is referred to as superior, the strength of a destination brand when compared with other destination competitors. Additionally, Liu et al., (2015); Saeed & Shafique (2019) agreed that equity of brand from customer perspective has been widely discussed and applied in the tourism and hospitality industry context. Huerta-Álvarez et al., (2020) confirmed that consumer-based destination brand equity plays a prominent role in both terms of tourism destination features, segmentations as well as in increasing tourist intention behaviour, thus the company’s revenue will increase from the brand. Thus, the brand equity of destination is a concept of brand equity developed based on the concept of customer- based perspective on brand equity and applied to tourism destination (Kusumaningrum, 2021).
Chekalina et al., (2018) indicated that the brand equity from customer perspective model should be adapted and applied in a tourism destination context to an insight into understanding of the complexity of relationships within each construct in the model. Therefore, Vinh Trung Tran et al., (2019); Ergün et al., (2022) employed destination brand equity components by using four factors consisting of brand recognition/ awareness, perception of quality, image of brand, as well the loyalty to brand. Zhang et al., (2021) argued that the measurement of the brand equity of destination consisting of brand quality, brand recognition/ awareness, image of brand, perceived value of brand, and loyalty to brand. While, Kheiri et al., (2016) found that brand equity of tourism destination components consisting of destination recognition, brand image of destination, perceived destination quality, perception of value, loyalty to destination, and brand satisfaction. Ghafari et al., (2017) revealed that brand equity of tourism destination consisting of eight elements, namely brand recognition, brand uniqueness, perception of quality, value of brand, destination image of brand, reputation of brand, brand satisfaction, and loyalty to brand. Whereas, the tourism destination brand equity model has seven dimensions consistings of brand recognition, tourist’s destination quality perception, brand interaction quality, brand self- congruence, brand identity, destination brand trust, and destination brand loyalty (Ekinci et al., 2022). The destination brand equity components presented in the previous studies provide an insight into understanding of destination brand equity within a tourism destination context (Ergün et al., 2022; Im et al., 2012).
Ekinci et al., (2022); Hsu & Cai (2009); Marliawati & Cahyaningdyah (2020) found that the loyalty to brand construct is the consequence of the trust of brand, and brand awareness, in turn, the trust of brand could be stronger than for repeating tourists because of the higher level of brand familiarity to a specific destination. Thus, brand trust appears to be a vital determinant of brand loyalty because brand trust creates the causal relationships that are highly valued (Munuera-Aleman et al., 2003; Zhang et al., 2020b). Additionally, Tan et al., (2022); Wong (2018) claimed that satisfaction of brand, and reputation of brand constructs play a prominent role in building customer-based perspective on the equity of brand. By inserting the new brand reputation, brand trust constructs in the brand equity destination model can also comprehensively understand the brand equity model, thus, destination brand equity should include brand reputation (Fang, 2021) which is created by familiarity with brand and uniqueness (it means that the unique, different, and no substitute) (Cambra-Fierro et al., 2021; Kapferer, 2008). Moreover, each destination has unique characteristics and different environments (Xue et al., 2022). Thus, A brand unique can increase equity of brand and create an advantage of competition for the tourism destination brand (Horng et al., 2012; Górska-Warsewicz, 2020). A modified tourism destination brand equity model was formulated which covered the variables factors of brand recognition, quality of brand, perceived value of brand, trust of brand, brand satisfaction, and loyalty to brand (Dedeoğlu et al., 2019). Collectively, brand equity of tourism destination elements consisting of nine dimensions in the current study including loyalty to brand, brand awareness, perception of quality, the image of tourism destination brand which is consistent with the study of Aaker (1991); brand uniqueness, brand reputation, brand satisfaction, the brand value which is consistent with a study of Ghafari et al., (2017); brand trust which is supported from the study of Hsu & Cai (2009); Cardoso et al., 2022 which have been broadly supported and developed by many previous researchers (Chi et al., 2020; Fang, 2021; Horng et al., 2012). This
indicated that the existent research gaps in the previous studies of tourism destination brand equity and the tourism destination brand equity constructs is revealed in the current study. Hence, the current study aims to fulfil the existing research gaps by developing novel conceptual model, and by validating the causal relationship between brand equity of destination components based on the domestic tourist perspective and the willingness to travel. Inconclusion, the important variables constructs are inserting into the destination brand equity model are consistent with previous destination brand equity studies of Chi et al., (2020); Fang, (2021); Horng et al., (2012); Ghafari et al., (2017)
The proposed model and research hypotheses
Chi et al., (2020); Horng et al., (2012) investigated how brand equity elements positively increases the intention to travel. Zhang et al., (2020a) acknowledged that the equity of tourism destination brand depends on the unique features of the destination, and may positively and significantly influence the likelihood to travel. Saeed & Shafique (2019) confirmed that the brand quality of destination components positively affects the destination visit behavior. Ergün et al., (2022); Thi et al., (2014) revealed that image of brand, brand recognition, and loyalty to destination brand respectively predicted the likelihood to travel. Ergün et al., (2022); Horng et al., (2012); Ferns & Walls, (2012) concluded that the equity of brand has a positively and directly affected the likelihood to travel. Thus, enhancing the loyalty to brand, through increased the likelihood to travel, has become the most important goal for local government (Bianchi & Pike, 2011; Vinh Trung Tran et al., 2019). Boo et al., (2009); Ergün et al., (2022); Konecnik & Gartner (2007) developed and extended the brand equity from customer perspective in the tourism destination and hospitality context to evaluate and validate the causal relationship among brand recognition, image of destination brand, perception of quality, perceived value of destination brand, loyalty to brand; and to explore the total effects of overall brand equity of destination on the likelihood to travel (Zhang et al., 2020a). Abruruman et al., (2020) employed four constructs of destination brand equity as perceived quality, awareness of brand, loyalty to brand, and brand association, which have a statistically and significantly impact on the likelihood to visit to a specific destination.
Based on the new equity of destination brand theory, the current study applied nine components of brand equity to validate the causal relationships among them and evaluate the interrelationship between the new brand equity of destination elements with the likelihoo to travel to Dong Thap province as a case study. Accordingly, the new brand equity of destination model is shown in figure 1.
Figure 1: The proposed framework model
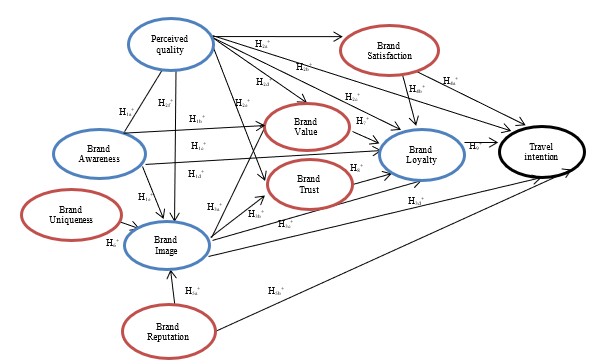
(Source: author, 2021)
Awareness of brand referred to the ability of potential tourists to be awared of a destination brand (Aaker, 1991). Awareness of brand is referred to an essential construct of brand equity in hospitality industry, tourism destination and the travel decision (Boo et al., 2009; Chi et al., 2020). Awareness is as a very prominent equity of brand elements because of the first step in creating and enhancing the value of destination brand (Ergün, et al., 2022; Gartner & Ruzzier, 2011). Additionally, Ghafari et al., (2017) indicated that the recognition of brand has positively and significantly influenced on the image of brand. A tourist’s recognition of brand and favourable perceptions of the image of destination and perception of tourism service quality can lead
to visiting or suggesting a certain destination to friends and relatives (Konecnik & Gartner, 2007; Zhang et al., 2020a). Bernarto et al., (2020); Dedeoğlu et al., (2019) claimed that the awareness of brand has positively and directly affected the quality of brand. Besides, Bernarto et al., (2020); Lee & Jee (2016) found that brand awareness also positively and significantly affects brand trust. Trust of brand is referred to as a tourist’s belief regarding to the perception of the ability of the tourism destination brand to deliver its promises and adapt or overcome the tourist’s service expectations built from the fundamental knowledge of the tourism destination brand (Althuwaini, 2022; Hsu & Cai, 2009). The following hypotheses were made in this study:
H +: brand awareness will have positive influence on perception of quality
1a
H +: brand awareness will have positive influence on the value of brand
H +: brand awareness will have positive influence on the loyalty of brand
H +: brand awareness will have positive influence on brand trust
H +: brand awareness will have positive influence on brand image
Perception of tourism service quality can be defined as the tourist’s evaluation of the overall service quality or excellence of a tourism service product or tourism service concerning its intention to purpose, relation to one or more alternatives (Aaker, 1991); brand tourism service quality is perceived by tourists (Yoo et al., 2000). Lee & Jee (2016); Vo et al., (2022) found that perception of tourism service quality has affected brand trust significantly. Ghafari et al., (2017) also indicated that perception of tourism service quality has positively and significantly impacted on the value of the brand, brand destination satisfaction, and loyalty of destination brand. Brand value is defined as the tourist selection of a tourism destination depending on a perception balance between the added monetary value of the utility of a product or service (Boo et al., 2009; Vo et al., 2022). Brand satisfaction is regarded as the superior brand outcome of the subjective evaluation that the alternative brand could reach or exceed tourists’ expectations (Chatzigeorgiou & Christou, 2016; Chen et al., 2020b). The loyalty to brand is a measure of the attachment that a tourist has to a brand of destination (Aaker, 1991). Besides, perception of service quality has a significantly and positively affected both image of destination and the loyalty to brand (Alhaddad, 2015; Dam & Dam, 2021). Destination brand image is referred to as the perception of brand as reflection of the brand association held in the tourist memory (Keller, 1993; Majeed et al., 2022). Abruruman et al., (2020) claimed that perceived tourism service quality has a statistically and positively relationship with the lieklihood to travel to a specific destination. The following hypotheses were made in this study:
H +: perceived quality will have positive influence on brand satisfaction
H +: perceived quality will have positive influence on travel intention
H +: perceived quality will have positive influence on brand loyalty
2c
H +: perceived quality will have positive influence on value of brand
2d
H +: perceived quality will have positive influence on trust of brand
H +: perceived quality will have positive influence on brand image
The image of brand is also a prominent component of tourism destination brand equity models (Majeed et al., 2022; Saeed & Shafique, 2019). Ghafari et al., (2017) indicated brand image has positively and significantly influenced on the loyalty to brand and the value of brand. Hassan et al., (2021); Tan et al., (2011) confirmed that image of brand has directly and positively impacted brand trust. Althuwaini, (2022); Lee & Jee (2016) found that image of brand has a significantly impacted on the destination brand trust and loyalty to brand. Chi et al., (2020) confirmed that image of brand has a directly and positively affected travel intention. The following hypotheses were made in this study:
H +: The brand image will have positive influence on brand value
3a
H +: The brand image will have positive influence on brand trust
H +: The brand image will have positive influence on loyalty to brand
H +: The brand image will have positive influence on the likelihood to travel
In tourism research, tourist behaviour intention has been measured as the likelihood to re/visit, suggestions to others, willingness to pay (Kim et al., 2009). Tourist intention literally emphasizes a tourist’s willingness to travel or commitment to visit (Rastegar et al., 2021), and the subjective probability of whether a tourist is likely to do or not perform certain actions; the tourist intention is one of the antecedents of the actual tourist behaviour and is a prominent indicator in understading tourist (Büyükdağ, 2021). Bae et al., (2020); Ghafari et al., (2017); Kim et al., (2021 ) San Martín et al., (2019) indicated that destination brand satisfaction has a significant positive impact on brand loyalty. Brand satisfaction has a positively and significantly impacted on travel intentions (Baker & Crompton, 2000; Ratnasari et al., 2021). The following hypotheses were made in this study:
H +: brand satisfaction will have positive influence on travel intention
H +: brand satisfaction will have positive influence on brand loyalty
Brand reputation referred to an individual evaluation of the overall value, and the features of a certain destination by the stakeholders based on a complex marketing resource (Fang, 2021). Ghafari et al., (2017) indicated brand reputation has significantly and positively affected the image of brand. Foroudi et al., (2021) explored the interrelationship among the image
of brand, reputation of brand, and travel intention. Travel intention represents the extent of the likelihood to do or will not to perform a particular behaviour (Ajzen, 1991). Behavior intention means the likelihood to visit the destination in the future (Joo et al., 2020). The following hypotheses were made in this study:
H +: brand reputation will have positive influence on destination brand image
5a
H +: brand reputation will have positive influence on travel intention
The uniqueness of destination brand is defined as the tourist’s degree to feel the brand of destination is different from the brand of the competitive destinations, and how to distinct it is linked to competitive destinations (Netemeyer et al., 2004; Rahman et al., 2021). Büyükdağ, (2021); Salniza et al., (2016) found a significantly and positively relationship between the uniqueness characteristics of brand and tourism destination image of brand. Ghafari et al., (2017) also indicated brand uniqueness significantly and positively affects the destination image of brand. Thus, the following hypotheses were made in this study:
H +: brand uniqueness will have positive influence on brand image
Dedeoğlu et al., (2019) indicated that several significant factors such as perception of tourism service quality, value of tourism destination brand, brand trust, and satisfaction have a positively and significantly affected the loyalty of destination brand. Ghafari et al., (2017) claimed that there is a significantly and positively relationship between brand value and loyalty to brand. In this study, the following hypotheses was made:
H +: brand value will have positive influence on brand loyalty
The brand trust would be significantly and positively linked to the loyalty of brand (Alhaddad, 2015; Cardoso et al., 2022; Munuera-Aleman et al., 2003) and brand trust will respectively enhance brand loyalty (Al-Hawary, 2013; Althuwaini, 2022). Marliawati & Cahyaningdyah (2020); Tan et al., (2011) claimed that brand trust is positively related to brand loyalty. In this study, the following hypotheses was made:
H +: brand trust will have positive influence on brand loyalty
The loyalty to brand is one of the core dimensions of brand equity (Qiao et al., 2022), and it indicates to the attitude of visit intention and willingness to pay more for a preferred tourism product or tourism service (Horng et al., 2012; Ergün et al., 2022). Büyükdağ (2021); Hsu & Cai (2009) defined brand loyalty as the likelihood to visit a certain destination and to suggest others visit the same destination. Abruruman et al., (2020); Büyükdağ (2021); Chi et al., (2020) claimed that brand loyalty has a statistically and significantly relationship affected the intention to travel. Based on this following hypothesis is proposed in this study:
H +: brand loyalty will have positive influence on travel intention
Thus, nine research hypotheses are proposed in this study to evaluate and validate the causal relationships between the components of tourism destination brand equity and the likelihood to travel.
The current study applied nine latent variables constructs of brand equity of tourism destination to evaluate and validate the causal relationships among them with travel intention to Dong Thap. For this purpose, the first section was qualitative research in which the author focuses on interviewing with 8 experts who are a manager at tour operator to adjust and improve the measurement scales, followed by focusing on group discussion with volunteer tourists to discuss a specific topic of interest, to adjust and improve the measurement scales and to develop and to complete a research question. A total of 10 volunteer tourists were willingness to particpate in the interview. The completed questionnaire officially is used to evaluate nine constructs of brand equity and travel intention containing the items as shown in Table 1. In the second section, the new proposed framework conceptual model is evaluated by the using of a statistical modeling technique based on the partial least squares (PLS-SEM) to validate the proposed model to prove the hypothesis, positive relationship of construct.
First, to achieve the purpose of this study, 60 domestic tourists who had visited Dong Thap province during the summer season were selected for the pilot survey to evaluate the validity and reliability of all variables constructs through focus on the face-to- face interview technique at Xeo Quyt Village restaurant, in Dong Thap province is primarily the ease of access. After the pilot test, a few minor changes in the completed survey questionnaire were made (shown in table 1). Additionally, the survey data were collected via an indirect survey in collaboration with 5 famous travel agents specializing in organizing tours to Dong Thap province. The sample selection of visitors who has selected Dong Thap province for their holiday vacations. The second, survey took place from March 1 st, 2021 to the end of May 3 rd, 2021. This is because the total number of tourists visiting and traveling in Dong Thap was 100,000 arrivals in the first six months of 2021 (Vietnam National Administration of Tourism, 2021). After
fully explaining to them the purpose of the study, the tour guides will send directly the questionnaire survey to domestic tourists to survey and then collect the responses after the trip.
The purpose of this survey was to gain domestics perspectives on the tourism destination brand equity construct, and to explore domestic tourist intention as defined in the initial measurement list adapted and developed from the previous literature. Thus, the qualitative methods are conducted for this purpose. Tao et al., (2022) claimed that quantitative approaches are using for data examination, hypothesis in the overall model test.
According to Hair et al., (1995), the minimum sample size should be at least p x 5, where p is the number of independent variables in the final model to have an accurately representation of the whole population. As there are total of 40 observed variables constructs are used in the current study, the minimum sample size should be required at least 200. Based on the formula of Burns & Bush (2006), a reasonable sample size of 385 participants was determined at a 95% confidence level with 95% desired accuracy. Thus, the suggested minimum sample size in this study was 385 respondents. However, to ensure high acceptable level of reliability and confidence levels, the sample was made up of 700 domestic tourists. A total of 632 responses were collected out of 700 questionnaires distributed. However, 34 of them were invalids because of too many unfilled items. The final sample consists of 598 usable questionnaires for factor analysis, representing 94.62%, which is sufficient for analysing structural models by using the Partial Least Squares Structural Equation Modelling analysis as followed by Hair et al., (2017).
Measurement scales
The scale consisted of two parts: The construct of brand equity of destination consisting of ten components: loyalty to brand, brand awareness, perception of quality, image of brand, brand uniqueness, brand reputation, brand satisfaction, brand value, brand trust, travel intention, and visitor demographic information. Personalities and demographic characteristics are used to show in the current study consisting of age group, gender, and level of education qualifications. In total, there were 40 items, measured on a 5-point Likert scale to measure attitudes and opinions ranging from 1 being strongly disagree to 5 being strongly agree. The current study adopted the scales based on the results of the primary research and a review of the previous literature is shown in table 1. All of the survey questions or items were tested to ensure the validity and reliability of the measurement scales.
Table 1: Measurement scales
Code Measurement scales Authors Decision Brand Uniqueness (Bunique)
BU1 Dong Thap province is very different from other destinations. Ghafari et al., (2017) Support
BU2 The uniqueness of Dong Thap province tourism attractions is fascinating.
Ghafari et al., (2017) Support
BU3 Dong Thap province has unique local customs and traditions. Ghafari et al., (2017) Support
BU4 Dong Thap province stands out from other competitor prov- inces.
Ghafari et al., (2017) Support
Brand Reputation (Breputa)
BR1 Dong Thap is a reputable tourism destination Ghafari et al., (2017); Verissimo et al., (2017)
Support
BR2 Dong Thap is well known as a tourism destination Ghafari et al., (2017) Support
BR3 Dong Thap is highly regarded Chatzipanagiotou et al., (2019); Fang (2021)
Support
BR4 Dong Thap has status as a tourism destination Fang (2021) Support
Brand Image (Image)
BI1 Dong Thap fits my personality Pike et al., (2010);
Vinh Trung Tran et al., (2019)
BI2 The brand image of Dong Thap is accordant with my self-image Pike at al., (2010);
Vinh Trung Tran et al., (2019)
BI3 I thought my friends would think I visited Dong Thap Chi et al., (2020);
Pike et al., (2010)
BI4 Visiting Dong Thap reflects who I am Boo et al., (2009); Chi et al., (2020)
Support Support Support Support
Brand Awareness (Baware)
BA1 I can distinguish what Dong Thap looks like in my mind Chi et al., (2020) Support
BA2 I think i can distinguish Dong Thap among other similar travel destinations
Chi et al., (2020); Nwobodo (2020)
Support
Code Measurement scales Authors Decision
BA3 The features of Dong Thap spring quickly to my mind Chi et al., (2020);
Vinh Trung Tran et al., (2019)
Support
BA4 When I think to travel, Dong Thap comes immediately to my mind
Perceived quality (Quality)
PQ1 Dong Thap provides tourism product offerings of consistent
quality
Chi et al., (2020);
Vinh Trung Tran et al., (2019)
Chi et al., (2020); Zhang et al., (2021)
Support
Support
PQ2 Dong Thap provides a good perception of quality experiences Chi et al., (2020);
Zhang et al., (2021)
Support
PQ3 From Dong Thap ‘s offerings, I can expect superior service
quality performance
Chi et al., (2020) Support
PQ4 Dong Thap performs better service quality than other similar tourism destinations
Brand value (Value)
Chi et al., (2020); Zhang et al., (2021)
Support
BV1 Dong Thap has affordable prices Boo et al., (2009); Pike & Bianchi (2013)
Support
BV2 I would like to consider what I would pay for a holiday trip; I will get much more than my value by visiting Dong Thap
BV3 The costs of holiday trip to Dong Thap are a bargain associated
with the benefits I receive
Boo et al., (2009); Pike & Bianchi (2013)
Boo et al., (2009); Pike & Bianchi (2013)
Support Support
BV4 Visiting Dong Thap is economical Boo et al., (2009) Support
Brand Trust (Btrust)
BT1 The businesses in Dong Thap care about visitors’ interests. Dedeoğlu et al., (2019) Support BT2 Dong Thap is a trustworthy tourism destination. Ghafari et al., (2017) Support
BT3 I feel that Dong Thap has a name I can believe Chatzipanagiotou et al., (2019);
Fang (2021)
Support
BT4 I have confidence in Dong Thap Dedeoğlu et al., (2019) Support
Brand Satisfaction (Bsatis)
BS1 Dong Thap is much better than what I expected Ghafari et al., (2017) Support BS2 I am very happy with my decision for travelling to Dong Thap Ghafari et al., (2017) Support
BS3 I think that Dong Thap provice service has met my expectations. Ghafari et al., (2017); Büyükdağ
(2021)
Support
BS4 I am satisfied with Dong Thap as a tourist destination. Ghafari et al., (2017) Support
Brand Loyalty (Bloyalty)
BL1 I intend to recommend Dong Thap to my friends and relatives Nwobodo (2020);
Verissimo et al., (2017);
Support
BL2 I will continue to visit Dong Thap in the future Pike et al., (2010) Support
BL3 Dong Thap provides more benefits than other similar destina- tions
Pike at al., (2010); Verissimo et al., (2017)
Support
BL4 Dong Thap would be my first choice for a vacation Nwobodo (2020);
Vinh Trung Tran et al., (2019); Chi et al., (2020);
Support
Travel Intention (C-intent)
TI1 In the near future, I may visit Dong Thap again for holiday va- cation
Chi et al., (2020); Horng et al., (2012)
Support
TI2 I have a strong intention to visit Dong Thap Harun et al., (2018); Zhang et al., (2020a)
TI3 I wish to visit Dong Thap again for tourism Chi et al., (2020); Horng et al., (2012)
Support Support
TI4 I always consider Dong Thap my first choice Chen et al., (2020a) Support
(Source: author, 2021)
There are three questions asked about the personalities and demographic characteristics consisting of age group, gender, and
level of education qualifications. Demographic and personal information collected from the survey are shown in table 2
Table 2: Respondent Characteristics
As regards the composition of the sample, the majority of the domestic tourist agreed to participate in the survey were male (54.3%), and 45.7% were female, between 22-31 years old (45,7%) with a certificate of bachelor (37.8%) - the highest among other educational background in the sample. From this result, the study concluded that domestic tourists who intent to visit Dong Thap province are grouped above 22 years old with a bachelor’s degree. Additionally, Hair et al. (2010); Byrne (2010) argued the normality of the data was supported based on the value of skewness index will range between plus and minus 2 and the value of kurtosis index is ranging between -7 to +7. Table 2 showed that the normality of data was represented, as the standard error of skewness index was between −0.425 and 0.857, and the value of kurtosis index was between −1.976 and + 0.106.
Analysis of results
The results of the assessment of the PLS measurement model include the composite reliability (CR) scores, the values of Cronbach’s Alpha coefficient should be higher than 0.70, and the statistical value of Average variance extracted (AVE) should be respectively greater than 0.50 to establish indicator convergent validity and reliability (Hair et al., 2019). The value of Cronbach’s alpha indicators in this study was above 0.833; all the good values of the composite reliability are higher than 0.889 (Henseler et al., 2016). Thus, the good internal consistency among the variables was accepted, respectively. Additionaly, the statistical value of AVE were required above the minimum cut-off value of 0.666. The result of the study is provided in table 3 stands for the values of the composite reliability indicate the higher than the cut-off criterion that complies with the necessary condition analysis to get supported. Therefore, the reliability of the measurement instrument was accepted respectively.
Table 3: The value of Composite Reliability (CR)
(Source: author, 2021)
The discriminant validity using the PLS approach was shown in table 4. Henseler et al., (2015) presented a decision rule that two criteria are informative about discriminant validity in structural equation modeling: the Fornell-Larcker criterion and the Heterotrait-Monotriat ratio of correlations. The first, the criterion of discriminant validity is exhibited only if all the correlations are statistically and significantly and each of these correlations is higher than all each of correlations. The results of the study shows that as per Fornell-Lacker’s criterion both basic and stringent assumptions are accepted and the criterion of discriminant validity has been established. It is worthwhile to note that the diagonal values (in bold) of the Fornell-Lacker’s table (Table 4) signify the AVE of each construct and each measured construct must have the square root of AVE should be greater than 0.500 (Henseler et al., 2015). Thus, all the variables construct for measurement model meet the criterion of convergent validity.
Table 4: Discriminant Validity
(Source: author, 2021)
The second, table 4 shows the result of the Heterotrait-Monotriat ratio of correlation for evaluating the criteria of the discriminant validity of the measurement model. The analysis confirmed that each latent variable construct in structural equation modeling was discriminated against each other’s that are range between 0.852 and 0.897, which is less than 0.900 since the Heterotrait- Monotriat ratio values claim that lower than 0.900 will be acceptable (Henseler et al., 2015). Therefore, the indicators that were used to measure the variable constructs were used for the respective constructs. In the current study, both the model’s predictive power and the significance of the relationships between the constructs of the structural model were accepted (Figure 2).
Figure 2: Results of the proposed framework
Figure 2 represents that the coefficient of determination (R-square) for the estimation of the equation was obtained 0.803, which is statiscally at a 1 percent level of significance. The R 2 adjusted shows that 0.801 (80.1) percent of the variation in travel intention is explained by the overall of compoments of tourism destination brand equity. The value of R-squared (R 2) is considered from strong to moderate in this study (Hair, et al., 2017). In other words, the investigations results provide strong support for the new proposed model
Discussion
Table 5 revealed the detailed results of bootstrapping statistics for the model. The current study used the bootstrapping method with 5000-re-samples to evaluate and validate the level of significance of the path coefficients between the observed variables constructs (Hair et al., 2017). The significance of the path coefficients (β) in the structural model are provided in Table 5 below.
Table 5: Hypothesis Testing
(Source: author, 2021)
Table 5 showed that the significance of relationship between perception of service quality, and destination brand satisfaction
is supported by H + (β= 0.660, t= 18.989, p< 0.000). H + proposed that brand awareness and brand tourism service quality
have a positively impact on the likelihood to visit was supported (β= 0.607, t= 16.395, p< 0.000). H + proposed that
awareness of brand has a positively contribution to brand value was supported (β= 0.229, t= 5.163, p< 0.000). The H +
postulated that awareness of brand positively and significantly influences on loyalty to brand was accepted (β= 0.180, t=
2.939, p< 0.003). The H + hypothesized that brand recognition has a positively contribution to brand trust was accepted
(β= 0.251, t= 5.195, p< 0.000).
The H + posited that quality of brand has a positively and significantly affected the likelihood to visit was supported (β= 0.350,
2b
t= 7.523, p< 0.000). Quality of brand has a positively contribution to brand loyalty, proposed in H
+ was also supported (β=
0.263, t= 4.272, p< 0.000). The H2d+ postulated that brand quality has a positively affected brand value was accepted (β= 0.442, t= 9.040, p< 0.000). The H2e+ hypothesized that brand quality has a significantly affected brand trust was supported (β= 0.235, t= 4.358, p< 0.000). The H2f+ postulated that tourism destination brand quality has a positively contribution to brand image was accepted (β= 0.482, t= 9.687, p< 0.000).
Brand image has a positively and significantly impact on the value of brand, proposed in H + was also accepted (β= 0.172, t=
3.322, p< 0.001). Brand image has a positively contribution to brand trust, proposed in H + was also supported (β= 0.404, t=
3b
7.604, p< 0.000). Brand image has a positively and significantly impact on brand loyalty, proposed in H3c
+ was also supported
(β= 0.157, t= 3.046, p< 0.002). Brand image has a positively contribution to the likelihood to travel proposed in H + was also
3d
supported (β= 0.171, t= 3.992, p< 0.000). The H4a+ postulated that brand satisfaction has a positively contribution to visit intention was supported (β= 0.134, t= 4.056, p< 0.000). The H4b+ postulated that brand satisfaction has a positively affected loyalty to brand was supported (β= 0.140, t= 2.388, p< 0.017). The H5a+ postulated that brand reputation has a positive affected the brand image was supported (β= 0.090, t= 2.719, p< 0.007). The H5b+ postulated that brand reputation has a positively affected visit intention was supported (β= 0.065, t= 3.378, p< 0.001). Brand uniqueness has a positively and significantly affected brand
image, proposed in H + was also supported (β= 0.119, t= 3.016, p< 0.003). Brand value has a positively and significantly affected the loyalty to brand, proposed in H + was accepted (β= 0.140, t= 2.648, p< 0.008). The results demonstrated a significantly and positively correlation between brand trust and loyalty to brand, proposed in H 8+ was also accepted (β= 0.130; t= 2.440; p< 0.015). Based on the results of Table 5, It can be said that these proposed hypotheses are accepted and valid respectively.
Additionally, the direct influence of five dimensions consisting of (H2b) perception of service quality, (H3d) image of destination brand, (H4a) brand satisfaction, (H5b) brand reputation, and (H 9) brand loyalty on the itention to travel is confirmed respectively. The major finding demonstrates that the brand equity of tourism destination variable has a strong positive influence on likelihood to travel (p<0.05). In summary, the final result of the hypothesis testing with the p-value of each path coefficient from the data analysis signifies that all the proposed hypotheses of this study from H 1 to H 8 are significantly and respectively supported. Thus, the new tourism destination brand equity model is established and it has a positively contribution to travel intention is confirmed, respectively.
Table 6: The Collinearity Statistics
(Source: author, 2021)
The amount of multicollinearity is calculated based on either the value of variance inflation factors (VIF) or the cut-off value of tolerance. If the VIF value is now higher than 4.0 or the value of tolerance is smaller than 0.2 reflects the existence of multicollinearity problem (Hair et al., 2014). The result shown in table 6 indicated that all of the indicators’ inner VIF in the current study are less than 3.0 indicating, ranging from 1.000 to 2.962, indicate no problem of multicollinearity in the proposed model (Hair et al., 2017).
Theoretical Implications
The major findings of this study are as follows. Firstly, the theoretical contributes to the new theoretical of brand equity of tourism destination consisting of nine dimensions such as loyalty to brand, brand awareness, perception of service quality, image of destination, uniqueness of destination brand, brand reputation, brand satisfaction, brand value, and brand trust, which has a statistically and significantly relationship with the likelihood to travel. The major findings of this study were identified nine dimensions of brand equity of destination, which are different from previous brand equity research by Aaker (1991); Büyükdağ (2021); Ergün et al., (2022); Im et al., (2012); Ghafari et al., (2017); Konecnik & Gartner (2007); Qiao et al., (2022). This has also a new contribution to the literature on the brand equity of tourism destination model. Second, this study used a PLS SEM approach from the domestic tourist’s point of view traveling to Dong Thap province to evaluate and vaildate the causal relationships among the proposed model and the likelihood to travel. Thus, this finding improves not only the knowledge of brand equity of destination but also the insight into predicting of domestic visit intention behavior.
Practical Implications
The results of the current study can provide local authorities with better ways to create the brand equity of tourism destination. Firstly, brand awareness is found to be effective in brand image, perception of service quality, value of destination brand, loyalty to destination brand, and destination brand trust. Therefore, the local government should try to improve tourists’ awareness of tourism destination. Second, the findings revealed that both uniqueness of destination brand and reputation of destination brand are prominent antecedents of the destination brand image. This implies that the local tourism government should try to identify the unique features and enhance the reputation of the destination to appeal to the tourists as well as to promote domestic tourism industry. For example, the famous, unique, reputation of Dong Thap province is reputed as “the land of the lotus”. As a result, perception of tourism service quality is one of the most significant compoments contributing to the equity of destination brand. The local government should improve the quality of products/services to satisfy tourist; and brand loyalty, as well as increase the value of brand to tourists. The results also show that the image of destination brand, destination brand trust, brand recognition, the value of destination brand, and brand satisfaction are as the important factors that are contributed to tourism destination brand loyalty. This result implies that tourists who perceive high perception of quality, high value, high satisfaction, good perception of image, and awareness about the destination will make tourists more loyalty to the certain destination and lead to affecting the likelihood to travel there again.
In conclusion, the study aims to test the effectiveness of new tourism destination brand equity model and to evaluate and validate the complex relationships among the dimensions of brand equity of tourism destination, and the significant influence of these constructs on the likelihood to travel in a tourism destination context. The above findings clarified that the new tourism destination brand equity model has a positively and significantly relationship with travel intentions. The current study provided both theoretical and practical contributions. The study has contributed to the theoretical framework development of a new framework model for the tourism destination brand equity and explained the interrelationships among nine components of brand equity of destination and the likelihood to travel. The practical implications of this study suggest that the local government not only focuses more on branding, improving, and developing tourism destination brand equity but also focuses on providing better facilities that reflect high service quality, value, trust, image, and awareness of the tourism destination brand equity that tourist wish to visit.
RESEARCH LIMITATIONS
The finding of this study provides both theoretical and practical insights, but this study has certain research limitations that may affect the results of the current study. First, the empirical research is considered as only the domestic tourists’ point of view who travelled to Dong Thap province. Thus, the analysis was limited to domestic tourists’ perspective on destination brand equity. Further research would include international travellers. Second, this study is survey in a random selected of the tourists who travelling to Dong Thap province which has its limitations. Although, this way of data collection is convenient. Further research may try use other different survey technique to an insight understaning of travel intetion. Third, there still have other elements that create brand equity models of destinations. Further research should insert the additional constructs to destination brand equity model that might have helped a comprehensive understanding of tourist behaviour towards destinations. Finally, further research can evaluate va validate differences between pre-trip, during the trip, post-trip as well as repeated tourists to gain an insight into evaluating the influence of tourism destination brand equity on the likelihood to travel from the viewpoints of the domestic tourists.