INTRODUCTION
Tourism plays an indispensable part in the global economy and societal development (WTTC, 2020). It is one of the biggest reasons for most human mobility in today’s modern world. However, the unfortunate COVID-19 breakout has left the globe at a standstill (El-Said & Aziz, 2021). The speedy rise of COVID-19 compelled nations to take radical decisions (Kement et al., 2022). Governments around the globe implemented several restrictions like closing borders, community lockdowns, shutting down various public places and suspending travel to avoid the transmission of the virus (Anyanwu & Salami, 2021). Tourism businesses were among the first to be closed down post the introduction of various measures to control the virus and tourism activities and are likely to be among the last to fully re-open. Loss of confidence among travellers, loss of revenue to businesses and entrepreneurs, loss of employment and fear of the unknown xenophobia among people led to nationwide lockdowns in most of the world’s regions (Chirisa et al., 2020).
The repercussions of the pandemic have been felt throughout the economy and the fast recovery of this industry calls for a collaborative effort (WTTC, 2020). Inaccessibility of tourism destinations would be a big hindrance causing stagnancy in the growth and development of tourism activities. This is where the ‘Virtual Tourism’ concept comes into consideration. Due to the latest innovations in Virtual Reality (VR) apps and content creation tools, it can be effectively utilized to market and promote
tourist places as VR can provide potential visitors with a more in-depth view of a place without actually visiting it, which could affect their decision-making procedure when picking a destination (Lu et al., 2022). Such technology has made it possible for people to move anywhere virtually by simply wearing VR devices and using VR applications (Kim et al., 2018). Thus it is being advocated as an ‘alternate for an actual visit and other tourism products’ (Cheong, 1995) and can be exploited widely for reinstating tourism in such a pandemic situation. The pandemic heightened the importance of developing virtual tourism spaces to benefit the tourism business (Godovykh et al., 2022).
Modern virtual tours have enormous potential in the tourism industry. Visitor centres, tourist boards, and national heritage sites have all rapidly followed the trend of virtual tours all over the world. India’s Ministry of Tourism in recent years launched an android app that provides advanced virtual tours of various attractions in many cities, straight on their smartphones. This application provides users with a panoramic view of touristic sights of any included destination to promote Indian tourism (Ghosh, 2016). This was an unforced indication by the government that VR practices shall be put to proper use in the tourism sector. Promoting virtual tours during the pandemic situation could be a pivotal means to increase the prospects of tourism by showing the mesmerizing beauty of tourist destinations virtually. It will not only fulfil the current desire of people but would also augment the amount of tourist visits in the future as many studies have posited that VR is a very effective tool for marketing (Williams, 2006; Huang et al., 2016) which could popularise many tourism destinations.
Virtual tourism has a lot of potential that could be used in this pandemic era to aid the tourism industry (Lu et al., 2022). However, minimal attention has been received from both industry and academic viewpoints. Thus, the present examination was steered to accomplish certain theoretical objectives- The first one is to develop an extended TPB model; the second is to test and validate the model, which is to assess the behavioural intention of people toward virtual tourism (via personal devices and through travel agencies) instead of on-site visits at times of the COVID-19; and third is to highlight theoretical and practical inferences of the investigation based on its findings. For this, researchers have applied Ajzen’s (1991) well-established Theory of ‘TPB’ to analyse how its variables i.e. Attitude, Subjective Norms, Perceived Behavioural Control (ATT, SN, PBC) along with Perceived Security (PS) could influence the consumer intention for performing virtual tourism. Thus, this study supplies understanding in explaining consumer behaviour when exposed to VR for virtual tours and offers researchers and professionals with an empirically validated theoretical model. Moreover, this study also offers useful insights to industry practitioners specifically dealing in virtual tours for their businesses by showcasing which variables have more potential to influence consumer intent towards virtual tours.
REVIEW OF LITERATURE AND DEVELOPMENT OF HYPOTHESES
Information technology has substantially added to the tourism transformation by altering old methods of tourist business and the experiences linked with tourism-related goods (Pedrana, 2014), resulting in the emergence of a new tourism model; Virtual Tourism (VT). VT is a process that provides an experience of extremely real places in a 3D virtual world using multiple visualisation technologies, primarily VR (Zhang et al., 2022). As per the new trends, VT also includes movement in time and space (Toivonen, 2022). It occurs in the digitally formed reality, identical to a real expedition confined to a brief excursion and includes all actions of a person experiencing the travel illusion through time and space (Roman et al., 2022) using VR devices. The emergence of VR enabled tourists to become active participants in the Virtual world (González-Rodríguez et al., 2020). As per Harris and Reid (2005), a VR system combines audio, video, animation and graphics related to the environment to communicate and interact with people–machines and provide a new visual and interactive interface between 2D and 3D human-machine. The rise of VT as a legitimate travel option has implications for the way governments approach the industry as a whole, and it has also been successfully employed as a promotional tool for tourism destinations (Zhang et al., 2022).
VR technology has become a part of a broader trend toward more technologically advanced methods in the travel industry (Roman et al., 2022). By simulating real-world experiences, VR is a highly effective technique for stimulating tourists’ desire to travel (Zeng et al., 2022). In addition to traditional tourist attractions, the potential for virtual space travel is rapidly expanding, which will have profound effects on how humans relate to outer space (Damjanov & Crouch, 2018). In times of COVID-19, tourists avoid travel due to unpredictable situations and to maintain social distancing. Hence, VT can be a great alternative way for engaging in tourism activities. Earlier studies have established VR benefits for selling, marketing, management and preservation of the heritage (Gibson & O’Rawe, 2017; Moorhouse et al., 2017). Now, amid COVID-19 VR technology can be used to maintain revenues and sustain the tourism businesses (Itani & Hollebeek, 2021). Its application and usage intensified due to the pandemic (Yung et al., 2021). However, to get the most out of this technological investment, users will need to engage in VR tourist activities regularly and be motivated to visit the locations shown in the VR setting, which is vital in pandemic-like scenarios (Leung et al., 2023). Even when the pandemic will have passed, individuals will still have safe and convenient options in the form of VT, which will help the industry rebound (Lu et al., 2022). There are substantial upcoming difficulties that can be met by virtualizing the travel experience (Godovykh et al., 2022). Studies that focused on COVID-19, TPB, IT usage and Intention are displayed in Table 1.
Theory of Planned Behaviour (TPB)
Ajzen (1991) presented TPB as an extended form of Theory of Reasoned Action (TRA), serving as an effective means for predicting diverse behaviours. TPB along with TRA posits that humans are fundamentally seen as rational decision-makers (Han et al., 2011). Both theories elucidate the effect of ATT and SN on the targeted behaviours, but TPB comprises perceived behavioural control as an added factor influencing intention (Lu et al., 2007). Therefore, it predicts the tendencies specifically Attitude, Subjective Norms, and Perceived Behavioural Control. As compared to TRA, TPB is more frequently used in several studies to assess individual intention towards a certain behaviour (Quintal, et al., 2010; Jeng et al., 2020; Sujood et al., 2022). TPB provides more specific information to help steer research progress in a particular subject (Mathieson, 1991). It is a broadly employed theory in the sector of tourism to determine the travellers’ decision-making process and behavioural intention (Lam & Hsu, 2006; Kim & Hwang, 2020; Wu, et. al., 2017). Behavioural intention (BI) refers to someone’s “subjective probability” of engaging in a given behaviour (Kuo & Yen, 2009). BI also projects people’s likely future acts (Tavitiyaman et al., 2021). Individual intent to adopt VR grew in tourism in the course of the pandemic, as it was viewed as a safer, more vigilant, and economical alternate to traditional travel. Virtual experiences have also been shown to produce similar degrees of feelings, attitudes, and behavioural intentions as actual travel (Godovykh et al., 2022). More significantly, there are considerable studies that have investigated internet technologies with TPB due to the new technological impact on the tourism sector (Lu et al., 2022; Ulker-Demirel & Ciftci, 2020). Following the recent inclination in research, authors have applied ATT, SN and PBC, with an additional construct Perceived Security (PS) for understanding the BI towards experiencing VT during COVID-19. Building on the extensive literature review of prior research four hypotheses are formulated.
Attitude
Ajzen (1991) defines attitude (ATT) towards a certain behaviour as the prime foreteller of intention, which can be explained as a person’s whole assessment of a specific action or behaviour. Regarding VT, this variable showcases the ATT of users (favourable or unfavourable) towards the live experience people have while on the virtual tour (De Canio et al., 2021). Many researchers in different contexts of tourism and technology found that ATT is an overall evaluation of an individual’s reaction to being persuaded to partake in a behaviour that significantly influences his intention to accomplish a behaviour (Lee et al., 2020; Pahrudin et al., 2021; Choe et al., 2021). As per Lu et al. (2022) ATT regarding VT (i.e. considering VT as an alternate way of entertainment creating relaxation) is positively linked with the usage intention towards VT amidst the COVID-19 pandemic. This shows that the overall ATT to visit a particular destination physically during the COVID-19 replicates the state of mind that leads a behaviour to visit a particular destination, and this kind of ATT supports one’s BI (Ajzen, 1991; Tussyadiah et al., 2018). Hence, it is hypothesised that:
H1: ATT has a significant and positive effect on the BI of experiencing VT during COVID-19.
Subjective Norm
Subjective Norms (SN) are an individual’s assessment of the societal expectations and influences on him/her to partake or not to partake in a given behaviour (Ajzen, 1991). Multiple studies have showcased the important effect of SN on BI (White Baker et al., 2007; Quintal et al., 2010; Zhuang et al., 2021; Hasan et al., 2020; Pahrudin et al., 2021). SN is assumed to be an important determinant in the foundation of BI. People be likely to emulate the referent group members like family, friends, peers and coworkers when it comes to using VT during COVID-19 which can happen in a variety of ways, such as; by observing others’ behaviour, sharing experiences, and through formal or informal communication (Lu et al., 2022). A strong influence of salient referents on one’s decision to conduct a behaviour is well established by prior studies (Cheng et al., 2006; Bae & Chang, 2021; Zhuang et al., 2021). Thus, the intention of one will probably increase when family, relatives, friends or colleagues, or any other social pressure group recommends VT instead of physical tourism in COVID-19. Hence, it is hypothesised that:
H2: SN has a significant and positive effect on the BI of experiencing VT during COVID-19.
Perceived Behavioural Control
Perceived Behavioural Control (PBC) talks about the individual’s observation of the easiness or difficulty to a particular conduct (Ajzen, 1991; Ashraf et al., 2019). It shows one’s perceptions concerning internal and external behavioural constraints (Lin, 2006). In prior consumer behaviour research, this construct has been shown to have a considerable impact on an individual’s intent to undertake a behaviour (Nunkoo & Ramkissoon, 2010; Quintal, et.al., 2010; De Canio et al., 2021; Sujood et al., 2022). Along with ATT and SN, PBC has a significant influence in shaping one’s intention (Yang et al., 2020) towards virtual tours to have a contactless tourism experience. De Canio et al. (2021) revealed a positive relationship amid PBC and the intention towards visiting a food production place using virtual tours. As per Lu et al. (2022) the PBC has a positive association with the usage of VT, demonstrating that people who have the knowledge and understand the use of VT using different e-devices are likely to engage in VT during COVID-19. This implies that if an individual has all the essential resources and capabilities then
it will likely increase his/her intention towards VT during COVID-19 instead of an on-site visit. Hence, it is hypothesised that:
H3: PBC has a significant and positive effect on the BI of experiencing VT during COVID-19.
Perceived Security
Perceived Security (PS) is the opinion of the consumer about the nature of the equipment and methods utilised for the storage and transfer of personal data (Kolsaker & Payne, 2002). PS is a concerning issue encountered by consumers who intend to acquire products or avail of any service using virtual mode (Suh & Han, 2003). Variables such as protection, encryption, verification, and authentication precede PS, which ultimately determines consumer perception of security (Kim et al., 2011). From a tourist’s view, PS can be explained as the degree of related security that users feel when surfing a website. As far as VT via Travel Company is concerned, PS is dependent on the dependability of proper enjoyment and payment mechanism as well as the transferability and storage of personal data. In the pandemic context, PS related to VT could also be measured in terms of the secure environment that VT provides due to zero human interaction while experiencing any destination virtually. Users’ viewpoint related to security is a cognitive process that would influence intentions both emotional and behavioural (Lim et al., 2019) towards VT. Hence, it is hypothesised that:
H4- PS has a significant and positive effect on the BI of experiencing VT during COVID-19.
Figure 1 below displays the proposed research model
Figure 1: The proposed research model
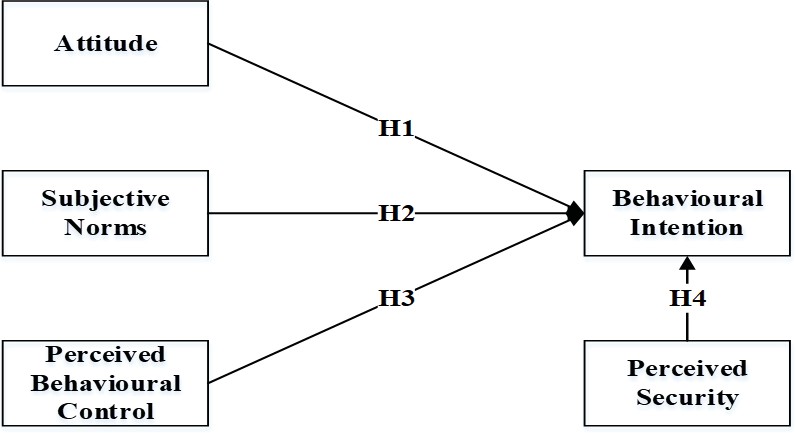
Table 1: Studies focused on COVID-19, TPB, IT usage and Intention
Abbreviations used in the Review:
“VT = Virtual Tourism, VR = Virtual Reality, TPB = Theory of Planned Behaviour, TAM = Technology Acceptance Model, PADM = Protective Action Decision Model, ATT = Attitude, SN = Subjective Norms, PBC = Perceived Behavioural Control, BI = Behavioural Intention, PEOU = Perceived Ease of Use, PU = Perceived Usefulness, ENJ = Perceived Enjoyment, RP = Risk Perception, HRA = Hazard-related attributes, INT = Intention to adopt VTs, TenAS = Tendency to visit Actual Sites, PEA = Peripheral attribute; PIA = Pivotal Attribute; PRE = Presence; FV = Functional Value; EV = Emotional Value, SAT = Satisfaction, SWB = Subjective Well-Being, S-O-R paradigm
= Stimulus-Organism-Response, VR HMD = Virtual Reality Head Mounted Displays”
Data were gathered on a convenience basis by using a structured questionnaire, the link of which was deployed on social networking sites. In order to acquire necessary information quickly and simply, convenience sampling is often used and through an online survey, it becomes easier to approach a larger population of interest (Han & Hyun, 2017). A pilot survey with fifty participants was carried out before the link to the Google form was sent in order to decide whether or not the questions were correct, clear, precise, and simple to grasp. Later on, a google form link was posted over web pages of travel companies that provide virtual tours and on other social networking websites from 1 August 2021 to 15 September 2021, resulting in 536 responses. 41 responses were omitted due to missing values and 87 responses were omitted from those respondents who selected others in the questionnaire under the heading nationality. As per Hair et al. (1998), the appropriate sample size requires at least 15-20 observations per variable. The sample size meets this criterion and is thus appropriate for the present study. The final sample of 408 Indian consumers was considered for the study and analysed using SPSS and AMOS software.
Measurement of Variables
The study led to the model development that was proposed using four independent variables in conjunction with a single dependent variable. On a five-point Likert scale, each variable is measured by three items, for a total of 15 items that respondents rated. All identified items are derived from a review of prior research. Three items determined ATT (Lam & Hsu, 2006), SN were measured by three items (Taylor & Todd, 1995: Mathieson, 1991: Ajzen, 1991), PBC was determined by three items (Taylor & Todd, 1995), Perceived security measured by three items (Kim et al., 2010, Shin, 2010). And Behavioural Intention was determined by three items (Venkatesh et al., 2003).
Out of the total recorded responses, approximately 57 percent are male and 42.4 percent are female. The age group consisting of 21-30 year olds makes up a total of 47.3% of the respondents which is the highest among all. 45.4 percent of respondents are graduates and approximately 48 percent of the respondents are students. 57 percent of respondents have a monthly salary that is up to 40,000 Indian Rupees (INR), and 58 percent of respondents are not married.
Table 2: Profile of Respondents (n=408)
Descriptive Statistics
All variable means range between 3.2059 and 3.8154. The range of standard deviations (SD) is between 1.01569 and 1.30861. Perceived Security (PS) has the greatest mean value (3.8154) of all the variables, while Attitude (ATT) has the lowest (2.2059). The standard deviation for Behavioural Intention was the highest (1.30861), while the standard deviation for Perceived Security was the lowest (1.01569).
Table 3: Descriptive Statistics
Measurement Model
Following Anderson and Gerbing (1988) two-stage technique, structural equation modelling data analysis was conducted to obtain whether the results collected aligned well with the theoretical model presented. The first step that needed to be done was to utilise CFA to examine the convergent and discriminant validity and reliability of the components. In addition, hypotheses were put to the test by deploying SEM, to analyse the connections that existed between the latent variables. The Kaiser-Meyer- Olkin (KMO) value obtained was found to be 0.863, and Bartlett’s test was found to equal 5119.701 with a degree of freedom equal to 105 (P = 0.0001). The most common approach to evaluate the variables’ internal consistency is to evaluate the alpha of the underlying construct and CR values. This is widely considered to be the most reliable technique. The values of Cronbach’s alpha are depicted in Table 4, and these are the values that are utilised to evaluate the reliability of the multiple-item scale. The table values varied from 0.877 to 0.916. The fact that each alpha coefficient had a value that was more than the cut-off value of 0.7 (Nunnally, 1978) demonstrates that an adequate degree of reliability was achieved for each and every construct. The values of CR are also included in Table 4, and all of the CR values are higher above the suggested 0.60 cut-off (Bagozzi & Yi, 1988). The CR values lies from an amazing 0.876 to 0.921. The precision with which a measuring scale can correctly portray the constructs that are the subject of the study is referred to as the construct validity of the scale. Convergent and discriminant validity are concurrently checked to examine the construct validity.
The extent to which two or more items correlate with one another when used to evaluate the same concept is what is meant by the term “convergent validity.” Average variance extracted (AVE) is used to test the convergent validity. As per the Fornell and Larcker (1981), the convergent validity of a concept is considered to be satisfied when the values of the AVEs are larger than
0.5. Table 4 has no AVEs results that fall below the threshold value of 0.5; rather, every one of those results is more than that value. As a result, the paper’s framework is supported by substantial convergent validity.
Table 4: Reliability and Convergent Validity
|
PBC1 |
0.836 | ||
|---|---|---|---|
|
PBC2 |
0.829 | ||
|
PBC3 |
0.735 | ||
|
PS | 0.887 | 0.795 | 0.916 |
|
PS1 |
0.863 | ||
|
PS2 |
0.879 | ||
|
PS3 |
0.759 | ||
|
BI | 0.921 | 0.726 | 0.881 |
|
BI1 |
0.789 | ||
|
BI2 |
0.941 | ||
|
BI3 |
0.932 |
Discriminant validity expresses how unique are the measures of various constructs (Campbell & Fiske, 1959). When the AVE proportion exceeds the coefficient’s square in each dimension, illustrating how one dimension is related to the others, discriminant validity is said to be present (Fornell & Larcker, 1981). As per the findings shown in Table 5, the associated latent constructs AVEs significantly exceed the correlation square that was calculated among the variables. Therefore, in this research, the constructs have gained discriminant validity. The findings indicate it to be a good fit model (χ 2 /df= 2.312, RFI
= 0.918, NFI = 0.929, CFI =0.939, TLI = 0.918, RMSEA = 0.044). According to Browne and Cudeck (1992), the value of RFI demonstrates a poor match but is still acceptable.
Table 5: Discriminant Validity
|
BI |
SN |
PS |
PBC |
ATT | |
|---|---|---|---|---|---|
|
BI |
0.892 | ||||
|
SN |
0.474*** |
0.872 | |||
|
PS |
0.351*** |
0.472*** |
0.852 | ||
|
PBC |
0.181*** |
0.627*** |
0.569*** |
0.838 | |
|
ATT |
0.144*** |
0.757*** |
0.527*** |
0.732*** |
0.847 |
***<0.001, “ATT = attitude, SN = subjective norm, PBC = perceived behavioural control, PS = perceived security, BI = behavioural intention”
4.4. Structural Model
The results of the hypothesis test are shown in Table 6, while Figure 2 shows the final estimated path model. ATT (β = -0.349, t-statistic= -10.196, p <0.001) negatively influences the BI of experiencing VT in the Covid-19 period. SN (β = 0.552, t-statistic
= 16.132, p <0.001) positively influences BI but PBC (β = -0.090, t-statistic = -2.625) is not positively related to BI. At last PS (β = 0.296, t-statistic = 8.633, p <0.001) positively influences the BI of experiencing VT during Covid-19. Hence, hypotheses H2 and H4 are supported but H1 and H3 are not.
Table 6: Results of hypotheses testing
|
Association |
Std β |
t- statistic |
Result |
|---|---|---|---|
|
H1: ATT → BI |
-0.349 |
-10.196 |
Not Supported |
|
H2: SN → BI |
0.552 |
16.132 |
Supported |
|
H3: PBC → BI |
-0.090 |
-2.625 |
Not Supported |
|
H4: PS → BI |
0.296 |
8.633 |
Supported |
Out of all four variables, SN and PS are significant in predicting the BI of experiencing VT in COVID-19 while ATT and PBC
are not and these variables showed about 52% (R 2 = 0.523) of the variance in the BI of experiencing VT during COVID-19.
Figure 2: Final estimated path model
DISCUSSION AND CONCLUSION
This work examined tourists’ BI of experiencing VT during COVID-19 by applying the TPB and its applicability using the core variables, i.e. ATT, SN and PBC with the incorporation of PS. The TPB has been used extensively and is considered a basic model for behavioural prediction. In the study, measuring model efficacy for reflective constructs was evaluated by looking at the criterion of internal reliability, convergent validity, and discriminant validity (Hair et al., 2019). After evaluating the measurement model validity, the hypotheses were tested using the structural model. The suggested model explained 52% (R 2
= 0.523) of the variance in the BI of experiencing VT during COVID-19., which exceeded the minimal threshold value of R 2 =
25%. (Hair et al., 2016). Consequently, the model’s predictive significance is quite high.
The TPB functioned as the study’s foundation, which evaluated tourists’ BI of experiencing VT during COVID-19 by TPB’s original model extension. The results of the research demonstrated that the TPB model is significantly supported in experiencing VT during COVID-19. As a necessary consequence, in accordance with Ajzen’s (1991) standards for advancing the theory, researchers have extended the original TPB effectively both theoretically and empirically. So far to the researcher’s best estimates, there has not been any empirical research that uses the studied variables for examining tourists’ BI of experiencing VT during COVID-19 in the context of India.
The first factor of this study is ATT, based on this study’s findings, ATT does not significantly influence BI (β = -0.349). This is in line with the results of Lam and Hsu (2006). This is an interesting outcome but contradictory to most of the TPB-based studies. The possible reason for this could be that at a time when pandemic is going on people might wish to explore real-life experiences as they are anxious and distressed due to the lockdown. Moreover, since VT is relatively a new concept in India, people are not much familiar with it and might believe that it will not give an authentic experience of travel, which could be the possible reason for this insignificant outcome. The second important construct of BI is the SN, the finding reveals that SN significantly and positively influences (β = 0.552) BI of experiencing VT during COVID-19. It shows the strongest influence on BI among other variables. This result is in line with prior research (Han et al., 2017; Jang et al., 2015; Sparks & Pan, 2009; Chien et al., 2012; Sujood et al., 2021; Hamid & Azhar, 2021; Hamid et al., 2023; Azhar et al., 2022). PBC is the third factor of BI, the result shows that PBC (β = -0.090) does not influence the BI of experiencing VT. This is a surprising finding and contradictory to TPB. But there are pieces of evidence of such findings (Teo & Lee, 2010; Chien et al., 2012; Shen & Shen, 2021; Hamid et al., 2023). The possible reason for the insignificant relationship between PBC and BI in this study could be that India is a developing country and not much technologically centric (Ferris et al., 2022; Misra et al., 2021) as compared to western developed nations. Therefore, people might have trust issues with the technology which could be the reason to restrict their behaviour towards VR-based tours. Here, PS is taken as the level of security that users feel when they intend to experience VT during COVID-19 both in terms of data security and physical security. The finding shows that PS significantly and positively influences (β = 0.296) BI. This observation is similar to previous works (Aggarwal & Rahul, 2018; Salisbury et al., 2001). The addition of PS as an additional variable has yielded positive results which is a matter of focus that how security factors both in the context of data information and human interaction could influence the intention of consumers towards VT during the pandemic. Increased levels of PS will lead to greater intent to experience VT. Hence, there is a need to strengthen the security features of the system of those organizations which deal in VT.
This work adds to the ever-expanding body of previous research on human behaviour with virtual world adoption. This research integrates TPB theory constructs along with PS and shows how VR technology could be intelligently used by travel agencies to aid the tourism industry and to fulfil travel desperation during a pandemic situation, making it one of a kind study. In the present era where human lives are technology-driven, this study complements current developments in the study field of the implementation of technology in the tourism business. Furthermore, it adds to the expanding body of work on COVID-19, which is a go-through topic nowadays in research. TPB theory is implemented almost in every field of research but its usage to guide BI towards a certain activity at times of pandemic situation would completely a new input to the field. R 2 indicates the predictive power and effectiveness of the research framework. As per Armitage and Conner (2001) research, the R 2 represented the variance of 27 percent and 39 percent in behaviour and intention with respect to TPB variables. In this study, the value of R 2 exceeded this percentage i.e. 52% which exhibits the high predictive power of the proposed model, thus representing a significant advancement in the field. The incorporation of PS as an additional variable with TPB significantly contributes to the literature as it has shown a positive impact on the BI of people towards VT. No other study has included PS with TPB in the Indian context, therefore it is a unique addition to the literature. Moreover, this study will work as a blueprint for upcoming studies for assessing consumer intention toward a certain behaviour during any pandemic situation.
Practical Implications
Travel and Tourism are vital contributors to the establishment of jobs, socio-economic and cultural development globally (McCabe & Qiao, 2020). Keeping in mind the importance of this sector, formulating revival strategies for now and for the future is of utmost significance. In this regard, the present study will provide insight to travel agencies and other travel field practitioners in many ways. Firstly, the resultant outcomes could provide an outlook to destination marketers, policymakers travel companies and other related entrepreneurs about factors that could influence the intention of people toward experiencing VT. Secondly, positive associations between PS and BI have been observed in the present study, this finding gives direction to travel companies and practitioners regarding security aspects, that how perceived information (data security) and physical (no human interaction) security concerns could influence the intention of people towards VT. Thirdly, as ATT and SN did not show a positive influence on BI, it gives an idea to VT business operators that VT in India needs to be promoted more to favourably shape individuals’ behaviour towards it. Moreover, Virtual tour providers must ensure that the VT experience should encompass attributes that appeal to visitors with diverse interests (El-Said & Aziz, 2021). Lastly, in difficult economic times, VT could generate new business prospects for tourist providers and new specialised markets for specific customer groups (Godovykh et al., 2022). In post-pandemic times, the managers can modify the content design and could use it as an influential tool for the marketing of potential tourist destinations that could motivate people to physically visit a destination by assisting them in the pre-decision formation process before actual visit to a place. However, VT in any way cannot be a full-time replacement for on-site tourism activities, although it is a novel way to visit a location virtually for the purpose of entertainment, that can also be utilised in crisis times.
LIMITATIONS AND DIRECTION FOR FUTURE RESEARCH
One of the prime limitations was time constraints. The data collection process was done over a short period due to which the number of responses is limited. Future researchers should consider a larger sample size. Furthermore, data was gathered online because of COVID-19 constraints so the respondents were only those who are technologically advanced and have access to internet facilities, due to which offline consumers were neglected. Future studies can consider both online and offline consumers. The sudden attack of the virus affected the mindset of consumers to a great extent, making the consumers very unpredictable which could be a reason for the insignificant association between ATT and BI, SN and BI in this study. Moreover, the intention might not necessarily translated into to actual behaviour therefore future studies can include actual behaviour as a variable to get more detailed findings. This research is based on Indian consumers and therefore needs to be cautious before generalizing the results. Lastly, the researcher has used four variables ATT, SN, PBC and PS to measure the BI. Additional research could include more variables such as Perceived Trust, Perceived Safety, Perceived Convenience, etc. along with the above four variables.